SDEWES INDEX
related metrics presents an opportunity to trigger policy learning, action, and cooperation to bring cities closer to sustainable development.
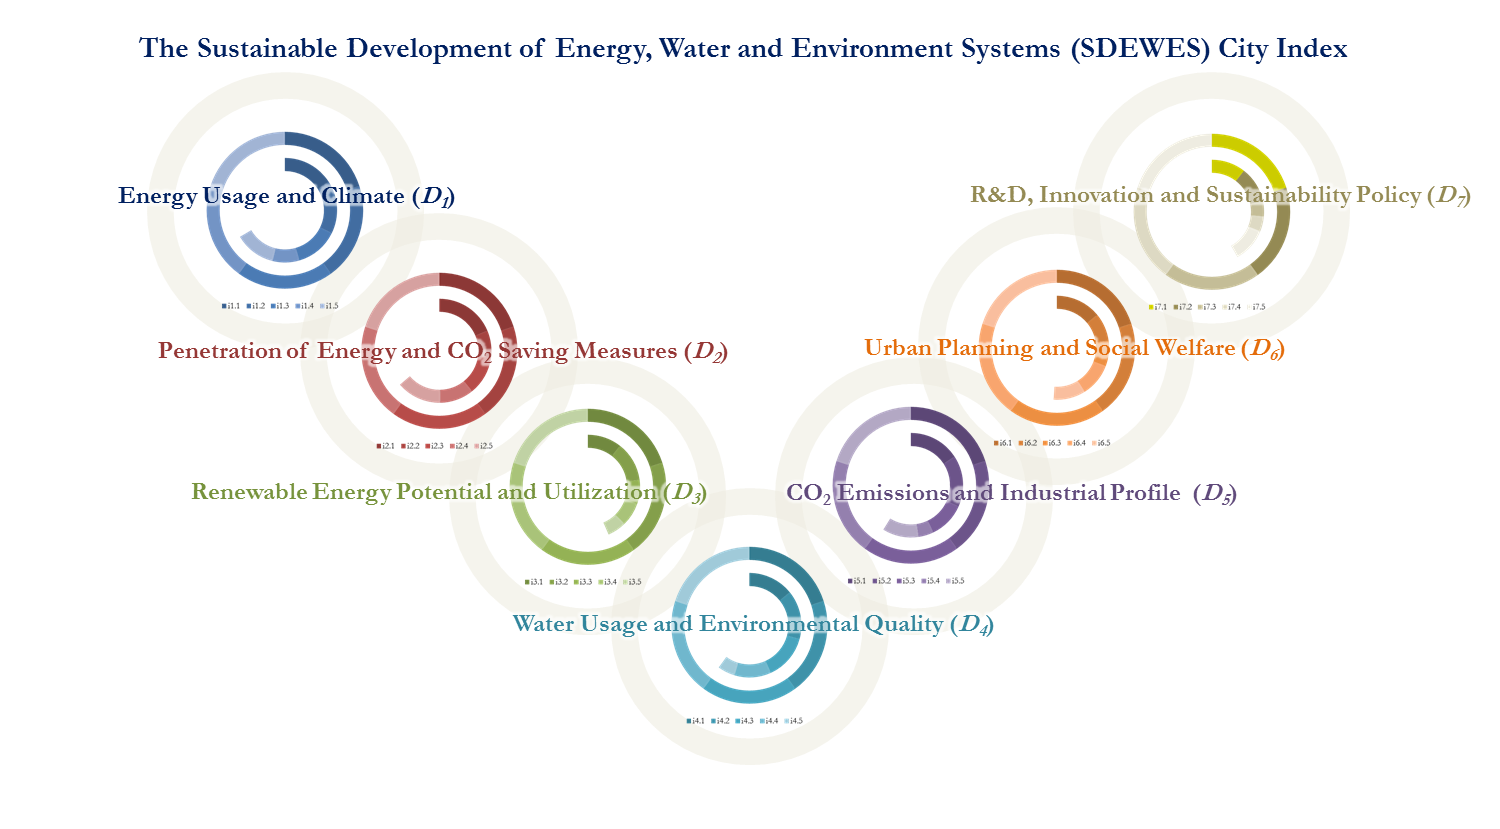
Benchmarking the performance of cities across metrics related to energy, water and environment systems presents an opportunity to trigger policy learning, action, and cooperation to bring cities closer to sustainable development. The Sustainable Development of Energy, Water, and Environment Systems (SDEWES) Index benchmarks cities based on 7 dimensions, 35 main indicators, and about 25 sub-indicators. The namesake of the Index is the SDEWES Centre and Conference series that encourage a multi-disciplinary approach to the issues and challenges of sustainable development. Cities with well-rounded and above average performances in multiple dimensions score higher in the SDEWES Index and take place in higher quartiles of the sample.
City Sample
The SDEWES Index is currently applied to 120 cities, which correspond to samples of South East European cities, Mediterranean port cities, and other cities around the world based on multiple criteria to increase geographical diversity and the representation of cities of presenting authors. Such a sample, which has been developed through six different SDEWES Conferences, includes cities from Europe as well as Africa, Asia, and the Americas. In total, 88% of the cities are signatories to the Covenant of Mayors for Climate & Energy while other cities are integrated into the sample based on data availability. The data of the cities in the sample are renewed with the release of new monitoring reports by the cities as well as updates in the main data sources.
Dimensions
The 7 dimensions that define the SDEWES Index are overviewed below. Each dimension contains the normalized values of 5 main indicators, all of which are aggregated into an index value. Winsorization is applied to any outliers in the dataset as identified based on higher order moments. The maximum possible score in any dimension and the overall index is a score of 50.000 while the performance of an average city receives a score of 28.441 as summarized here.

The “Energy Usage and Climate” dimension represents the present state of urban energy usage, including in residential, tertiary, and municipal buildings, private/public transport and the municipal vehicle fleet. The magnitude of energy usage measures the impact of cities on energy spending to satisfy energy services. Energy usage per capita places energy spending in the context of population. The total heating and cooling degree-days are used to adjust urban energy usage with climate. The final to primary energy ratio represents the overall efficiency in the energy system. + Click here to see the indicators
The dimension on “Penetration of Energy and CO2 Saving Measures” scores the status of measures to reduce urban energy spending and CO2 emissions.
These include urban energy system characteristics, such as the share of district heating and/or cooling based on combined heat and power and any progress towards lower temperature networks.
Such measures enable the better use the quality of energy resources (exergy). Other indicators include energy savings in end-usage, including net-zero buildings and districts,
the density of the public transport network based on the total length of urban rail per square kilometer as well as the presence of decentralized measures, such as bicycle sharing, and efficient public lighting armatures.
+ Click here to see the indicators
The “Renewable Energy Potential and Utilization” dimension considers the solar energy, wind energy, and geothermal energy potential of the city and the utilization of this potential to produce useful energy output, particularly electricity. The utilization of renewable energy is also assessed based on the share of green energy in transport, including biofuels that need to be obtained in a sustainable manner and electricity. To excel in this dimension, a city with a relatively higher renewable energy potential also needs to have a higher share of renewable energy usage in the energy mix. + Click here to see the indicators
The “Water Usage and Environmental Quality” dimension brings together indicators that relate to domestic blue water consumption per capita, water quality, and local air quality based on annual mean particulate matter measured at PM10.
The indicators on ecological footprint and biocapacity per capita are taken from available data at the national, regional, or city level. Such indicators place the city in the context of any ecological deficit or reserve that can affect environmental quality.
+ Click here to see the indicators
The dimension on “CO2 Emissions and Industrial Profile” quantifies the CO2 emissions in the city and the average CO2 intensity of the energy mix, which can be minimized based on energy systems with greater shares of renewable energy.
Energy-intense sectors that are included in EU ETS are surveyed to determine the industrial profile of the city if any. For a broader scope, the airport servicing the city is assessed based on passenger traffic, carbon accreditation, and renewable energy measures.
+ Click here to see the indicators
The “Urban Planning and Social Welfare” dimension puts forth aspects that are related to waste and wastewater management, compact urban form and green spaces, as well as economic and educational opportunities and well-being towards a thriving citizenry.
The sub-indicators include the recycling and compositing share, compliance with the Urban Waste Water Treatment Directive, the share of impermeable surface area, and sprawl that requires urban planning to limit land-use changes.
+ Click here to see the indicators
The “R&D, Innovation and Sustainability Policy” dimension has a cross-cutting scope that couples the ambitions of the city to reduce CO2 emissions by the targeted year and the capacities that are made available to local actors to create solutions. This includes R&D spending as a ratio of GDP, priorities in energy, environment and smart cities, patents with European Patent Office green patent codes, the number of universities and institutions that are located in the city and included in the Scimago top 1000 institution rankings, and the h-index of scientific publications. + Click here to see the indicators
Implementation, Results and Best Practices: SDEWES City Index Atlas
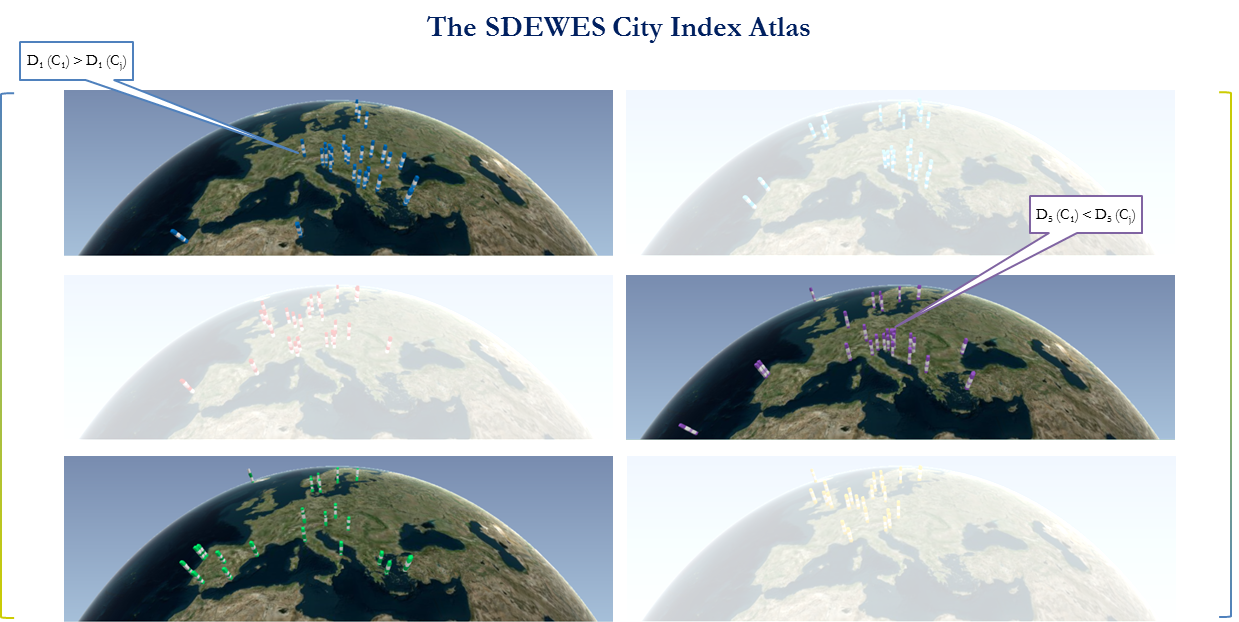
The synthesis of data from the 120 cities around the world for the 35 main indicators involves 4,200 inputs that are mapped spatially in a SDEWES Index Atlas. The atlas identifies the cities that take place in certain quartiles of the 7 dimensions and maps the normalized scores that are obtained. The Plenary Lecture on “Benchmarking the Sustainability of Urban Energy, Water and Environment Systems with the SDEWES City Index and Envisioning Scenarios for the Future” at the 12th SDEWES Conference provides the atlas mapping. The related sections are also downloadable here that contains best practice examples based on quartile performances.

SDEWES Index Interactive Table
According to the results of the SDEWES Index, the lower 25% of the sample is characterized to contain the “Challenged Cities” that face challenges in multiple dimensions. The cities that take place in the second quartile at the lower 25-50% of the sample continue to be in need for strategic approaches to address remaining challenges, namely “Solution Seeking Cities.” Above the median value, the “Transitioning Cities” are characterized to have certain strengths at the top 50-75% of the sample while the “Pioneering Cities” have strengths in multiple dimensions based on a performance at the top 25% of all cities. These results are summarized in the interactive tables below.
Lower 25% of the Cities: Challenged Cities
Lower 25-50% of the Cities: Solution Seeking Cities
Top 50-75% of the Cities: Transitioning Cities
Top 25% of the Cities: Pioneering Cities
(*) 12 districts on the Thrace side
(**) District 1 with SEAP
City Pairings for Policy Learning
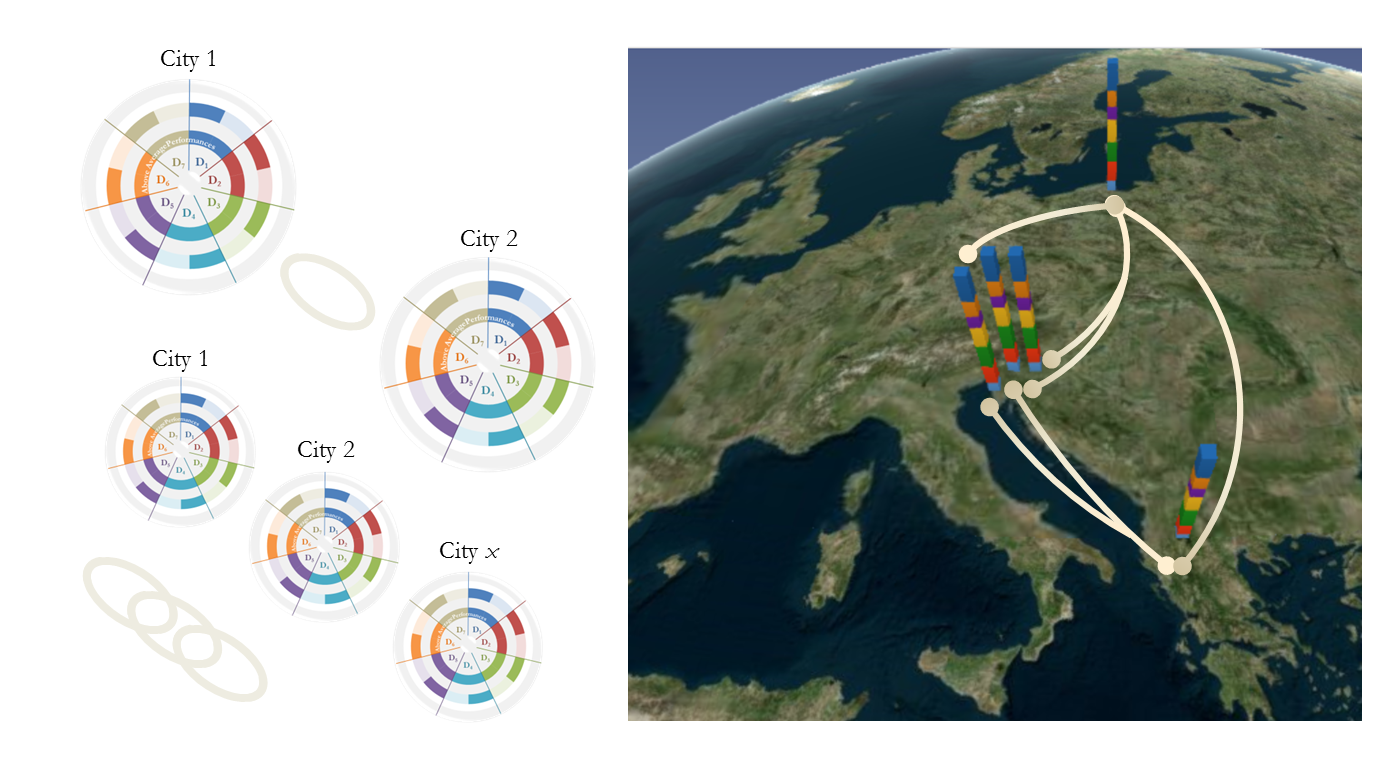
The SDEWES Index aims to support a “science of cities” through the comparison and ranking of city performance as well as a process of policy learning and collaboration towards attaining better levels of performance in the future. With this aim, a pattern search algorithm was applied to identify those cities that may have above/at or below the average city performance in the same dimension across all dimensions. In total, 20 pairs between 2 cities and 13 pairs between 3 or more cities were identified for a total of 33 pairs between 97 cities in the sample. Some of the city pairs had opposite patterns with other city pairs. The transfer of knowledge and experiences from the pioneering cities to the challenged cities can also trigger opportunities for collaboration.

Towards a SDEWES Aware City
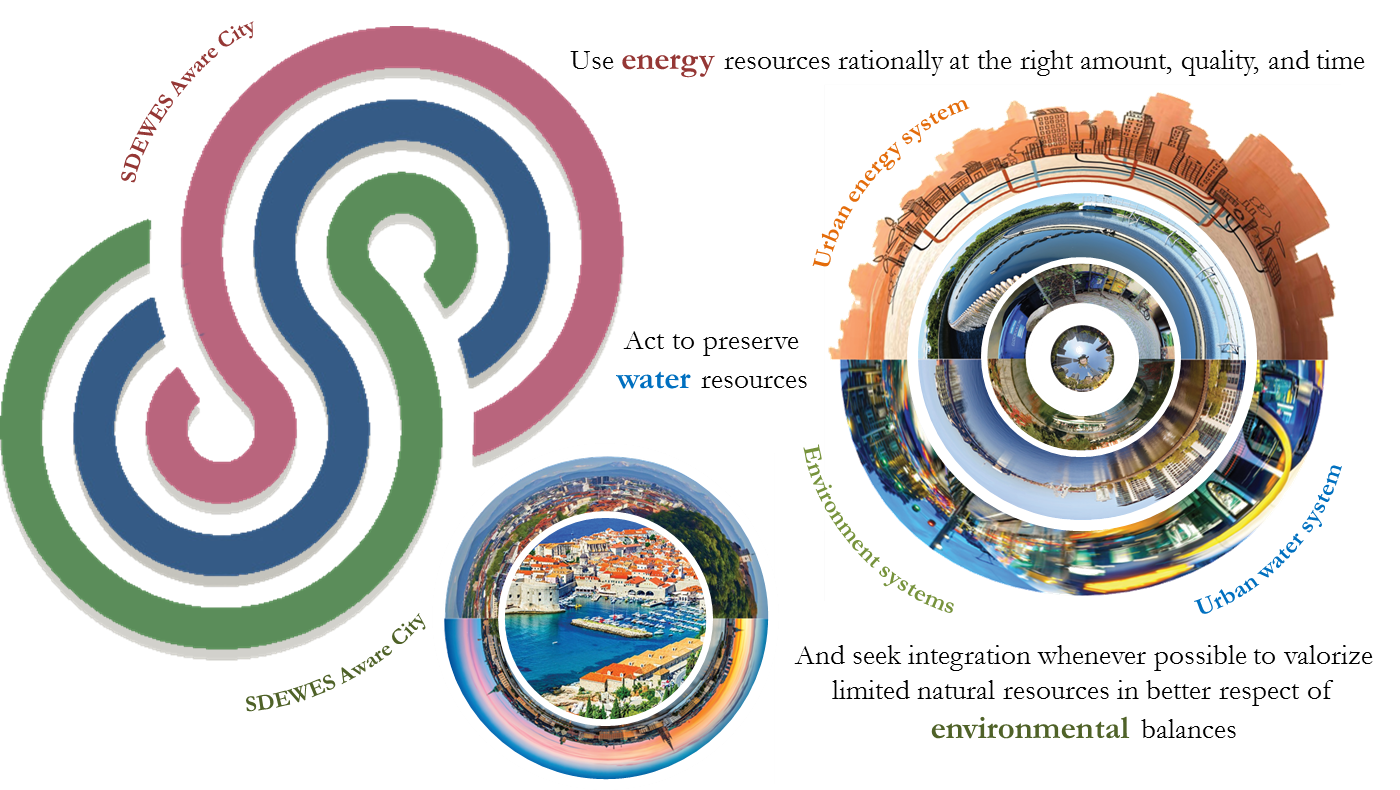
Decision-makers are encouraged to use the results of the SDEWES Index to evaluate the overall score and dimension performance of a specific city and consider solutions that will improve the value of multiple indicators. Collaboration and taking integrated action by linking the urban energy, water and environment systems are a key aspect of realizing a more sustainable city. The SDEWES Index provides ample opportunities to encourage cities in using energy resources rationally at the right amount, quality, and time towards 100% renewable energy systems, acting to preserve water resources, and seeking integration whenever possible to valorize limited natural resources in better respect of environmental balances. Is your city a “SDEWES Aware” City?

Possible Scenarios for the Future
A foresight of trends that will have an impact on cities indicates that the average city performance will dynamically increase over time. Cities have a crucial role in bending the curve of global CO2 emissions by the year 2020. In addition, the Sustainable Development Goals of the 2030 Agenda clearly delineates goals for sustainable cities and communities, renewable energy, clean water and sanitation, as well as climate action with implications for urban systems. A backcasting of the values of the best performing city to the average city by target years represents the presence of opportunities for rapid progress. Scenarios in which cities utilize a given share of the available residual heat and urban biowaste as put forth by the Heat Roadmap Europe Pan-European Thermal Atlas take place among examples of the numerous possibilities.
References
Kılkış, Ş., Composite index for benchmarking local energy systems of Mediterranean port cities, Energy, Vol. 92, No. 3, pp. 622-638, 2015. doi.org/10.1016/j.energy.2015.06.093
Kılkış, Ş., Sustainable development of energy, water and environment systems index for Southeast European cities, Journal of Cleaner Production, Vol. 130, pp. 222-234, 2016. doi.org/10.1016/j.jclepro.2015.07.121
Kılkış, Ş., Sustainable Development of Energy, Water and Environment Systems (SDEWES) Index for Policy Learning in Cities, International Journal on Innovation and Sustainable Development, Vol. 12 No.1/2, pp. 87-134, 2018. doi.org/10.1504/IJISD.2018.089263
Kılkış, Ş., Benchmarking South East European Cities with the Sustainable Development of Energy, Water and Environment Systems Index, Journal of Sustainable Development of Energy, Water and Environment Systems, Vol. 6(1), pp. 162-209, 2018. doi.org/10.13044/j.sdewes.d5.0179
Kılkış, Ş., Application of the Sustainable Development of Energy, Water and Environment Systems Index to World Cities with a Normative Scenario for Rio de Janeiro, Journal of Sustainable Development of Energy, Water and Environment Systems, Vol. 6(3), pp. 559-608, 2018. doi.org/10.13044/j.sdewes.d6.0213
Kılkış, Ş., Benchmarking the Sustainability of Urban Energy, Water and Environment Systems with the SDEWES City Index and Envisioning Scenarios for the Future, Plenary Lecture at 12th SDEWES Conference, www.dubrovnik2017.sdewes.org/lectures.php#IL4
Kılkış, Ş., Benchmarking the sustainability of urban energy, water and environment
systems and envisioning a cross-sectoral scenario for the future, Renewable and Sustainable Energy Reviews, Vol. 103, pp. 529-545, 2019. doi.org/10.1016/j.rser.2018.11.006
Kılkış, Ş., Data on cities that are benchmarked with the sustainable development of energy, water and environment systems index and related cross-sectoral scenario, Data in Brief, Vol. 24, 103856, 2019. doi.org/10.1016/j.dib.2019.103856
For inquiries and comments regarding the SDEWES Index, contact:
siir.kilkis@tubitak.gov.tr (Prof. Şiir KILKIŞ, SDEWES ISC Member)
