

In the late 1960s, post-war economic growth was considered one of the greatest achievements of modern societies, bringing stability and increasing overall prosperity worldwide. But as early as the 1970s, warnings emerged that high economic growth could, in the long term, lead to overexploitation of natural resources, leading to social and natural collapse. On the other hand, a group of economists argued that sceptics underestimated the power of technological progress, as well as the power of price changes which, in theory, would automatically regulate the supply of and demand for natural resources, making it unnecessary to reduce economic growth. Some empirical research has confirmed the existence of an inverted U-shaped environmental Kuznets curve, which means that economic growth and an intensive industrial production have a negative impact on pollution up to a certain point, but after a certain threshold the impact becomes inverted, i.e. higher economic growth leads to a reduction in pollution [1]. There is also another group of studies which conclude the opposite, that the environmental Kuznets curve is U-shaped, which means that higher economic growth leads to more pollution [2].
It is a fact, however, that the Industrial Revolution has led to high economic growth and the transition of the world economy from an organic one based on animal and human labour to an inorganic one based on fossil fuel energy production. Increased consumption of fossil fuels also increases the release of carbon dioxide into the atmosphere, which leads to the trapping of emitted heat in the atmosphere and, in the long term, to global warming and climate change [3]. It was the recognition of this problem, i.e. the impact of accelerated economic growth on nature, that led to the establishment of the Kyoto Protocol in 1997 under the supervision of the United Nations, which aims at sustainable growth and mitigation of global warming and climate change [4]. Newest attempts to control the climate change within global sustainable endeavours include the Paris agreement [5] and the establishment of UN Sustainable Development Goals [6].
Economic growth as an economic phenomenon is often linked to living standards, in which case it usually refers to the income available to a country or an individual. However, the explanation most often does not include the opportunity costs of destroying nature. Even when the negative aspects of economic activity on the environment are accounted for, the decreasing part of the Kuznets curve (decarbonization) is related to several socio-economic and climate change challenges [7]. Economic growth and harmful emissions are influenced by a variety of factors. Thus, the focus of research in this study is to analyse economic and energy use factors, with an emphasis on their impact on the environment in the whole sample and in two groups of countries which differ in economic development.
The aim of this paper is to estimate the relevant econometric models to explain how certain economic and energy factors have affected environmental pollution in the period from 2002 to 2023 in a panel of 112 countries worldwide. The paper tests the following hypotheses:
H1: The impact of gross domestic product per capita, industrial production, urban population, energy intensity, renewable energy share and international trade on carbon dioxide emissions is statistically significant.
H2: In the observed sample, the relationship among economic activity, measured by gross domestic product per capita, and pollution, measured by CO2 emissions, is in the form of the environmental Kuznets curve.
H3: The impact of the estimated factors on CO2 emissions differs between developed and less developed countries.
The hypotheses will be tested by performing a regression analysis of panel data. The next section reviews the existing empirical literature. It is followed by the presentation of the empirical analysis, including data description and discussion of the empirical results. The last session concludes the paper with its main findings.
The growing awareness of pollution at a global level in the 21st century has led to a great interest among economists in exploring the correlation between economic activity and the amount of pollution. In this section some of them are presented. For example, [8] analysed the existence of an environmental Kuznets curve in Italy in her study covering the period 1861-2002. Her main finding is that there is no inverted-U-shaped Kuznets curve, which means that Italy had not reached a tipping point by that time. Nevertheless, a positive correlation between CO2 emissions and income was found. On the other hand, [9] analysed 18 European countries over the period 1960-2005 and found that an inverted-U-shaped Kuznets curve was present in Italy and Denmark during this period, while this phenomenon was not observed in other countries. The difference in conclusions can be explained by the different lengths of the observation period. In the first study, the period covered was marked by various wars and technological breakthroughs, and such circumstances had an impact on the data. The second study covers a period of peace and therefore continuity of data was ensured. It is also important to note that the studies used a different method for estimating the functions.
Another attempt to identify the presence of an environmental Kuznets curve was conducted by [8] for 12 Asia-Pacific Economic Cooperation (APEC) forum member countries and 9 developed countries. They use variables reflecting economic activity, including tourism success as an explanatory variable, which is not often seen. This is because APEC economies recorded a 136% growth in tourist arrivals and a 116% growth in tourism receipts over the observation period from 1995 to 2020. In addition, emerging economies within APEC recorded a 401% growth in tourism receipts over the period. It is worth noting that APEC economies are responsible for more than 60% of global energy consumption and CO2 emissions. Using a double logarithmic function, it was found that a 1% increase in gross domestic product (GDP) per capita leads to a 4.3% increase in CO2 emissions in developing countries and a 5.5% increase in developed countries. The study showed that there is an inverted U-shaped environmental Kuznets curve in both developed and underdeveloped countries. On the other hand, [11] analysed 20 APEC economies over the period 1995 to 2017, came to the opposite conclusion, i.e. they did not confirm the presence of a Kuznets curve of this shape.
The study by [12] included 87 tropical countries with low, lower-middle and upper-middle incomes. The study examined the relationship between economic growth and carbon sequestration in these countries. Carbon sequestration is the ability to absorb CO2 from the atmosphere, while a reduction in carbon sequestration means increased pollution. Economic growth has been shown to have a negative impact on CO2 emissions in low- and lower-middle-income countries, while the reverse is true in upper-middle-income countries. This is due to higher industrial production in low-income countries.
Also [13] did an empirical analysis on a sample of 147 countries, over the period 1995 to 2018. The countries were divided into 4 income categories (low, lower middle, upper middle and high income). The study came up with results that suggest the presence of an environmental Kuznets curve. The impact of income growth in low-income countries grows and reaches its maximum in both categories of middle-income countries and finally its minimum in upper-income countries. The impact of trade on pollution is not entirely clear, and thus depends largely on the regulations of the countries. [14] carried out a similar analysis on a sample of 213 low-, middle- and high-income countries over the period 1970-2008. The conclusions of the study are similar, finding that there is a positive correlation between income growth and pressure on nature, with the impact being greatest in the middle-income countries. The reason for these results in the above-mentioned studies is the presence of industry and access to technology, i.e. in low-income countries there are not enough resources or a sufficiently educated workforce for the development of industry, while in middle-income countries the opposite is true and the conditions are suitable for the development of industrial production, and finally, high-income countries are focusing on service activities and relocating industry to lower-income countries.
Authors in [15] divided countries into different regions, namely the Europe and North Asia region, the Latin America and Caribbean region, and the Middle East, North Africa and Sub-Saharan Africa region. The study empirically analyses the impact of energy consumption and economic growth on carbon emissions for a group of 58 countries over the period 1990-2012. The findings show that per capita energy consumption has a positive impact on carbon emissions, pointing to the need for a shift towards renewable energy. The results also support the environmental Kuznets curve hypothesis, which shows an initial increase in carbon emissions with GDP growth, which subsequently decreases at higher income levels. Moreover, trade openness reduces carbon emissions in Europe and North Asia, while urbanisation has a negative impact on emissions worldwide. The support for the environmental Kuznets curve was also provided in the study of [16], who examined a sample of 11 low-income countries from 1991 to 2014. The main conclusion is that there is an inverted U-shaped environmental Kuznets curve, which means that although economic growth has a negative impact on nature, there is the potential for economic growth to contribute to a reduction in pollution in the future.
The analysis of [17] investigates the dynamic relationships between CO2 emissions, energy consumption, foreign direct investment (FDI) and economic growth in the BRIC countries (Brazil, Russia, India and China) from 1980 to 2007. There is a long-run equilibrium relationship between the variables, with CO2 emissions being elastic with respect to energy consumption and economic growth, but inelastic with respect to FDI. The results support the environmental Kuznets curve hypothesis. There are important causal links that point to the need for BRIC countries to balance economic growth with energy efficiency and environmental policies to manage the effects of FDI and reduce emissions. As it is known, FDI is designed to maximise profits without paying too much attention to externalities.
The study by [18] covered 2392 regions in China from 2000 to 2010. Sulfur dioxide (SO2) emissions and COD (a measure of water pollution) were chosen as pollution criteria. It turned out that SO2 emissions are mostly explained by economic development, followed by population density, but also by the development of heavy industry, due to the point of economic development at which China is located. Water pollution is primarily influenced by population density, followed by economic development, but also by the growth of tertiary industry, which, due to lax regulations, pollutes the environment through wastewater discharge.
An attempt to estimated the Kuznets curve considering urban population, energy usage and globalization indicators is covered by [19] and it is based on a sample of 180 countries for the period of 1980 to 2016. The study confirms the existence of the Kuznets curve and estimates positive effects of energy usage, urbanization on CO2 emission while globalization seems to ameliorate environmental degradations.
The examples reviewed show that taking the same sample does not guarantee the same results. Firstly, because of the methods used to estimate the functions and the explanatory variables used, and secondly because of the availability and reliability of the data, it is important to note that the time period chosen has a major impact on the robustness of the results. The preceding paper contributes to the existing empirical literature by applying a large sample of diverse countries scattered throughout the whole world, and providing an analysis of the impact of the level of country development on the link between economic growth per capita and pollution.
Data for the 112 selected countries were obtained from the World Bank database [20] for the period of 2002 to 2023. Due to the availability of data and the difficulty of measuring total pollution, the dependent variable had to be chosen as variable that would represent pollution in the most appropriate way, while at the same time being widely available and measurable. That is why carbon dioxide emissions (CO2) to the atmosphere were chosen, the unit of measurement being tonnes per capita [20]. Detailed description of CO2 measurement is given in Table 1.
Variables, abbreviations and units of measurement
Abbreviation |
Variable |
Measurement |
|---|---|---|
CO2 |
CO2 emissions per capita |
Total annual emissions of carbon dioxide (CO2), one of the six Kyoto greenhouse gases (GHG), from the agriculture, energy, waste, and industrial sectors, excluding land use change, land use and forestry, standardized to carbon dioxide equivalent values divided by the economy's population. In t CO2 eq. |
GDPPC |
Gross domestic product per capita |
Gross domestic product is the total income earned through the production of goods and services in an economic territory during an accounting period. Annual % growth. |
IND |
Industry |
It is comprised of mining, manufacturing, construction, electricity, water, and gas industries. Value added in % of GDP. |
URBAN |
Urban population |
Urban population refers to people living in urban areas as defined by national statistical offices. It is calculated using World Bank total population estimates and urban ratios from the United Nations World Urbanization Prospects. Annual % growth. |
ENERGY |
Energy intensity |
Energy use refers to use of primary energy before transformation to other end-use fuels, which is equal to indigenous production plus imports and stock changes, minus exports and fuels supplied to ships and aircraft engaged in international transport. In kg of oil equivalent per capita. |
RENEW |
Renewable energy |
Renewable energy consumption is the % share of renewable energy in total final energy consumption. |
TRADE |
International trade |
Trade is the sum of exports and imports of goods and services. In % of GDP. |
Source: Authors’ compilation based on [20]
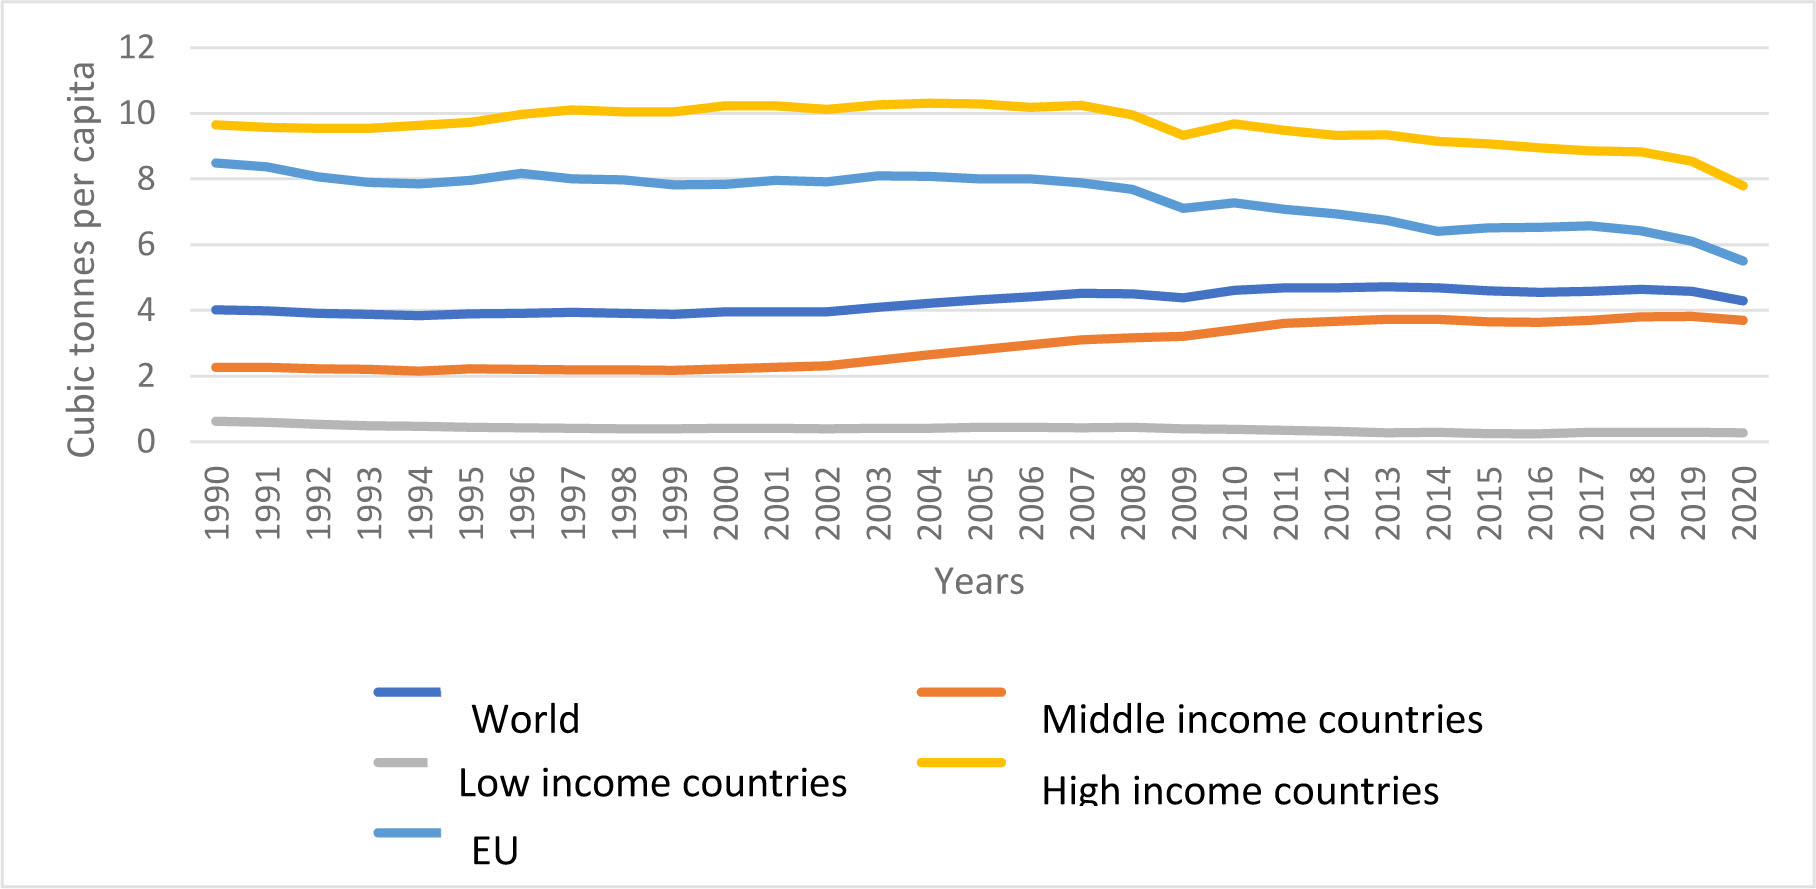
The characteristics of the dependent variable (CO2 emissions) by selected groups are presented in Figure 1. It shows the trend in CO2 emissions per capita (in cubic tonnes) for the world, the European Union and low-, middle- and high-income country groups over the period 1990 to 2020. It can be seen that there is a decreasing trend in emissions over the 30-year period observed, in all country groups except the middle-income countries. The same conclusion is reached for example by [10]. This is because middle-income countries are mostly in the process of industrialisation and economic growth. These processes are accompanied by urbanisation as well as increased energy consumption. Importantly for developing countries, their heavy reliance on fossil fuels increases CO2 emissions. In addition, economic growth increases the standard of living of the population, which has an impact on consumption and, consequently, on emissions. It is important to point out that in these countries, pollution regulation is often more permissive, which makes it difficult to achieve sustainable economic growth.
Trends in CO2 emissions per capita in selected groups of countries, 1990-2020 Source of data: [20]
The same set of explanatory variables were included in all panel models to enable to comparison among models. As the first explanatory variable, annual growth in gross domestic product per capita (GDPPC). The next explanatory variable is the annual value added of industry (IND), measured as a % of GDP. The growth of urban population (URBAN) in % was also. The explanatory variable labelled RENEW stands for renewable energy consumption and it is expressed as the share of renewable energy in total final energy consumption. Energy intensity (ENERGY) and international trade (TRADE) are also added as explanatory variables. The detailed characteristics of all variables included in the empirical analysis are exhibited in Table 1.
The variables were selected on the basis of theoretical background and a review of previous research in the field. For example, this study follows the idea of [15], who estimated the impact of energy use, urbanization and trade openness, while [19] considered energy, urbanization and globalization besides GDP per capita.
Originally, Simon Kuznets [21] hypothesised that inequality rises with economic growth up to a certain point and then starts to fall. The environmental Kuznets curve is named after him and his hypothesis, as the same logic applies to pollution, which initially increases with economic growth, but at a certain point in economic growth it should start to decrease. According to this theory, differently developed countries at different points in the economic cycle should have different outcomes, i.e. different impacts of economic activity on the environment [22]. In order to estimate the validity of the Kuznets hypothesis, a quadratic relationship among environmental pollution (measured by CO2 emissions) and GDP per capita growth was established. To confirm the Kuznets curve the estimated linear impact of GDP per capita growth (β2 in eq. (1)) should be positive, while the quadratic impact (β3 in eq. (1)) should reflect the negative relationship.
As for other estimated coefficients the expected signs are positive for industry (β4), urbanization (β5), energy intensity (β6) and trade (β8), while negative for renewable energy usage (β7).
Three panel models were estimated, the first one including the whole country set, the second for developed countries and the third for undeveloped countries. The countries were grouped to developed and undeveloped according to the size of the Human Development Index (HDI). The models were estimated using panel regression. Panel generalized method of moments method was applied in all three cases.
Panel data regression includes estimating fixed (FEM) and random (REM) effects model. Fixed effect model considers the heterogeneity among observed countries and allows the constant to vary for each country [23], represented by β1i in eq. (1):
Therefore, the error term (wit) consists of two components: wit = εi + uit, with εi as the country specific error term, while uit represents idiosyncratic term varying over countries and over time.
Since the random effects model can result in inconsistent estimates of the regression coefficients when the composite error term (wit) is correlated with the regressors, the Hausman test was applied to search for correlations between the cross-section-specific error component and the regressors. If the error term and regressors are correlated, the fixed effects model is appropriate [24]. As can be seen below, the fixed effects models are more appropriate in this study; that is why the robust standard errors of the coefficients [25] were estimated for the fixed effects model using the cross-section clustered White period approach and period clustered White cross-section approach [26]. Estimating the robust standard errors of estimated coefficients enables reliable conclusions resulting from t-statistics even in the presence of heteroscedasticity and/or autocorrelation.
The results of the model consisting of the whole sample of 112 countries worldwide are shown in Table 2. With 20 years included in the sample after adjustment, the panel consists of 2071 observations. Both, FEM and REM estimations confirm the statistical significance of all included explanatory variables and relatively high explanatory power of the models with 98.87% and 61.04% of variance of environmental pollution being explained by the models, respectively. However, the Hausman test with χ2 statistic of 44.7386 shows that among the two model estimations the FEM model is more appropriate. Enabling the robust conclusions from the estimation, the FEM model was re-estimated by White period and White cross-section approach. Considering the resulting robust standard errors of estimated coefficients in the last two columns in Table 2, the statistical significance of estimated regressions is lower but remains within at least 10% significance level. Only the effect of urbanization must be interpreted by caution since one of the robust standard errors results in insignificant coefficient. As for the estimated signs of the coefficients, they are in line with theoretical and empirical expectations. Moreover, the signs for GDP per capital coefficients confirm the environmental Kuznets curve.
The empirical results of CO2 emissions determinants for the whole country set
FEM |
REM |
FEM Robust se(bj) cross-section clustered) |
FEM Robust se(bj) period clustered |
|
|---|---|---|---|---|
C |
3.8314*** (0.1988) |
3.5957*** (0.3001) |
3.8314** (1.5039) |
3.8314*** (0.4202) |
GDPPC |
0.0126*** (0.0037) |
0.0115*** (0.0037) |
0.0126** (0.0051) |
0.0126* (0.0061) |
GDPPC2 |
-0.0003* (0.0002) |
-0.0003** (0.0002) |
-0.0003** (0.0001) |
-0.0003*** (7.68E-05) |
IND |
0.0375*** (0.0045 |
0.0374*** (0.0044) |
0.03748*** (0.0125) |
0.03748*** (0.0047) |
URBAN |
0.0489*** (0.0159) |
0.0459*** (0.0158) |
0.0489 (0.0333) |
0.0489** (0.0183) |
ENERGY |
0.0014*** (3.69E-05) |
0.0015*** (3.37E-05) |
0.00139*** (0.0004) |
0.00139*** (0.0001) |
RENEW |
-0.0735*** (0.0038) |
-0.0750*** (0.0036) |
-0.0735*** (0.0194) |
-0.0735*** (0.0031) |
TRADE |
-0.0087*** (0.0011) |
-0.0076*** (0.0011) |
-0.0087** (0.0041) |
-0.0087*** (0.0013) |
| R 2 | 0.988734 |
0.610413 |
0.988734 |
0.988734 |
Hausman χ2 (p-value) |
/ |
44.7386 (0.0000) |
/ |
/ |
Note: Standard errors of estimated regression coefficients in parenthesis.
*** denotes 1% statistical significance,
** denotes 5% statistical significance,
* denotes 10% statistical significance.
Source: Authors' calculations in EViews13
The model was divided to developed and undeveloped countries. There are 57 developed countries in the sample and after adjustment 19 time periods were included in the subsample, resulting in a panel of total 1065 observations. Both, FEM and REM estimations for developed countries (Table 3) provided highly statistically significant coefficients. The Hausman test with χ2 statistic of 35.5827 showed that the FEM model is more relevant. The last two columns in Table 3 demonstrate that the estimated results are robust to heteroscedasticity and autocorrelation, since all coefficients remains statistically significant within at least 10% statistical significance. Again, the effect of urbanization is ambiguous since one of the robust standard errors implies that the estimated coefficient is insignificantly different from zero. In the subsample of developed countries, the estimated signs of the coefficients are in line with theoretical and empirical expectations. The linear effect of GDP per capita is positive, while the quadratic effect is negative, which confirms the existence of the environmental Kuznets curve.
The empirical results of CO2 emissions determinants for developed countries
FEM |
REM |
FEM Robust se(bj) cross-section clustered) |
FEM Robust se(bj) period clustered |
|
|---|---|---|---|---|
C |
5.9479*** (0.3569) |
5.5780*** (0.4960) |
5.9479*** (1.8256) |
5.9479*** (0.4640) |
GDPPC |
0.0186** (0.0072) |
0.0158** (0.0071) |
0.0186** (0.0089) |
0.0186*** (0.0063) |
GDPPC2 |
-0.0023*** (0.0008) |
-0.0022*** (0.0008) |
-0.0023* (0.0012) |
-0.0023*** (0.0007) |
IND |
0.0632*** (0.0091) |
0.0668*** (0.0088) |
0.0632** (0.0259) |
0.0632*** (0.0122) |
URBAN |
0.0523** (0.0226) |
0.0474** (0.0225) |
0.0523 (0.0353) |
0.0523* (0.0282) |
ENERGY |
0.0012*** (4.58E-05) |
0.0013*** (4.28E-05) |
0.0012*** (0.0004) |
0.0012*** (0.0001) |
RENEW |
-0.1347*** (0.0072) |
-0.1374*** (0.0068) |
-0.1347*** (0.0314) |
-0.1347*** (0.0057) |
TRADE |
-0.0098*** (0.0018) |
-0.0085*** (0.0017) |
-0.0098* (0.0052) |
-0.0098*** (0.0018) |
R 2 |
0.987640 |
0.678531 |
0.987640 |
0.987640 |
Hausman χ2 (p-value) |
/ |
35.5827 (0.0000) |
/ |
/ |
Note: Standard errors of estimated regression coefficients in parenthesis.
*** denotes 1% statistical significance,
** denotes 5% statistical significance,
* denotes 10% statistical significance.
Source: Authors' calculations in EViews13
The empirical results of CO2 emissions determinants for undeveloped countries
FEM |
REM |
FEM Robust se(bj) cross-section clustered |
FEM Robust se(bj) period clustered |
|
|---|---|---|---|---|
C |
0.41301*** (0.1524) |
0.3853** (0.1588) |
0.41301 (0.7984) |
0.41301 (0.2429) |
GDPPC |
0.0055** (0.0024) |
0.0058** (0.0024) |
0.0055** (0.0021) |
0.0055* (0.0032) |
GDPPC2 |
-0.0003*** (9.28E-05) |
-0.0003*** (9.25E-05) |
-0.0003*** (0.0001) |
-0.0003*** (8.22E-05) |
IND |
0.0139*** (0.0030) |
0.0130*** (0.0028) |
0.0139 (0.0103) |
0.0139** (0.0046) |
URBAN |
0.0224 (0.0154) |
0.0225 (0.0150) |
0.0224 (0.0432) |
0.0224 (0.0183) |
ENERGY |
0.0022*** (6.78E-05) |
0.0023*** (5.91E-05) |
0.0022*** (0.0005) |
0.0022*** (0.0002) |
RENEW |
-0.0188*** (0.0026) |
-0.0210*** (0.0021) |
-0.0188*** (0.0057) |
-0.0188*** (0.0017) |
TRADE |
0.0011 (0.0009) |
0.0011 (0.0009) |
0.0011 (0.0013) |
0.0011 (0.0011) |
R2 |
0.980437 |
0.677856 |
0.980437 |
0.980437 |
Hausman χ2 (p-value) |
/ |
26.6817 (0.0004) |
/ |
/ |
Note: Standard errors of estimated regression coefficients in parenthesis.
*** denotes 1% statistical significance,
** denotes 5% statistical significance,
* denotes 10% statistical significance.
Source: Authors' calculations in EViews13
Table 4 exhibits results for the undeveloped countries subsample. There are 55 undeveloped countries observed over 20 time periods after adjustment resulting in 1006 total observations. Again, in this case the FEM model appeared to be the appropriate one regarding the Hausman test. The estimated coefficients are statistically significant for GDP per capita, industry, energy intensity and renewable energy usage, while urbanisation and trade are not statistically significantly affecting the pollution. While the statistical significance and signs for GDP per capita remain in favour of environmental Kuznets curve. Also other signs of estimated coefficients are of expected signs, except the effect of trade, which is estimated as positive in the case of undeveloped countries, which is statistically insignificant in all versions of the models in Table 4.
The exhibited results are in line with theoretical and empirical expectations, confirming the environmental Kuznets curve in all versions of the sample. The findings are comparable to [19] regarding the confirmation of the Kuznets curve and the list of other explanatory variables, such as urbanisation, energy usage and globalisation. The later variable can be related to explanatory variable trade in this study. On the other hand, these results are also similar to those in [15], confirming the Kuznets curve and estimating the positive effect of energy intensity, the negative effect of trade and ambiguous effect of urbanisation. However, this study differs from the existing empirical literature in estimating the effect of renewable energy usage and estimating the model(s) in the case of a large sample of 112 countries worldwide, taking into account subsamples regarding the development level according to HDI.
The growing awareness that the state of nature is deteriorating decade by decade, and the understanding that economic activity is one of the key factors influencing pollution, has led to the development of a whole theory on the impact of economic activity on nature. Due to the complexity of the analysis, a review of the existing literature was carried out to help us select the appropriate variables for our study, as well as to better understand the relationship between the economic activity and pollution. Kuznets led the way with his theory of the link between a country's level of development and pollution, arguing that the relationship can be expressed by an inverted-U shaped environmental curve. However, the conclusions of existing empirical studies are mixed, with some confirming the Kuznets' theory and others proving the opposite.
At the beginning of the research, three hypotheses were set. The first concerned the statistical significance of the selected variables used to specify the models. Based on the calculated regression coefficients and the corresponding t-statistics, it was found that the impact of GDP per capita, industrial production, the growth of urban population, energy intensity, the share of renewable energy consumption and international trade on pollution are statistically significantly different from zero in the estimated models for the whole sample and the subsample for developed countries. While the estimated effect of urbanization and international trade is not statistically significant in the subsample for undeveloped countries. Hence, the H1 can be confirmed for the whole sample and the subsample for developed countries, and partially confirmed for the subsample of undeveloped countries.
The second hypothesis claimed that there is relationship among GDP per capita and the environmental pollution in the shape of the environmental Kuznets curve. In order to test this shape of the curve, a quadratic function was estimated for all versions of the models. The estimated coefficients for GDP per capita and for squared GDP per capita are statistically significant and of correct signs in all three models. Hence, the H2 can be confirmed for the whole sample as well as for both subsamples.
The third hypothesis was that there is a difference in the impact of economic factors on pollution in developed and undeveloped countries. The empirical results of this study imply that there is lower effect of GDP per capita to increasing pollution in the undeveloped countries, while the decreasing part of the Kuznets curve is flatter in the undeveloped countries, which means that the negative effect of GDP per capita after the threshold value is less pronounced. The decreasing part of the Kuznets curve is associated to cleaner, greener industrial technology, which is obviously more applied in the developed countries enabling them to exhibit larger negative affect of economic activity on pollution once the transition from heavy to innovative (green) industry takes place. This can be also explained by the higher coefficient for energy intensity in the undeveloped countries compared to the sample of developed countries. Regarding the renewable energy usage on the other hand, the results show that its effect is larger in the developed countries. This is again explaining that the e so-called composition and technique effect [1] in the decreasing part of the environmental Kuznets curve is less pronounced in undeveloped countries. Hence, also the third hypothesis can be confirmed.
The existence of the environmental Kuznets curve can be explained by several factors, the first of which are innovation and technological development and the increasing availability of technology at a global level. This is followed by international agreements and regulations that have influenced a change in the way production is carried out. In addition, there has been a shift from traditional industry to green industry and increasing growth of services sectors.
The policy implications of these results include the endeavour for decreasing the energy intensity of the industrial sector in developed and undeveloped countries, and for increasing the renewable energy sources in both groups of countries. The proposed initiatives are expected to have a greater impact on decreasing pollution in undeveloped countries.
This study is limited to the estimation of pollution determinants in the period from 2002 to 2023 by application of panel data. Thus, future research can go in two directions: (1) to estimate the panel models on a broader sample of countries and more subsamples for several development levels and (2) to estimate the models with other methods, such as PVar and within ARLD and NARLD approaches in order to model the long run and short run asymmetry among different levels of economic development and their impact on pollution.
- ,
The Environmental Kuznets Curve (EKC) theory – Part A: Concept, causes and the CO2 emissions case ,Energy Policy , Vol. 62 , :1392-14022013, https://doi.org/10.1016/j.enpol.2013.07.131 - ,
The evolution of environmental Kuznets curve hypothesis assessment: A literature review under critical analysis perspective ,Heliyon , Vol. 8 (11), :e115212022, https://doi.org/10.1016/j.heliyon.2022.e11521 - ,
CO₂ emissions, economic growth, energy consumption, trade and urbanization in new EU member and candidate countries: A panel data analysis ,Economic Modelling , Vol. 44 , :97-1032015, https://doi.org/10.1016/j.econmod.2014.10.022. - ,
Literature survey on the relationships between energy, environment and economic growth ,Renewable and Sustainable Energy Reviews , Vol. 69 , :1129-11462017, https://doi.org/10.1016/j.rser.2016.09.113. - , The Paris Agreement, 2018
- ,
From millennium development goals to sustainable development goals ,The Lancet , Vol. 379 (9832), :2206-22112012, https://doi.org/10.1016/S0140-6736(12)60685-0 - ,
The Spectrum of Implications of Decarbonization on Sustainable Development ,Journal of Sustainable Development Indicators , Vol. 1 (2), :1-162025, https://doi.org/10.13044/j.sdi.d2.0590. - ,
Economic growth and environmental quality: An econometric and a decomposition analysis ,Management of Environmental Quality , Vol. 18 (5), :568-5772007, https://doi.org/10.1108/14777830710778328. - ,
On the relationship between energy consumption, CO2 emissions and economic growth in Europe ,Energy , Vol. 35 (12), :5412-54202010, https://doi.org/10.1016/j.energy.2010.07.009. - ,
Tourism, economic growth, and environmental pollution in APEC economies, 1995–2020: An econometric analysis of the Kuznets hypothesis ,Economies , Vol. 11 (10), :2642023, https://doi.org/10.3390/economies11100264. - ,
Examining the relationship between tourism and CO2 emissions: evidence from APEC region ,Anatolia , Vol. 34 (3), :306-3202022, https://doi.org/10.1080/13032917.2021.2021430. - ,
Effect of economic growth on environmental quality: Evidence from tropical countries with different income levels ,Sci of The Total Environ , Vol. 774 , :1451802021, https://doi.org/10.1016/j.scitotenv.2021.145180 - ,
Reinvestigating the environmental Kuznets curve (EKC) of carbon emissions and ecological footprint in 147 countries: A matter of trade protectionism ,Humanities and Social Sciences Communications , Vol. 11 (160), 2024, https://doi.org/10.1057/s41599-024-02639-9 - ,
Economic growth and its impact on environment: A panel data analysis ,Ecological Indicators , Vol. 24 , :324-3332013, https://doi.org/10.1016/j.ecolind.2012.06.019. - ,
An econometric study of the impact of economic growth and energy use on carbon emissions: Panel data evidence from fifty-eight countries ,Renewable and Sustainable Energy Reviews , Vol. 59 , :1101-11102016, https://doi.org/10.1016/j.rser.2016.01.054. - ,
Does economic growth reduce pollution? Empirical evidence from low income countries ,E3S Web of Conferences , Vol. 125 (06002), 2019, https://doi.org/10.1051/e3sconf/201912506002. - ,
Multivariate Granger causality between CO₂ emissions, energy consumption, FDI (foreign direct investment) and GDP (gross domestic product): Evidence from a panel of BRIC (Brazil, Russian Federation, India, and China) countries ,Energy , Vol. 36 (1), :685-6932011, https://doi.org/10.1016/j.energy.2010.09.041. - ,
Economic growth and pollutant emissions in China: A spatial econometric analysis ,Stoch Environ Res Risk Assess , Vol. 28 (2), :429-4422014, https://doi.org/10.1007/s00477-013-0762-6 - ,
Globalization and CO2 emissions in the presence of EKC: A global panel data analysis. ,Gondwana Research , Vol. 106 , :367-3782022, https://doi.org/10.1016/j.gr.2022.02.002. - ,
- ,
Economic Growth and Income Inequality ,The American Economic Review , Vol. 5 (1), :1-281955 - ,
Environmental Kuznets curve ,Encyclopedia of energy , Vol. 2 , :517-5252004, https://doi.org/10.1016/B0-12-176480-X/00454-X. - , , Econometric Analysis of Cross Section and Panel Data, 2002
- , , Econometrics by Example, 2015
- ,
Computing Robust Standard Errors for With-In Groups Estimation ,Oxford Bulletin of Economics and Statistics , Vol. 49 (4), :431-4341987, https://doi.org/10.1111/j.1468-0084.1987.mp49004006.x - ,
A Heteroskedasticity-Consistent Covariance Matrix and a Direct Test for Heteroskedasticity ,Econometrica. , Vol. 48 (4), :817-8381980, https://doi.org/10.2307/1912934.