

The integration of photovoltaic (PV) systems into public buildings has gained increasing attention as a strategy to decarbonize urban energy systems and enhance the sustainability of the built environment.
The European Union’s regulatory framework strongly promotes the integration of solar energy technologies in the building sector, with particular emphasis on the public sector. The revised Energy efficiency Directive (EED) and Renewable energy Directive (RED) set binding obligations for Member States to improve energy performance and accelerate renewable energy deployment in buildings. The EED mandates that the public sector lead by example, requiring annual renovation of at least 3% of the total floor area of public buildings to nearly zero-energy or zero-emission standards [1]. As part of this process, the integration of renewable energy systems, including PV modules, is explicitly encouraged to reduce fossil energy consumption.
In parallel, the RED requires Member States to increase the share of renewables in final energy consumption in buildings to at least 49% by 2030 [2]. The directive highlights that new buildings, especially public ones, should incorporate on-site renewable energy generation where technically and economically feasible. This includes the systematic consideration of rooftop PV installations in the planning, construction, and renovation processes of public buildings. Additionally, Member States are instructed to simplify administrative procedures and remove regulatory barriers to solar deployment, especially for self-consumption models. As such, public buildings are positioned as key instruments for the implementation of both directives, serving as early adopters of integrated solar energy solutions and as models for broader societal uptake.
Solar installation on public buildings offers several advantages: large rooftop areas, predictable demand patterns, and eligibility for targeted policy incentives. Although residential and commercial solar adoption is well studied, the specific dynamics of public infrastructure solarization remain less extensively explored.
At the fundamental level, spatial suitability assessment forms the technical basis for rooftop PV planning. Geographical Information System (GIS) and three-dimensional (3D) modelling approaches have been widely employed to evaluate rooftop solar potential with respect to orientation, slope, shadowing, and available installation surface. For example, in [3] authors utilized LiDAR data and GIS tools to estimate generation potential and identify viable rooftop areas in Lethbridge (Canada). They find out that in Lethbridge, approximately 301 GWh annual potential was identified, with around 96% of rooftops deemed economically feasible under current market conditions. Similarly, in [4] Yu et al. combined global-scale 3D building with diverse datasets to estimate potential from building integrated PVs. Within the 120 analysed areas, study reveals that the total solar radiation received by facades is highly competitive with that received by rooftops, showcasing an average facade-to-rooftop ratio of 100.7%. Moreover, 35.9% of the facades receive even more total radiation than rooftops, despite the generally lower conversion efficiency of facade PV systems compared with rooftop installations, simulation results indicate that the average ratio of facade PV potential to rooftop PV potential remains approximately 68.2%.
Energy calculation studies examine the output of PV systems based on insolation, panel performance, and local climatic conditions. Reviews of building-integrated PV technologies highlight the importance of parameter variation analysis in system performance, including module temperature effects, daylight integration, and efficiency trade-offs between opaque and semi-transparent systems [5].
Economic assessment has been addressed in multiple contexts. Life-cycle cost analysis and cost–benefit frameworks often incorporate environmental and societal co-benefits. Case studies of building-integrated PVs in diverse climates (Brazil, Italy, China and Bahrain) show that when societal and environmental benefits are included, economic feasibility improves significantly [6]. Studies of municipal buildings in Germany emphasize that load profile alignment and existing electricity tariffs influence profitability and that additional battery storage may not be cost-effective for municipal properties [7]. In [8] authors used machine learning-based forecasting to analyse power consumption and solar generation patterns in public community buildings to assess economic viability and environmental benefits of integrating PV systems. They showed that the integration of solar PV systems could lead to a reduction of 1.02 million tons of CO2 emissions annually and a 48% decrease in net present cost. These findings highlight the potential of solar PV to mitigate environmental harm while offering financial benefits in alignment with Saudi Arabia’s renewable energy objectives.
More comprehensive frameworks have emerged that integrate spatial layout optimization, power dispatch and grid interaction. A Chinese study using trans-regional power dispatch simulation demonstrated that spatial optimization could reduce PV curtailment by approximately 7%, thereby improving overall system utilization [9]. Other techno-economic assessments emphasize that spatial diversity and regional balance are critical to reducing variability and achieving higher alignment with grid demand patterns [9].
Existing literature demonstrates progress in discrete areas, spatial potential mapping, energy yield simulation, and economic evaluation of PVs, but relatively few studies successfully integrate all three domains simultaneously in the context of public buildings. Despite the rich body of work on rooftop PV potential and economic modelling, a clear gap exists at the intersection of spatial, energy and economic analysis specifically targeting solarization of public buildings. Key limitations include:
Sector-specific modelling deficiency: Most existing studies generalize beyond residential or commercial buildings. Public buildings, which often benefit from distinct financing conditions and demand profiles, are underrepresented in combined analytic frameworks.
Lack of integrated methodology: While spatial assessments estimate technical potential and economic analysis evaluates profitability, few studies systematically link spatial outputs (e.g., suitable rooftop area) via energy yield estimation into a unified economic feasibility model.
Limited sensitivity to local policy and incentive structures: Many analyses assume general market tariffs and generic incentive regimes, but the actual outcomes in public sector settings depend heavily on available feed-in tariffs, net-metering regulations, capital subsidies, and institutional capacity [10].
Grid interaction and variability considerations: Though spatial layout impacts grid integration, most economic assessments for public buildings ignore variability in generation, curtailment, and local network constraints.
To date, no comprehensive framework has been developed that links geospatial evaluation of rooftop availability, estimation of energy output under local climatic conditions, and detailed economic analysis using cash flow modelling, including value metrics such as Levelized cost of Energy (LCOE), Net present value (NPV), and Internal rate of Return (IRR), for public building portfolios.
This study addresses this gap by proposing and applying a unified methodological framework combining:
Spatial mapping of rooftop PV suitability using GIS and building footprint databases.
Simulation of solar electricity yield using local irradiation datasets and performance models.
Economic analysis based on dynamic cash flow modelling, calculating LCOE, NPV, and IRR, incorporating institutional financing conditions and incentive schemes.
The research contributes to both academic knowledge and policy practice by providing a replicable model tailored to public building solarization, supporting decision-makers in urban energy planning and public sector investment strategies.
In this section overview of the method used in the paper is presented. Figure 1 illustrates the methodological approach applied in the research to assess the economic performance of PV systems integration in public sector buildings. The methodology is structured around three primary components: spatial analysis, energy analysis, and empirical data collection. These core elements are integrated with other economic input parameters and collectively serve as inputs into the economic analysis, which is based on dynamic financial modelling using the cash flow method.
Method overview
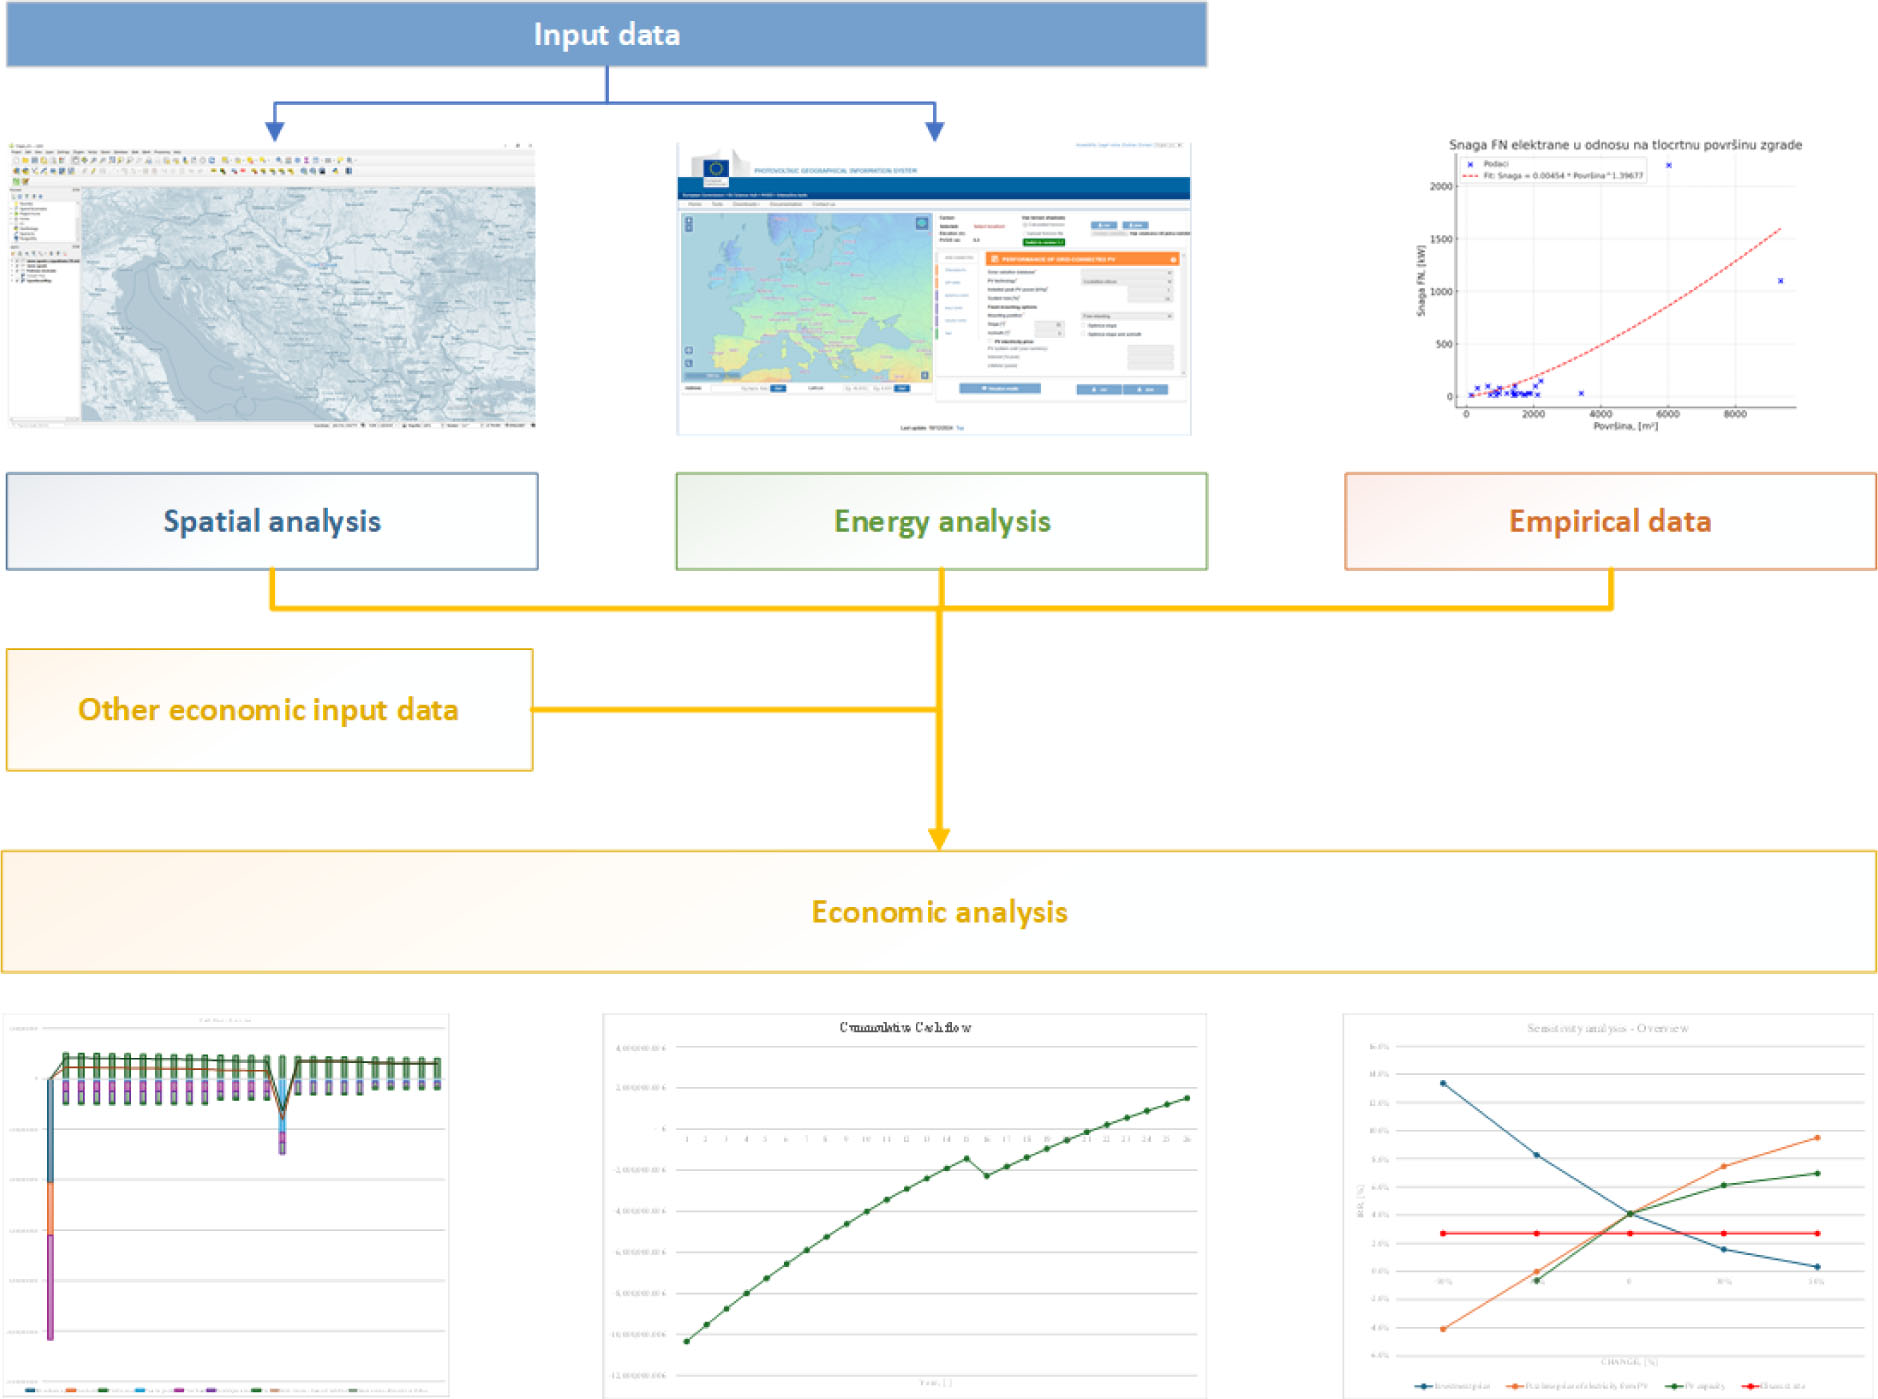
The spatial analysis is conducted using GIS tools to identify and evaluate the physical and geographical suitability of building rooftops for solar energy systems. This step involves the assessment of rooftop areas, orientation, inclination, and potential shading, with the objective of determining the technical feasibility of PV system installation. Spatial data is essential for estimating the potential installation capacity across the public building stock.
The energy analysis involves estimating the potential electricity production of solar energy systems under local climatic and irradiation conditions. This component uses standardized tools ‒ PVGIS and datasets to simulate expected energy yields over the system’s operational lifetime. The outcome of the energy analysis provides the technical foundation for evaluating system performance, which directly influences the economic indicators calculated in the subsequent stage.
The empirical data component involves the collection and statistical processing of measured or observed data, such as installed PV capacities concerning rooftop surface area, historical performance data of existing systems, and other practical implementation records. This data improves the reliability and accuracy of model assumptions by grounding them in real-world performance.
These three analytical components are integrated with other economic input data, including investment costs, operation and maintenance expenses, electricity prices, financing conditions, and policy-related factors. The combination of technical outputs and economic variables feeds into the economic analysis, which is the final stage of the methodological framework.
The economic analysis employs the cash flow method, tracking financial inflows and outflows over the project lifetime. Key performance indicators derived from this analysis include the LCOE, NPV, and IRR. LCOE provides a measure of the average cost per unit of electricity generated over the lifetime of the system, enabling comparison with market electricity prices. NPV reflects the difference between the present value of cash inflows and outflows, indicating overall project profitability. IRR represents the discount rate at which the NPV becomes zero, serving as a benchmark for assessing investment attractiveness.
In the bottom section of the figure, graphical outputs of the economic analysis are presented, including a yearly cash flow diagram, a cumulative cash flow profile, and a sensitivity analysis. The yearly cash flow diagram shows annual income and expenses, highlighting the payback period. The cumulative cash flow chart visualizes the accumulation of financial returns over time, showing when the investment becomes profitable. The sensitivity analysis illustrates the influence of key parameters, such as investment cost, electricity price, and system capacity, on the internal rate of return, revealing the robustness and vulnerability of the project under different scenarios.
This framework ensures a holistic and data-driven evaluation of the economic viability of solar energy deployment in public buildings, combining geospatial, technical, empirical, and financial dimensions in a structured and replicable process.
Spatial analysis was conducted using QGIS, an open-source GIS that supports data processing, visualization, and spatial interpretation. The primary objective of the analysis was to map all public buildings within the selected urban area and calculate the available rooftop surface area for potential PV system installation. Additionally, buildings with already installed PV systems were identified and mapped to support later stages of the energy and economic analysis.
To obtain spatial data on building locations, the QuickOSM plugin within QGIS was utilized. This tool enables data retrieval from the OpenStreetMap database using key-value queries. The initial extraction included all buildings within the city of Osijek by querying the key "building".
Following the extraction, attribute-based filtering was applied to isolate public buildings. Non-public structures were removed from the dataset based on their attribute values. The remaining public buildings were further categorized into the following functional types:
Administrative and governmental.
Educational.
Sports and recreational.
Healthcare facilities.
In cases where buildings were not initially classified into one of the predefined categories, manual classification was performed, and their building footprints were updated accordingly.
The next step involved calculating the ground-level (footprint) area of each building using the QGIS "Field Calculator" tool. This calculation provided the geometrical basis for estimating the potential PV installation area.
To establish a reference for dimensioning PV systems, a separate GIS layer was created containing public buildings with existing PV installations. These buildings were georeferenced, and both their rooftop area and the installed PV capacity were recorded. This dataset was exported in CSV format and used to derive a power-to-area relationship based on regression analysis.
The resulting formula, representing the installed PV capacity as a function of available rooftop area, was then applied to the remaining public buildings without existing PV systems. Using the "Field Calculator", the potential installed capacity of PV systems was estimated by multiplying each building’s footprint area by the derived coefficient.
It is important to note that certain buildings from the reference layer with existing or planned PV systems overlapped with buildings from the main public building layer. These duplicates were removed from the dataset to avoid overestimation and ensure consistency in further analyses.
The energy analysis represents a fundamental step in assessing the feasibility and planning of PV systems on public buildings. Its main objective is to estimate the potential installed capacity of PV systems and the corresponding annual electricity generation for a mapped portfolio of public buildings. This information serves as the basis for subsequent economic and financial analyses.
In this study, the PV Geographical Information System (PVGIS) was used as the primary analytical tool. PVGIS is an open access geoinformatics platform developed by the Joint Research Centre (JRC) of the European Commission. It enables users to calculate solar radiation and estimate the expected electricity output of PV systems based on several parameters, including geographical location, panel tilt, azimuth angle, and system losses. PVGIS supports different system configurations, including grid-connected systems, off-grid installations, and systems equipped with solar tracking mechanisms. Output results are available on yearly, monthly, daily, and hourly timescales.
For this analysis, PVGIS was used to calculate the annual electricity production per kilowatt (kW) of installed capacity under standardized conditions. The assumptions applied in the PVGIS simulations were as follows:
All PV systems are assumed to be connected to the grid.
PV panels are mounted at the optimal tilt and orientation for the given location.
Total system losses are assumed to be 14%.
To determine the potential capacity of PV systems that could be installed on public buildings, a correlation was established between the roof area and the installed PV system capacity using data from buildings where PV systems have already been implemented. A total of 25 public buildings with existing PV installations were identified, and their rooftop surface areas were calculated using GIS-based spatial analysis. For each building, the installed capacity of the PV system was documented.
Correlation between existing PV system capacity and roof area
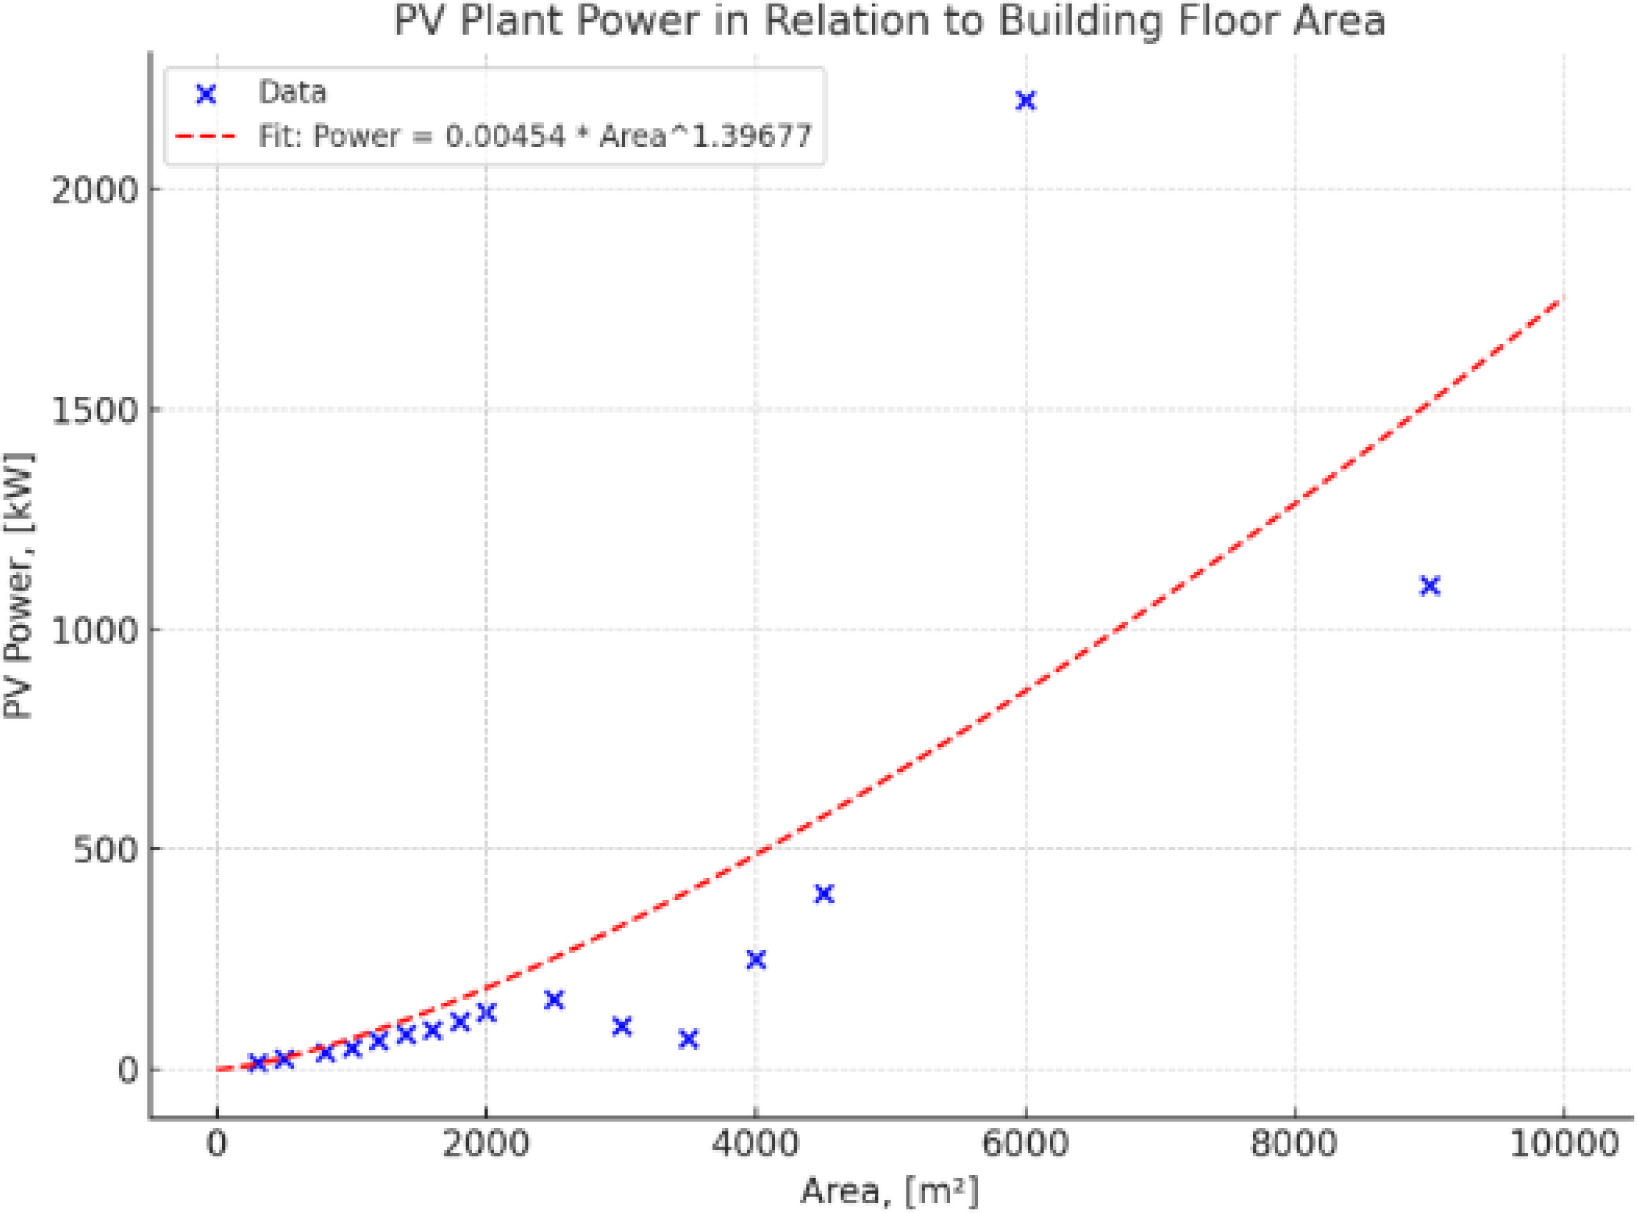
By analysing the relationship between the building footprint, , (used here as a proxy for usable roof area) and the installed PV capacity, an empirical correlation was derived. The relationship was found to be best described by a power function PPV, resulting in the following equation:
This equation (eq. (1)) provides a scalable method for estimating the potential installed capacity of PV systems on other public buildings that have not yet been equipped with solar technology. It accounts for the nonlinear relationship observed between available roof area and installed capacity, likely due to differences in architectural constraints, panel arrangement efficiencies, and usable roof proportions.
Using the above formula, the theoretical PV capacity for each additional building was calculated. Subsequently, the annual electricity generation potential for each site was estimated by multiplying the calculated PV capacity by the specific annual production yield derived from PVGIS (1,210 kWh/kW/a).
In the work, PV system production decrease is assumed based on research presented in [11]. It is assumed that production will decrease by 0.5% during the year due to material degradation, environmental conditions, and manufacturing quality.
The annual electricity generation serves as the key output of the energy analysis and provides a quantifiable basis for evaluating both the energy benefits and the financial returns of potential PV investments in the public building sector. The derived energy production values are directly used as input for the economic assessment, where they represent the projected annual income based on self-consumption or grid feed-in mechanisms, depending on the system configuration.
The energy analysis combines empirical data, spatial mapping, and simulation-based modelling to systematically evaluate the solar potential of public building infrastructure. This methodology ensures a reproducible and data-driven estimation process that supports informed decision-making in the context of public sector energy transition planning.
The economic analysis of PV system implementation serves as a critical component in evaluating the financial viability and long-term sustainability of solar investments. The methodology applied in this study is based on two complementary approaches: the calculation of the LCOE and the cash flow method, which enables the assessment of financial performance indicators such as the NPV and IRR.
LCOE is a standardized metric used to evaluate the cost-effectiveness of energy-generating technologies. It represents the average cost of producing one unit of electricity over the lifetime of a power plant and is particularly useful for comparing different generation technologies consistently. LCOE is calculated as the ratio of the total discounted costs (investment and operation) to the total electricity generated over the lifetime of the system:
where:
represents the capital expenditures [EUR].
refers to the operational and maintenance costs over the system’s lifetime [EUR].
Eproduced is the total electricity generated over the project lifetime [MWh].
The capital expenditure (CAPEX) is calculated using the Capital Recovery Factor (CRF), which accounts for the time value of money:
where:
CRF is the capital recovery factor.
INV is the initial investment cost [EUR].
d is the discount rate [%].
n is the economic lifetime of the PV system [years].
Fuel costs are excluded from the LCOE formula in this analysis, as PV systems do not incur fuel-related expenses. The resulting LCOE serves as a benchmark for evaluating the cost-efficiency of the PV systems and is used to compare the generated electricity costs with existing market tariffs.
To complement the LCOE evaluation and capture the dynamic aspects of project financing and returns, a detailed cash flow analysis was conducted. This approach considers the annual inflows and outflows of funds throughout the operational life of the PV systems, enabling the calculation of key financial indicators, including the NPV, IRR, and Payback Period.
The primary revenue stream is the sale of electricity generated by the PV systems. The selling price of electricity is assumed to be a fixed proportion of the retail electricity price. A single-tariff pricing model is considered, reflecting the standard utility purchase scheme for grid-connected systems in Croatia, and is justified by the daytime-only generation profile of PV systems.
On the expenditure side, operational costs include annual maintenance expenses and the cost of electricity purchased from the grid. Despite the assumption that PV systems may be capable of covering annual consumption on a net basis, the analysis conservatively assumes that public buildings will continue to purchase electricity during low-production periods, particularly in winter months.
To reflect real-world financing conditions, it is assumed that 40% of the total investment is subsidized by the local government, while the remaining 60% is financed through debt. Depreciation is applied linearly over the expected operational life of PV modules and inverters.
NPV is calculated by discounting all future net cash flows (i.e., revenues minus costs) to their present value using the specified discount rate. NPV is expressed as:
where:
Rtis the net cash flow in year t [EUR].
d is the discount rate [%].
t is the year of cash flow occurrence.
n is the project lifetime [years].
NPV serves as a measure of the project's financial attractiveness:
If NPV > 0, the investment is considered profitable.
If NPV < 0, the investment is not financially viable.
If NPV = 0, the investment breaks even.
The Internal Rate of Return is defined as the discount rate at which the NPV of all future cash flows equals zero:
IRR represents the effective annual rate of return generated by the project:
If IRR > Cost of Capital, the project is financially viable.
If IRR < Cost of Capital, the investment is not justified.
If IRR = Cost of Capital, the investment is marginally acceptable.
Lastly, the Payback Period is calculated to determine the time required for the project to recover the initial investment through net positive cash flows. Two approaches are commonly used:
The simple payback period does not account for the time value of money.
The discounted payback period, which considers discounted cash flows using the discount rate.
Although the payback period offers insights into project liquidity and risk, it is not a sufficient standalone metric for investment decisions. Therefore, it is used in conjunction with NPV and IRR to provide a comprehensive evaluation of project performance.
City of Osijek is in eastern Croatia, the centar of Osijek-Baranja County and the largest city in Slavonia. It is the fourth largest city in Croatia, and its area is 171 km2. According to the 2021 census, the city of Osijek currently has a population of 75,916. Osijek has a continental climate, meaning that summers are warm and dry with relatively little precipitation, while winters are cold and harsh.
Case study area – City of Osijek
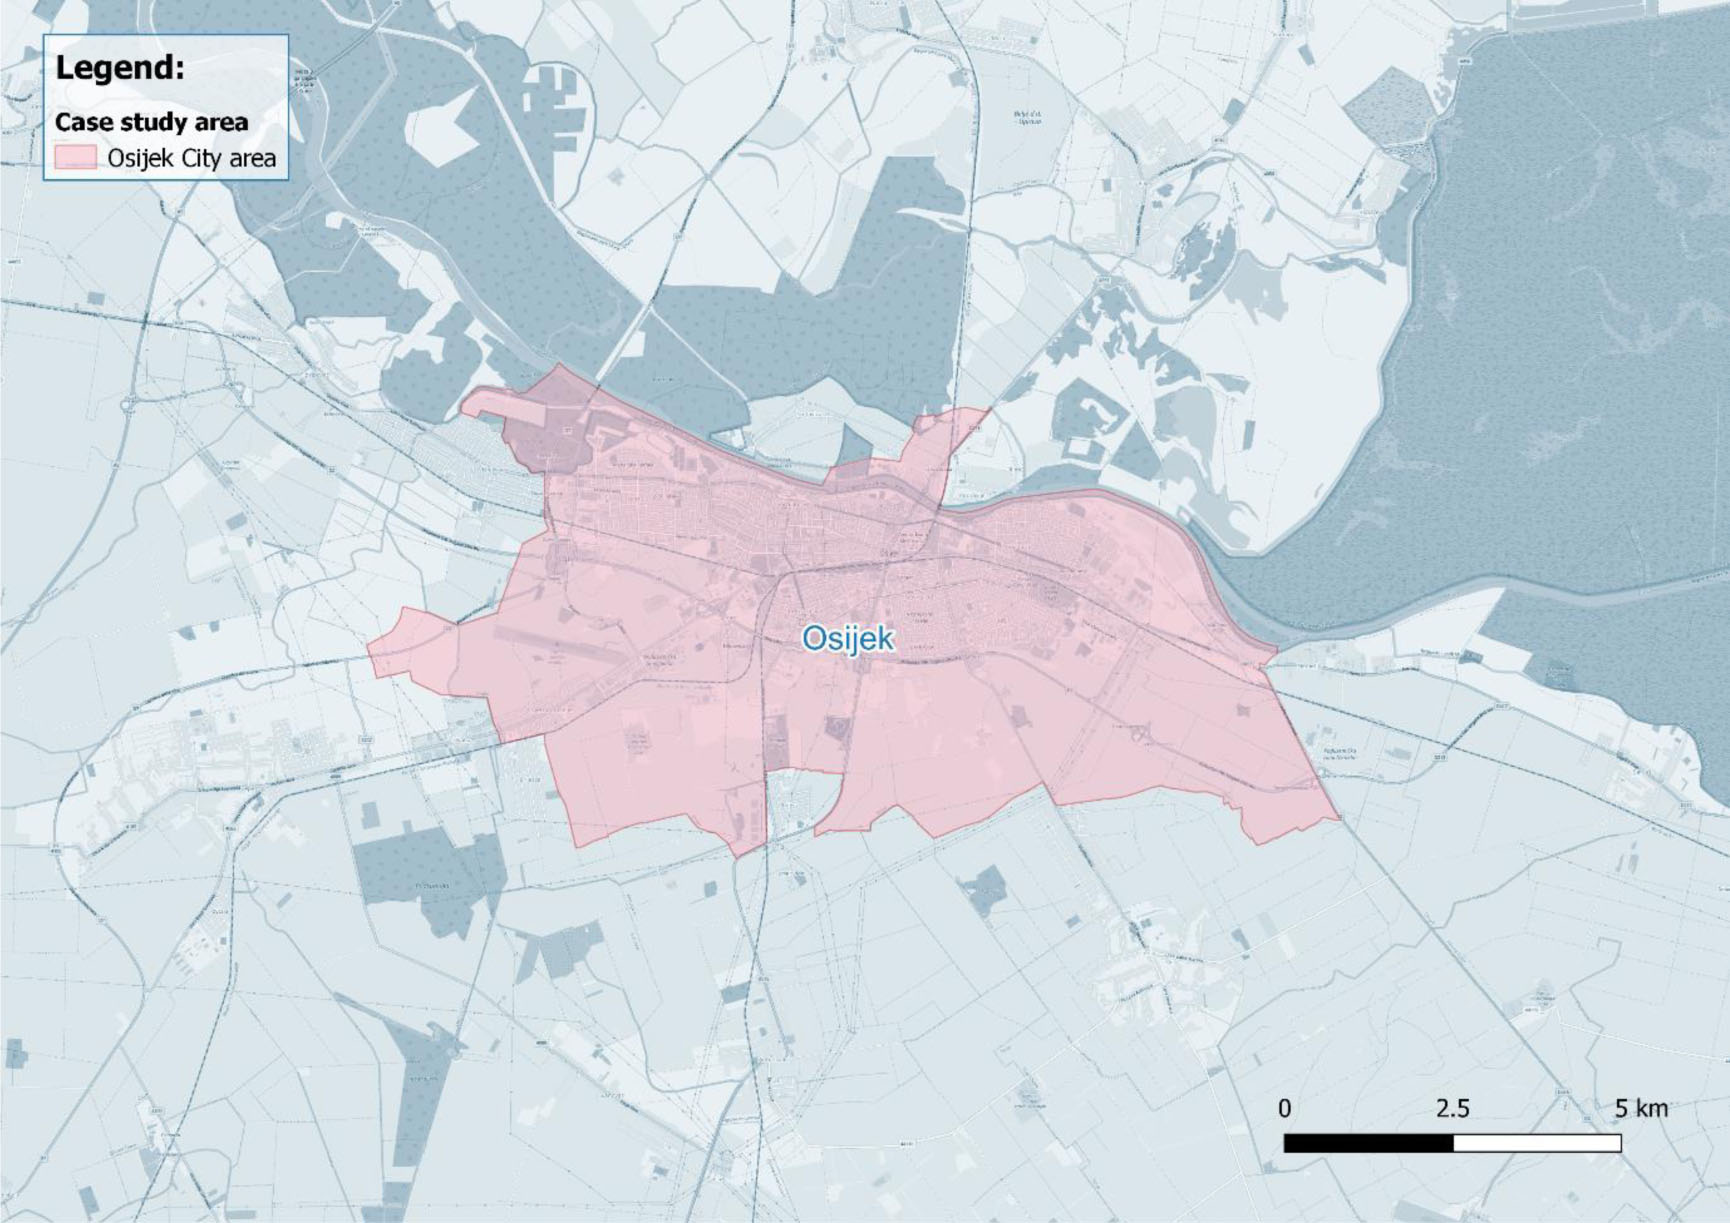
In Osijek, there are 109 public buildings with a total electricity consumption of 5,942.535 MWh/a [12]. Since the project duration is 25 years, electricity consumption will certainly change significantly during that period due to a combination of the implementation of energy efficiency measures (which should contribute to reducing consumption) and the electrification of heating, cooling, and the introduction of electric car chargers (which should further increase electricity consumption). Since it is not certain what the pattern of consumption will be, in this research, electricity consumption is kept constant throughout the project period.
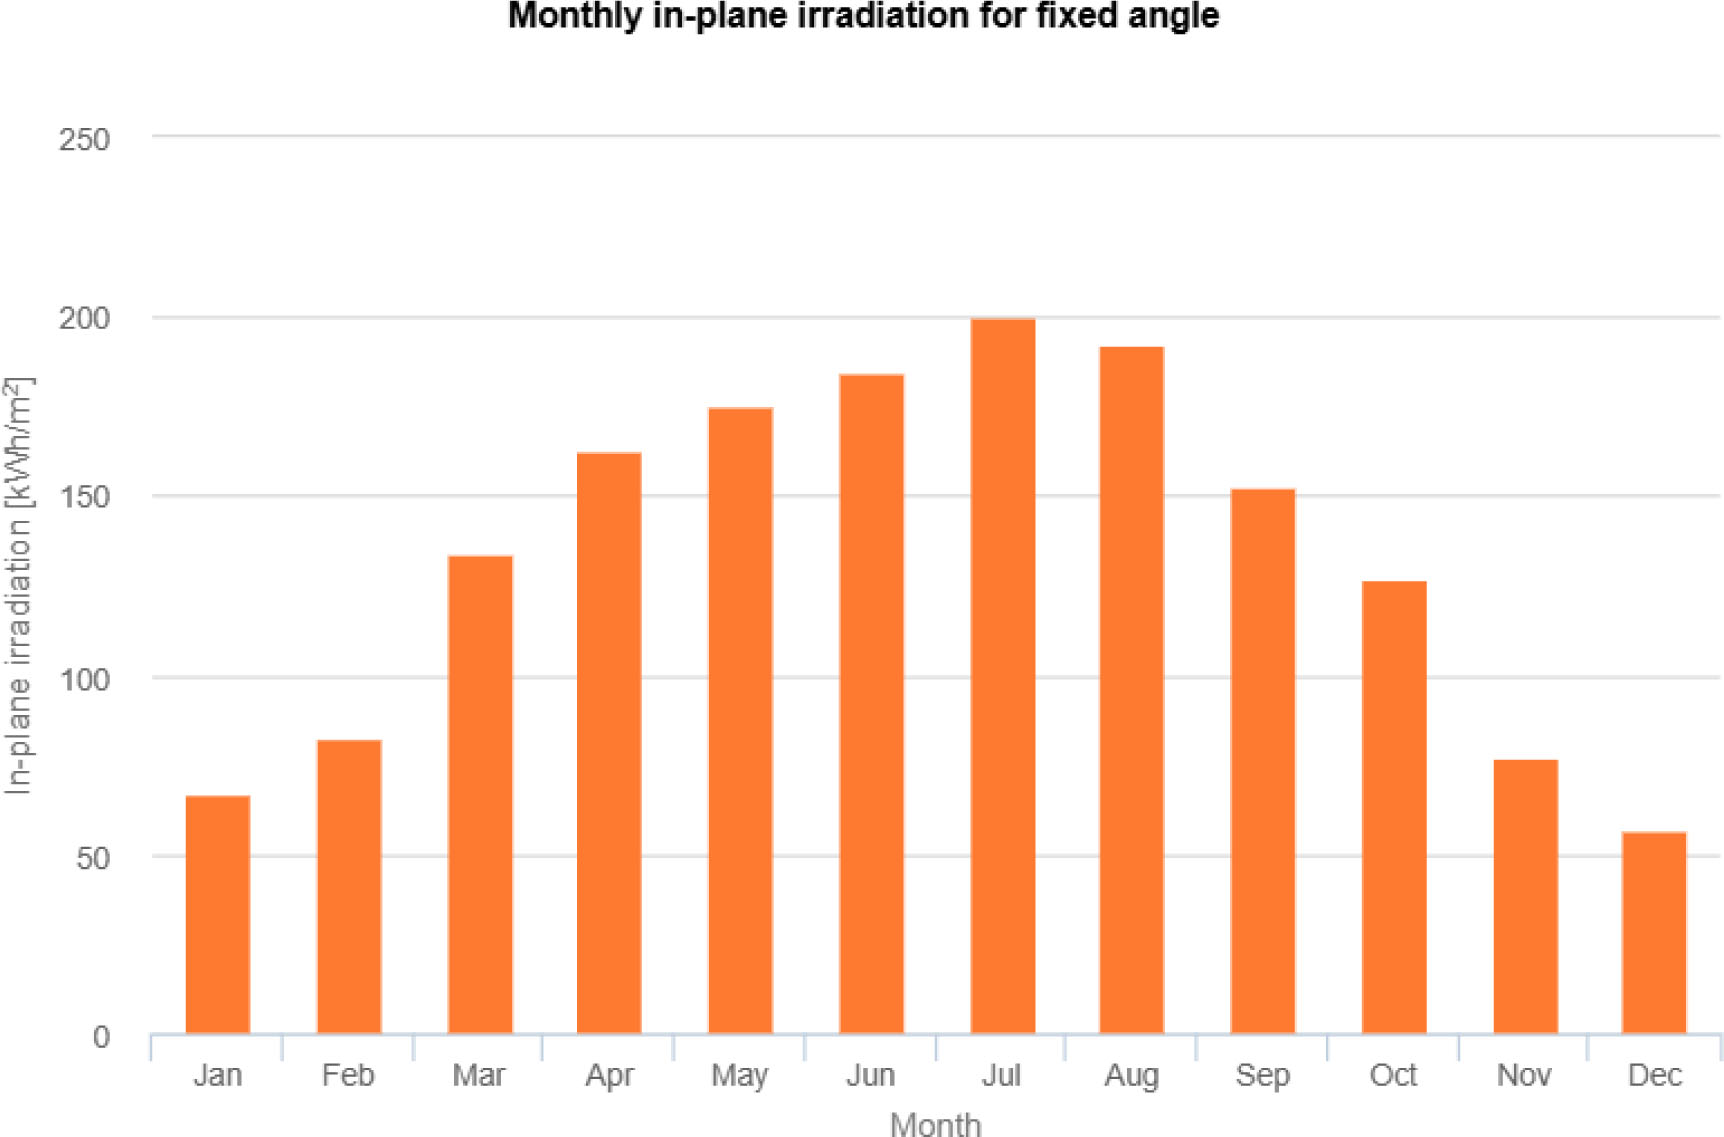
The annual production per 1 kW of installed capacity of PV systems is 1,210.25 kWh [13], This value is subsequently used to estimate the electricity production potential of all analysed public buildings. The monthly in-plane irradiation for fixed-angle PV systems installed on the roof can be seen in Figure 4. The largest part of the irradiation will be during the summer months, i.e., July and August. The maximum irradiation is achieved in July. The least irradiation is coming in the winter months, i.e., December and January. Other input data from PVGIS is shown in Table 1.
Monthly in-plane irradiation for fixed angle - City of Osijek [13]
Input data from PVGIS [13]
Location, [Lat/Lon] |
45.555,18.695 |
Database used |
PVGIS-SARAH3 |
PV technology |
Crystalline silicon |
PV installed, [kW] |
1 |
System loss, [%] |
14 |
Optimal Slope angle, [°] |
37 |
Optimal Azimuth angle, [°] |
-1 |
Yearly PV energy production, [kWh] |
1210.25 |
Yearly in-plane irradiation, [kWh/m2] |
1612.19 |
Year-to-year variability, [kWh] |
51.76 |
Angle of incidence, [%] |
-2.78 |
Spectral effects, [%] |
1.25 |
Temperature and low irradiance, [%] |
-11.32 |
Total loss, [%] |
-24.93 |
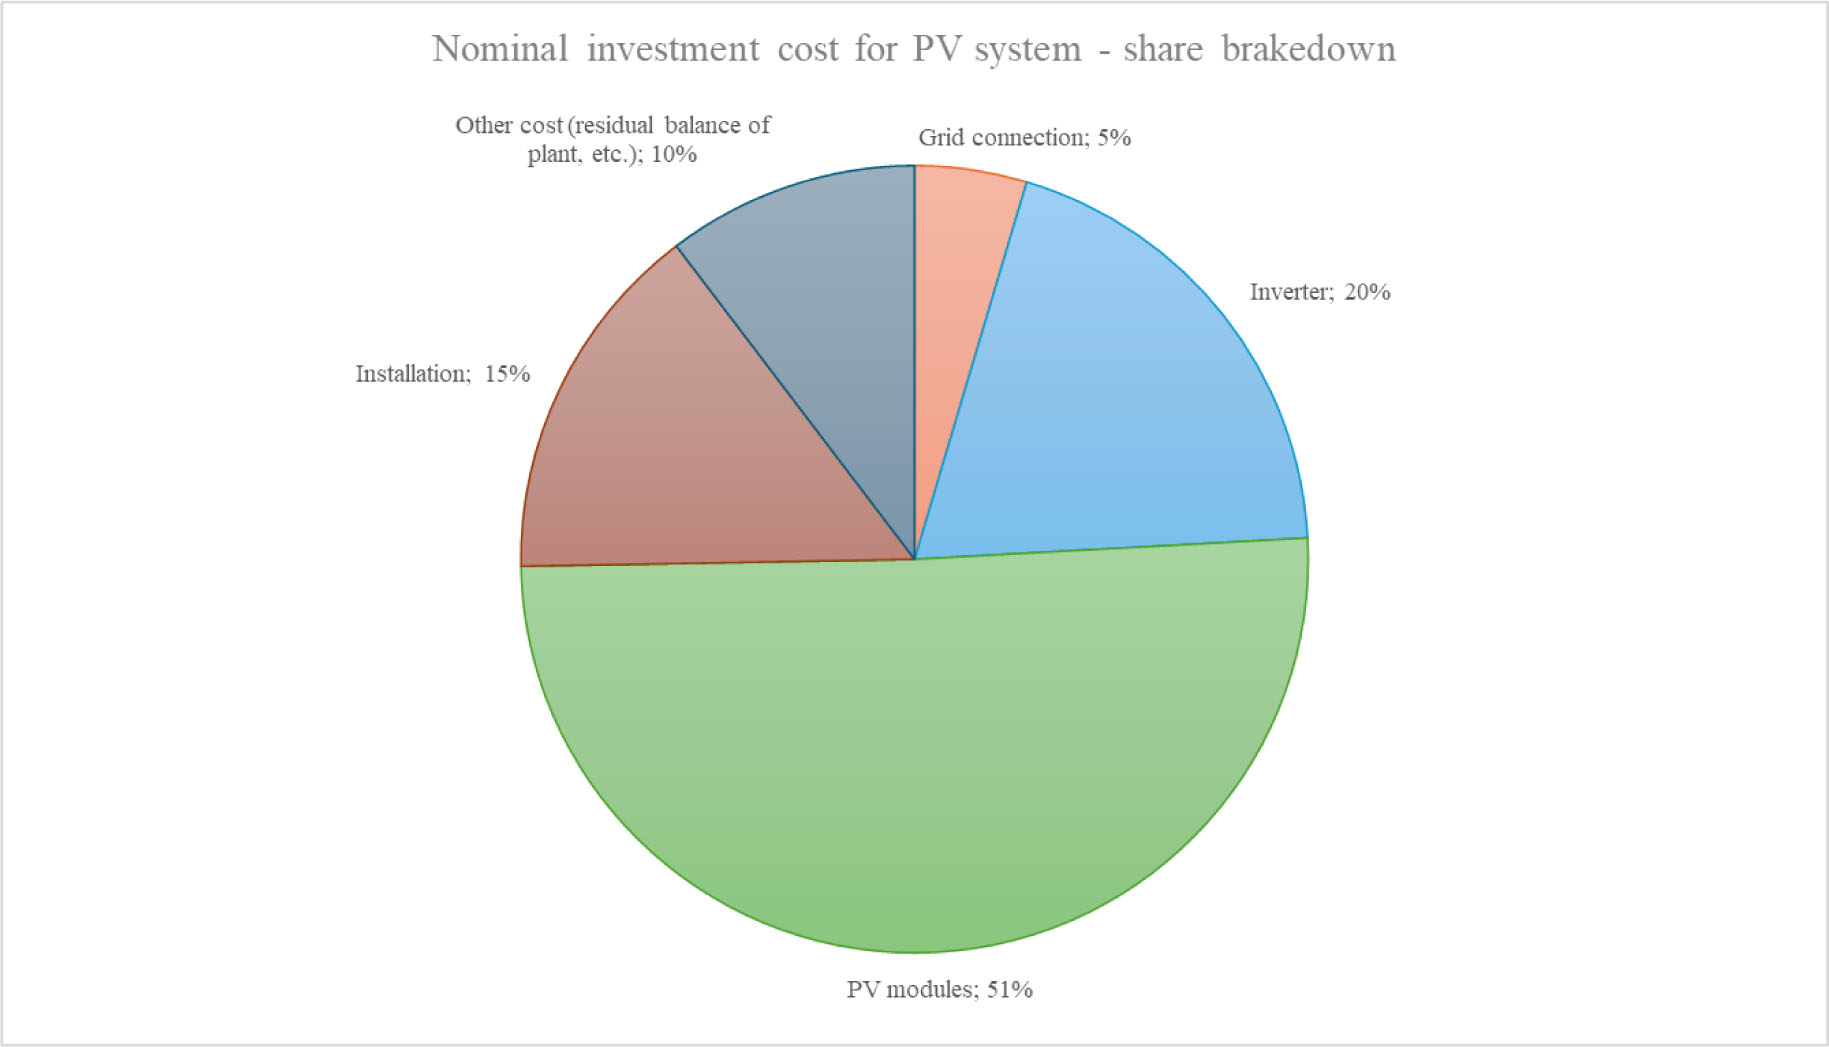
Investment cost is calculated based on the total capacity of the PV system that is possible to install. The nominal investment cost components and their share in total nominal investment cost are presented in Table 2 and Figure 5.
Breakdown of Nominal investment cost for PV system [14]
Grid connection |
0.040 |
MEUR/MW |
Inverter |
0.170 |
MEUR/MW |
PV modules |
0.440 |
MEUR/MW |
Installation |
0.130 |
MEUR/MW |
Other cost (residual balance of plant) |
0.090 |
MEUR/MW |
Total |
0.870 |
MEUR/MW |
Nominal investment cost for PV system - Overview [14]
Other input data for the method, including economic data, data on electricity prices, are presented in Table 3.
Other input data
Name |
Amount |
Unit |
Reference |
|---|---|---|---|
Discount rate (Cost of Capital) |
2,71 |
% |
[15] |
Project lifetime |
25 |
Year |
[14] |
Purchase price of electricity from the network |
149 |
EUR/MWh |
[16] |
Guaranteed purchase price of electricity |
119.2 |
EUR/MWh |
[16] |
Fixed O&M – Total |
10600 |
EUR/MW/a |
[14] |
Interest rate |
3.89 |
% |
|
Loan payback period |
15 |
Year |
- |
Tax rate |
18 |
% |
[19] |
Depreciation period – PV modules |
20 |
year |
[20] |
Depreciation period – Inverter |
10 |
year |
[20] |
Inverter lifetime |
15 |
year |
[21] |
Own funds |
20 |
% |
- |
EU co-financing |
40 |
% |
[22] |
Loan co-financing |
40 |
% |
- |
In this section the results and discussion are presented in two parts: Spatial and Energy analysis results and Economic results. Spatial analysis
The spatial analysis results identify and evaluate the physical and geographical suitability of building rooftops for solar energy systems. The energy analysis results show the potential electricity production of solar energy systems under local climatic and irradiation conditions. Finally, the economic analysis results present the cash flow of the project, tracking financial inflows and outflows over the project lifetime. Key performance indicators derived from this analysis include the LCOE, NPV, and IRR. LCOE provides a measure of the average cost per unit of electricity generated over the lifetime of the system, enabling comparison with market electricity prices.
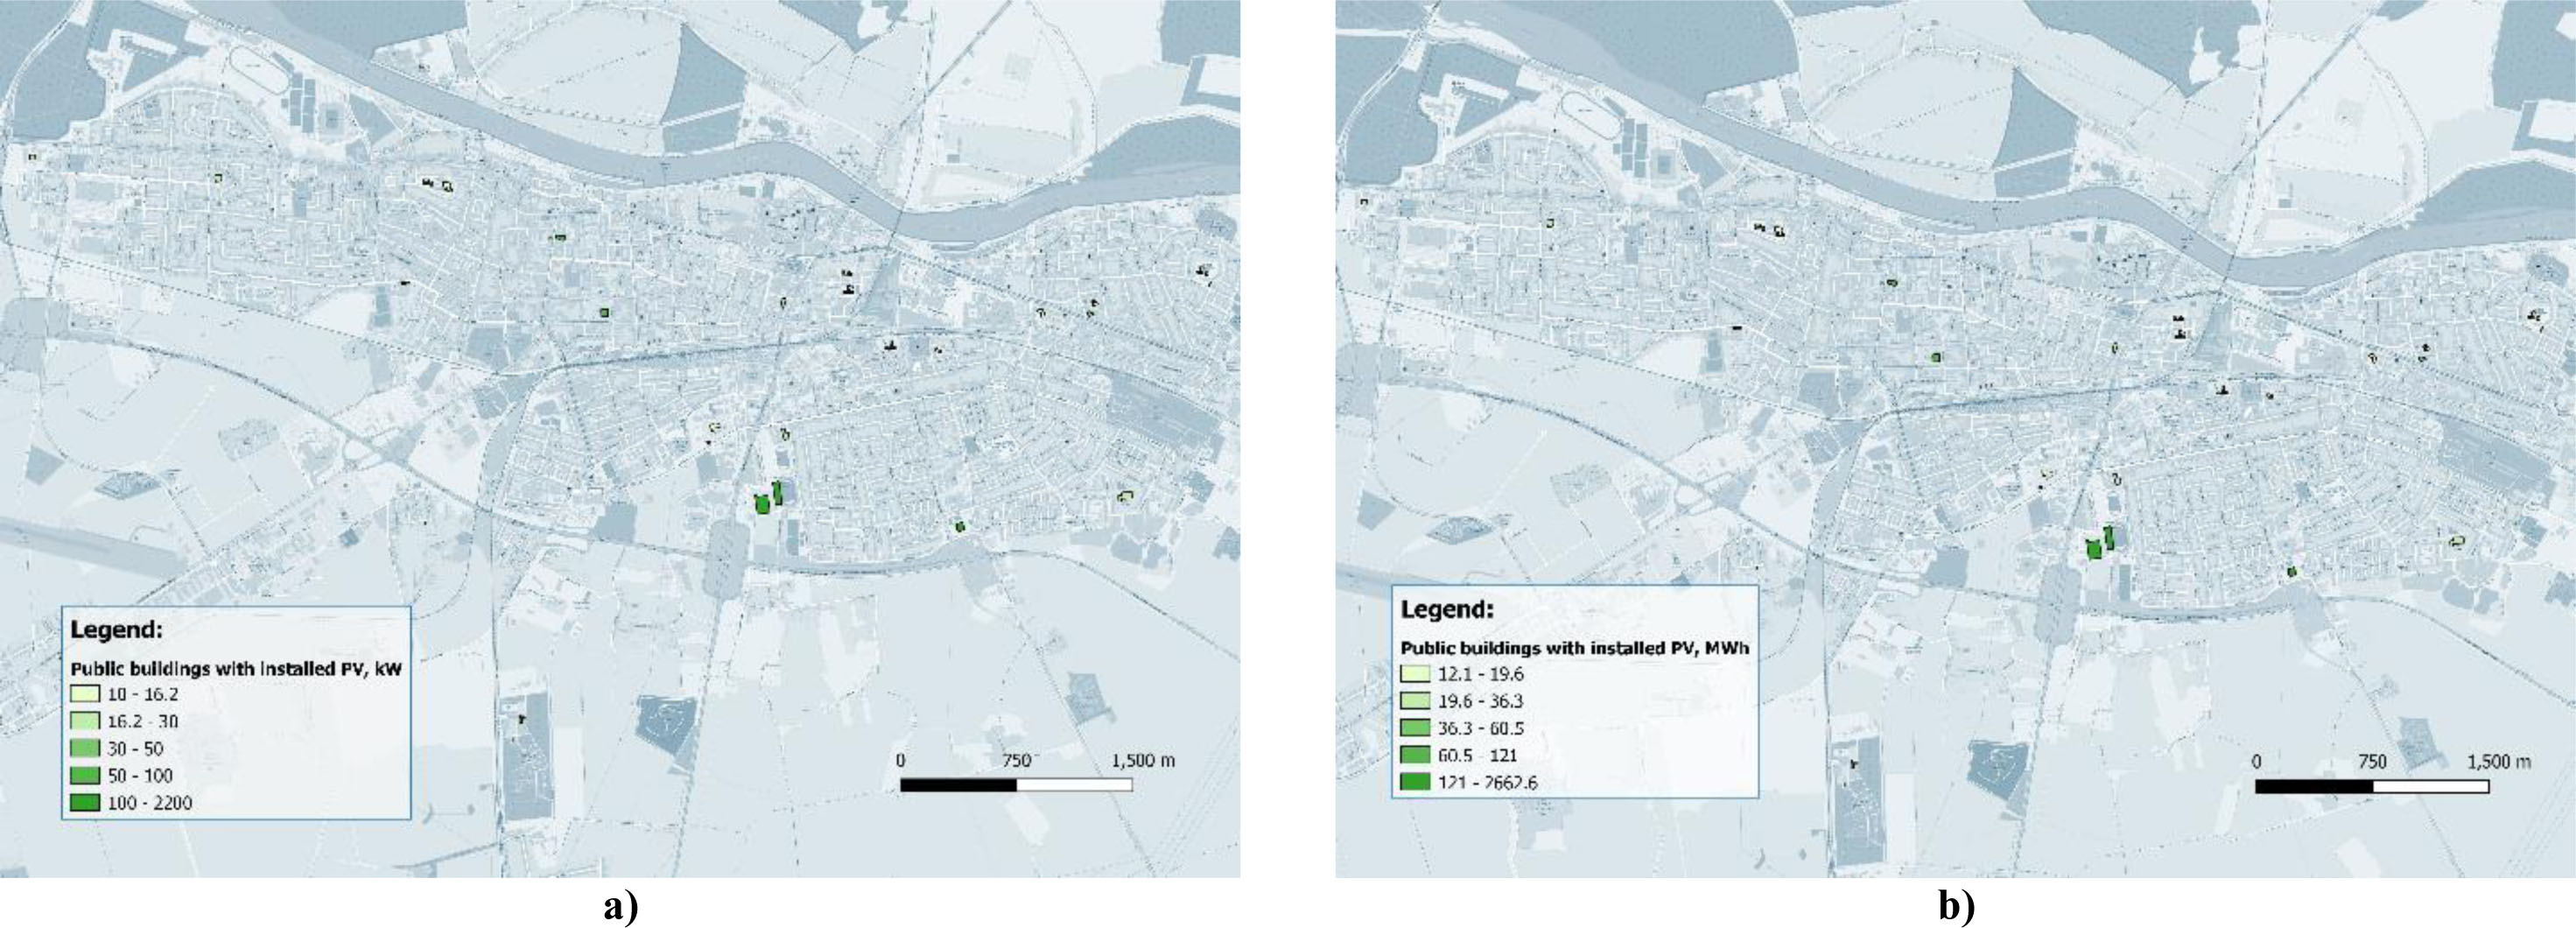
As mentioned in the Method section, public buildings with existing PV systems are mapped first, and they are presented in Figure 6. Also, the average annual production of the current PV systems is shown. The largest PV system installed at the city stadium “Gradski vrt” produces 2,662.6 MWh of electricity with a total installed capacity of 2.2 MW, while the smallest PV systems are located at two schools (Elementary school “Ljudevita Gaja” and “Vijenac”) with total PV system capacities of 30 kW, producing around 12 MWh of electricity.
City of Osijek – Public buildings with existing PV systems
In the second step, based on the correlation presented as eq. (1), the capacity of new PV systems for other identified public buildings is calculated and is presented in Figure 7a. Figure 7b presents production from new PV systems. The capacity ranges from 5 kW to 931 kW, which will allow production of electricity in the range from 6 MWh to 1,127 MWh.
City of Osijek – Public buildings with new PV systems
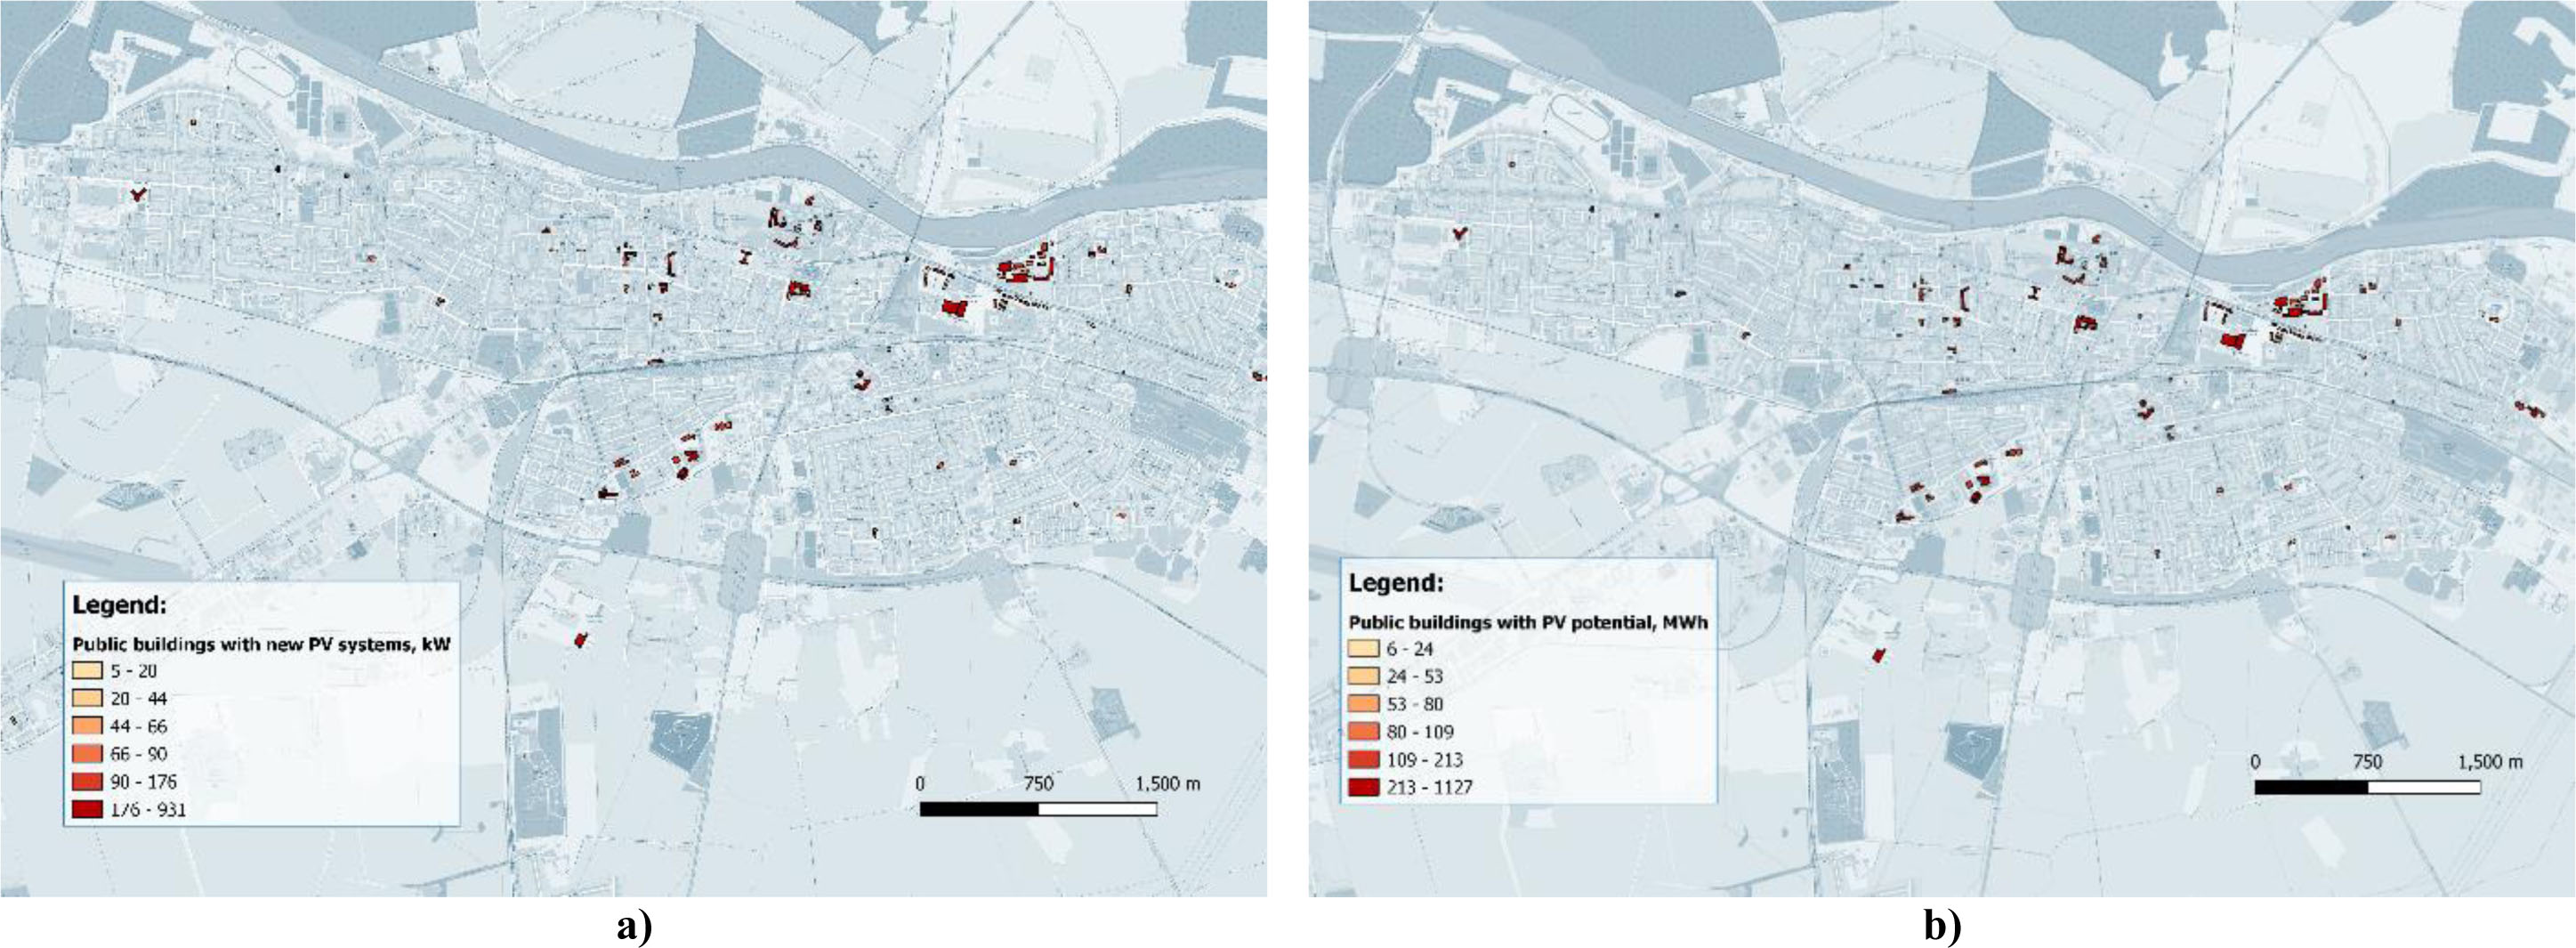
The largest PV system will be installed at the university campus building, Faculty of Agrobiotechnical Sciences, with a total capacity of 931 kW and production of 1,126.00 MWh/a. The smallest PV systems have a total capacity of 5 kW and a production of 6 MWh/a, and it is located at “Donji Grad” railway station.
In Table 4, total capacity is shown with expected electricity production from PV systems installed on public buildings.
PV system total capacities and production on public buildings
Total installed capacity, MW |
Total electricity production, MWh |
|
|---|---|---|
PV systems – existing |
4.42 |
5,350.98 |
PV systems – new |
11.884 |
14,379.64 |
TOTAL |
16.304 |
19,730.62 |
Figure 8a presents the monthly distribution of electricity production from newly installed fixed-angle PV systems on public buildings. The data demonstrate a clear seasonal variation in energy output, with production peaking during the summer months and decreasing during winter. The highest energy yields are observed in July and August, exceeding 1,700 kWh, which aligns with the period of maximum solar irradiance. Conversely, the lowest monthly production occurs in December and January, with values below 800 kWh.
Figure 8b illustrates the hourly electricity production profile of the same PV systems over one year. The data exhibit a high temporal resolution, capturing the intermittent nature of solar generation.
Monthly and hourly energy output from the new PV system on public buildings
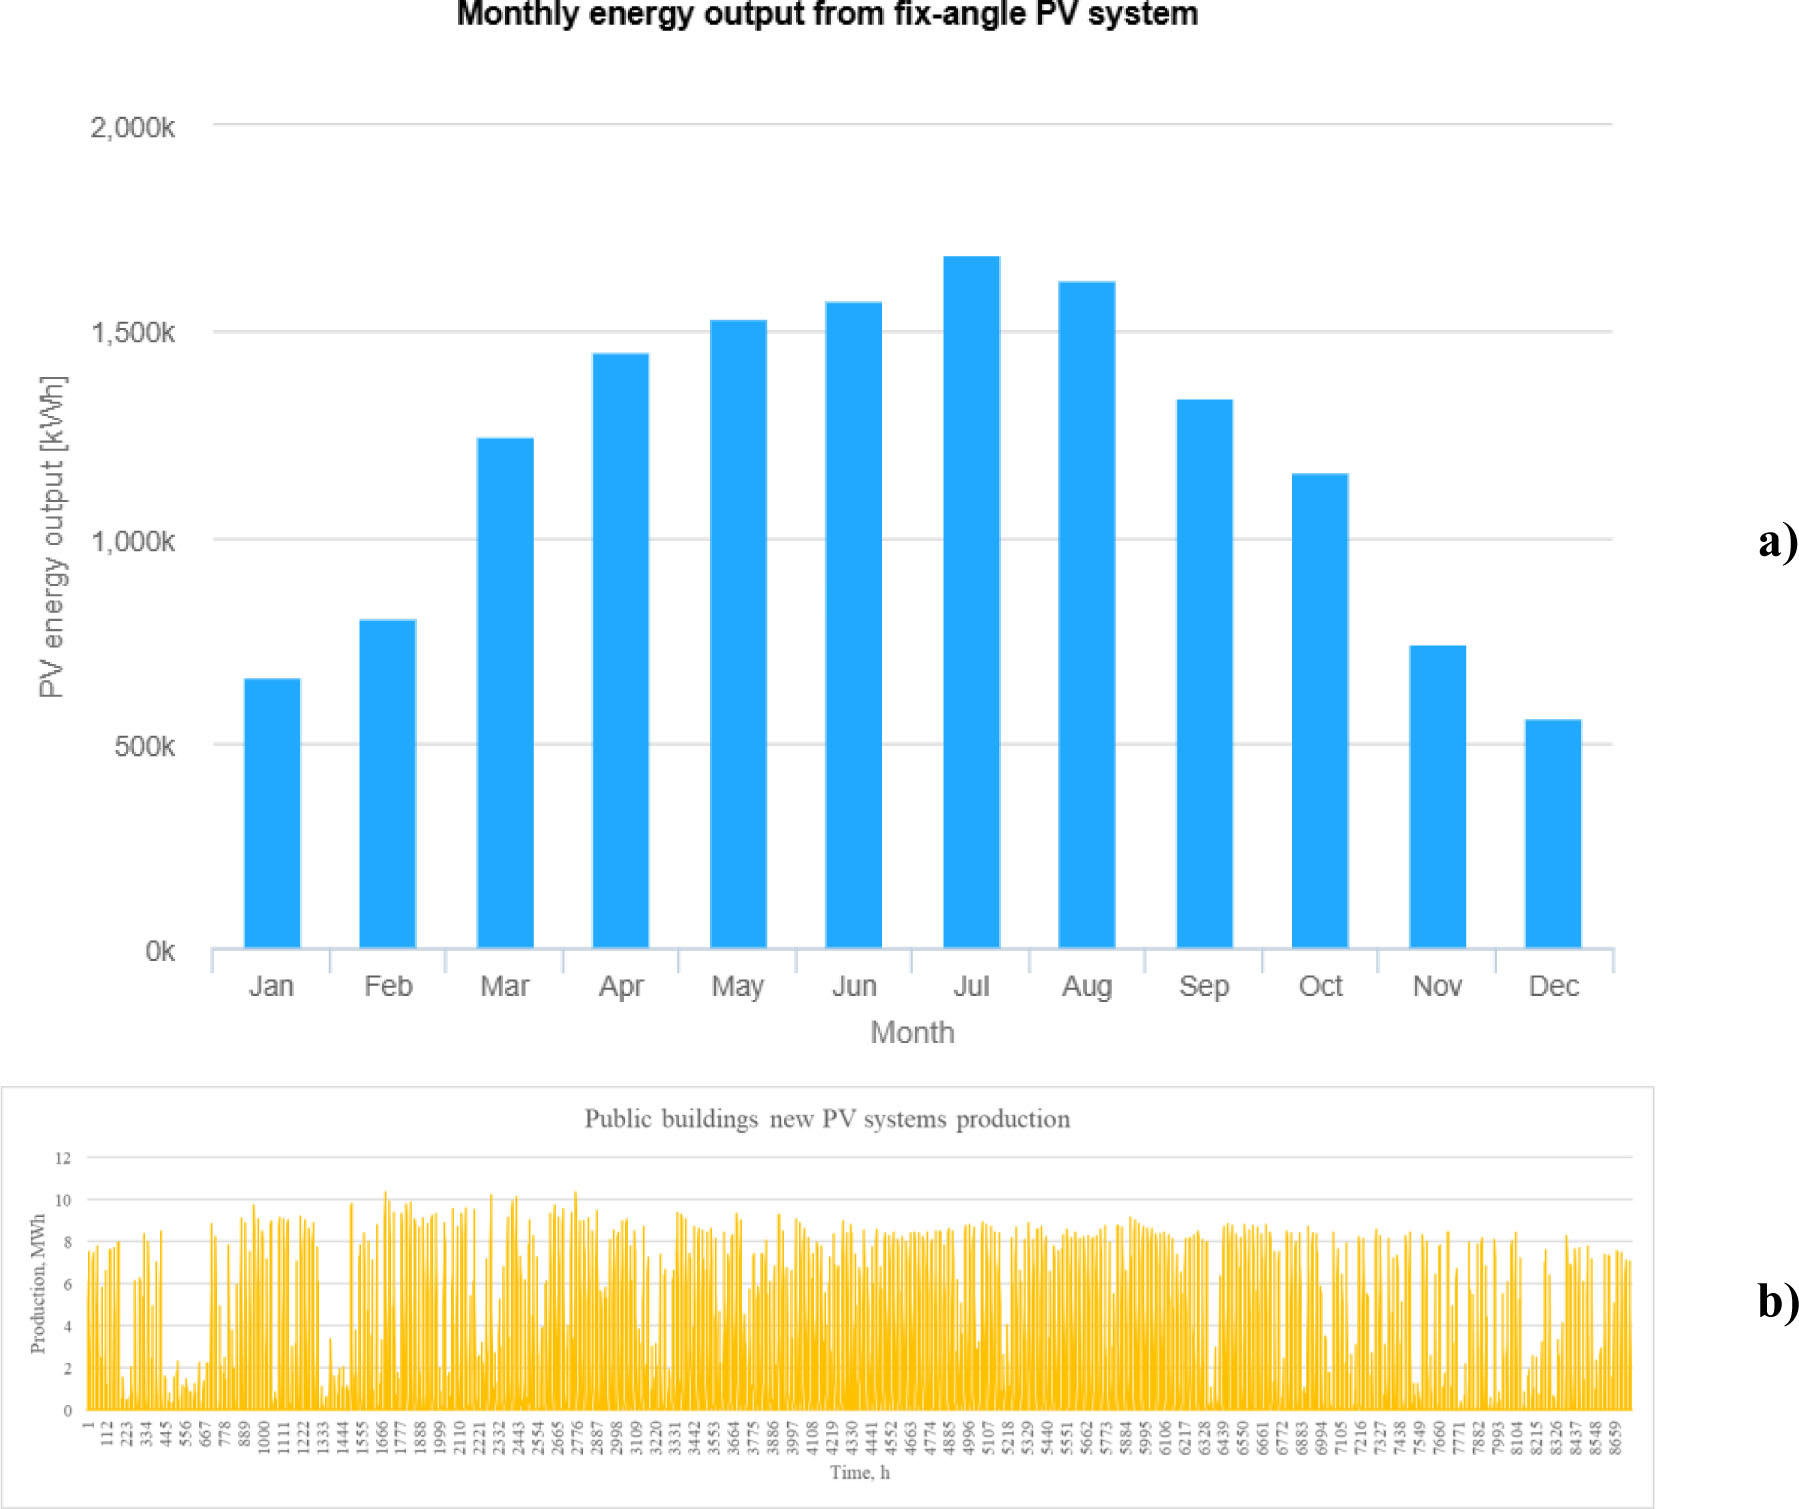
These figures provide an overview of the temporal dynamics of electricity generation from newly installed PV systems. The results underline the strong seasonal and diurnal variability of solar power, which is critical for designing appropriate energy storage, grid integration, or demand-side management strategies in public sector solarization projects.
In economic analysis, three parameters are most important: LCOE, IRR, and NPV. The results of these parameters for the project of solarization of the public buildings in the city of Osijek are presented in Table 5. It is shown that the production cost for producing energy from PV systems on public buildings is 49.74 EUR/MWh. Comparing this with the market electricity cost, which is 149 EUR/MWh, it is obvious that it is more feasible to produce and consume energy from PV systems.
Results of Key Economic Parameters
|
LCOE |
49.74 EUR/MWh |
|
IRR |
4.10% |
|
NPV |
1,470,244.77 EUR |
Other key parameters that were analysed in the economic analysis, i.e., IRR and NPV, show that the project of implementing PV systems is feasible. IRR is 4.10% which is higher than the discount rate (2.71%), while the NPV is 1,470,244.77 EUR, both favouring the positive outcome of the project. In Figure 9, the cumulative cash flow of the project is shown, highlighting the payback period of 21 years. In the figure, it is possible to see that there is a break in the curve. This is due to the inverter lifetime and the assumption that in the 15th year, the inverter change is needed, causing increased expenditure [21], [23].
Cumulative Cash Flow of the project
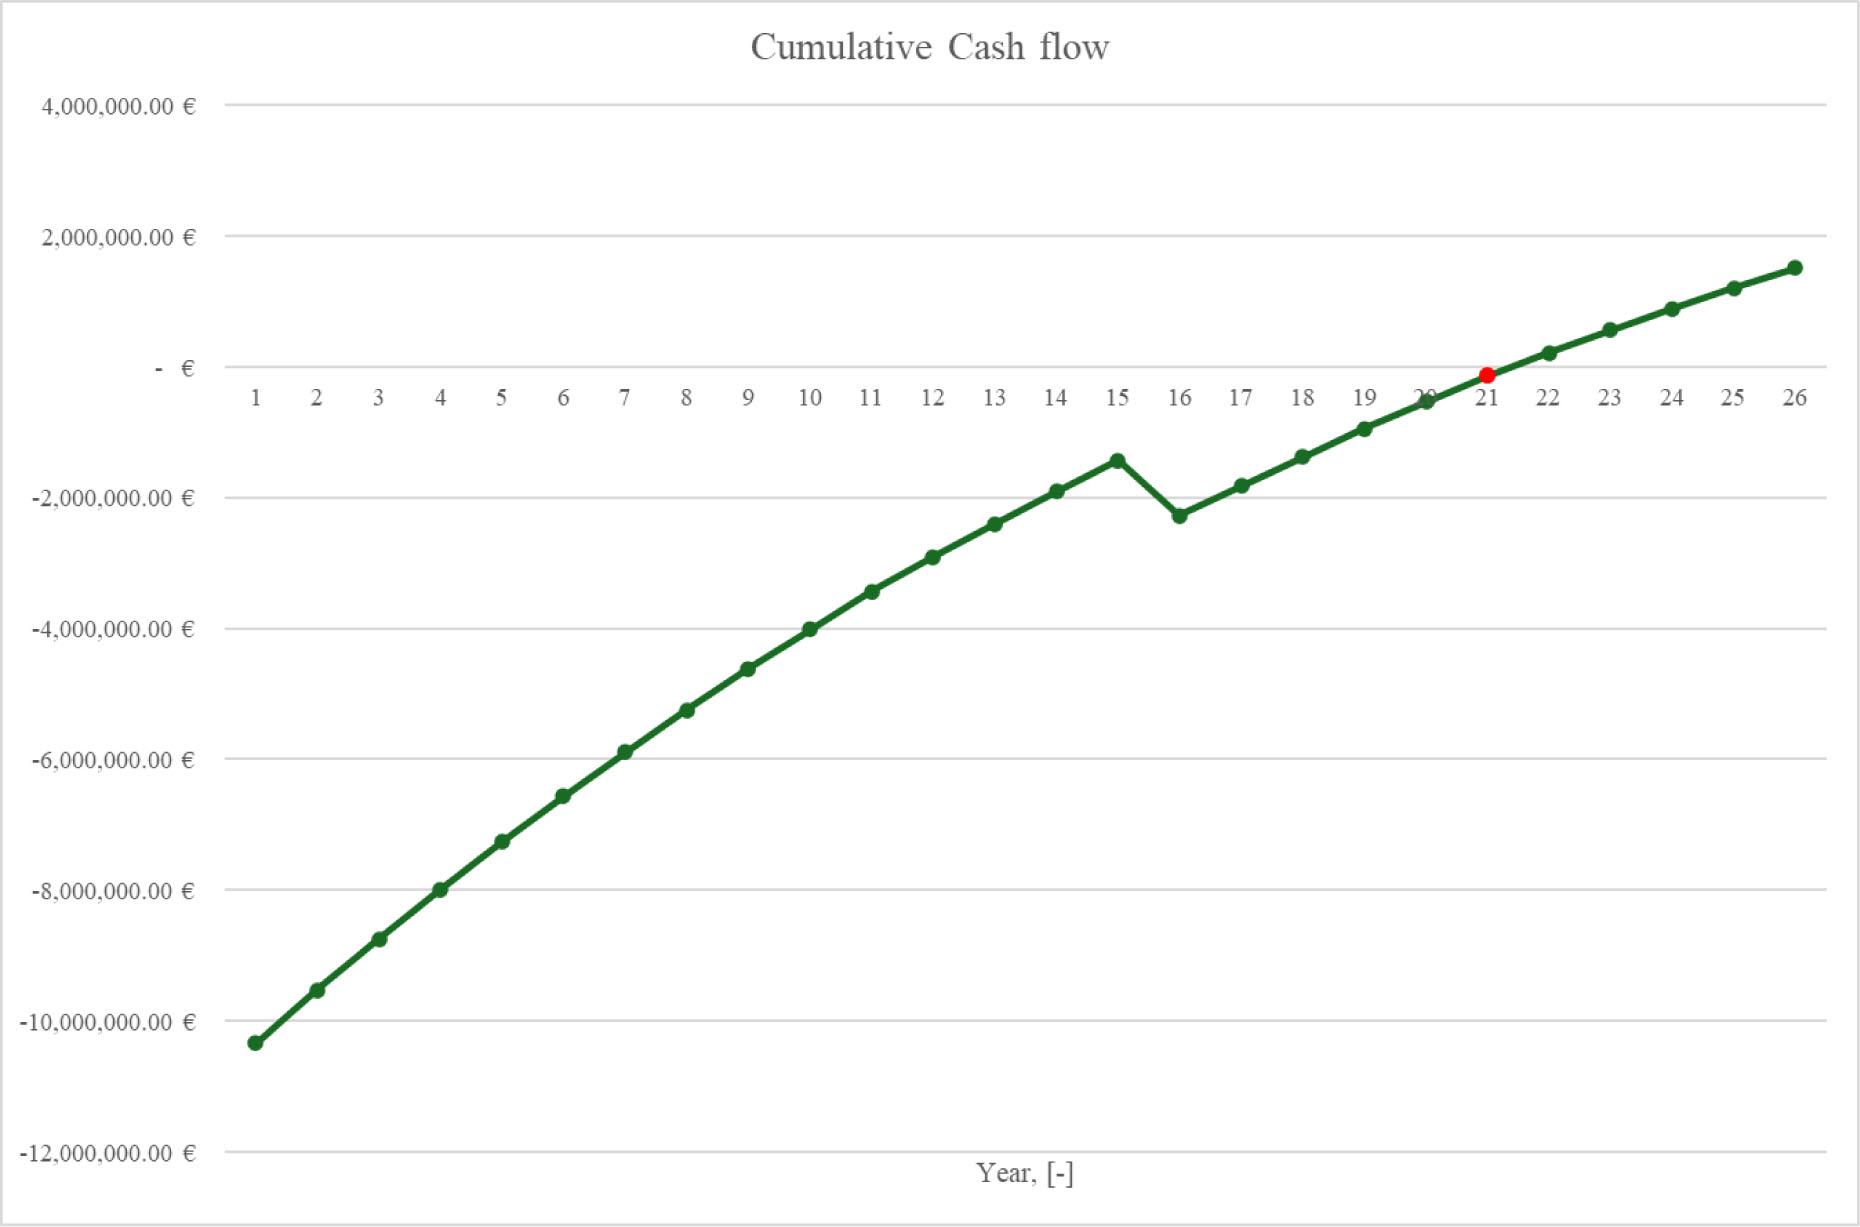
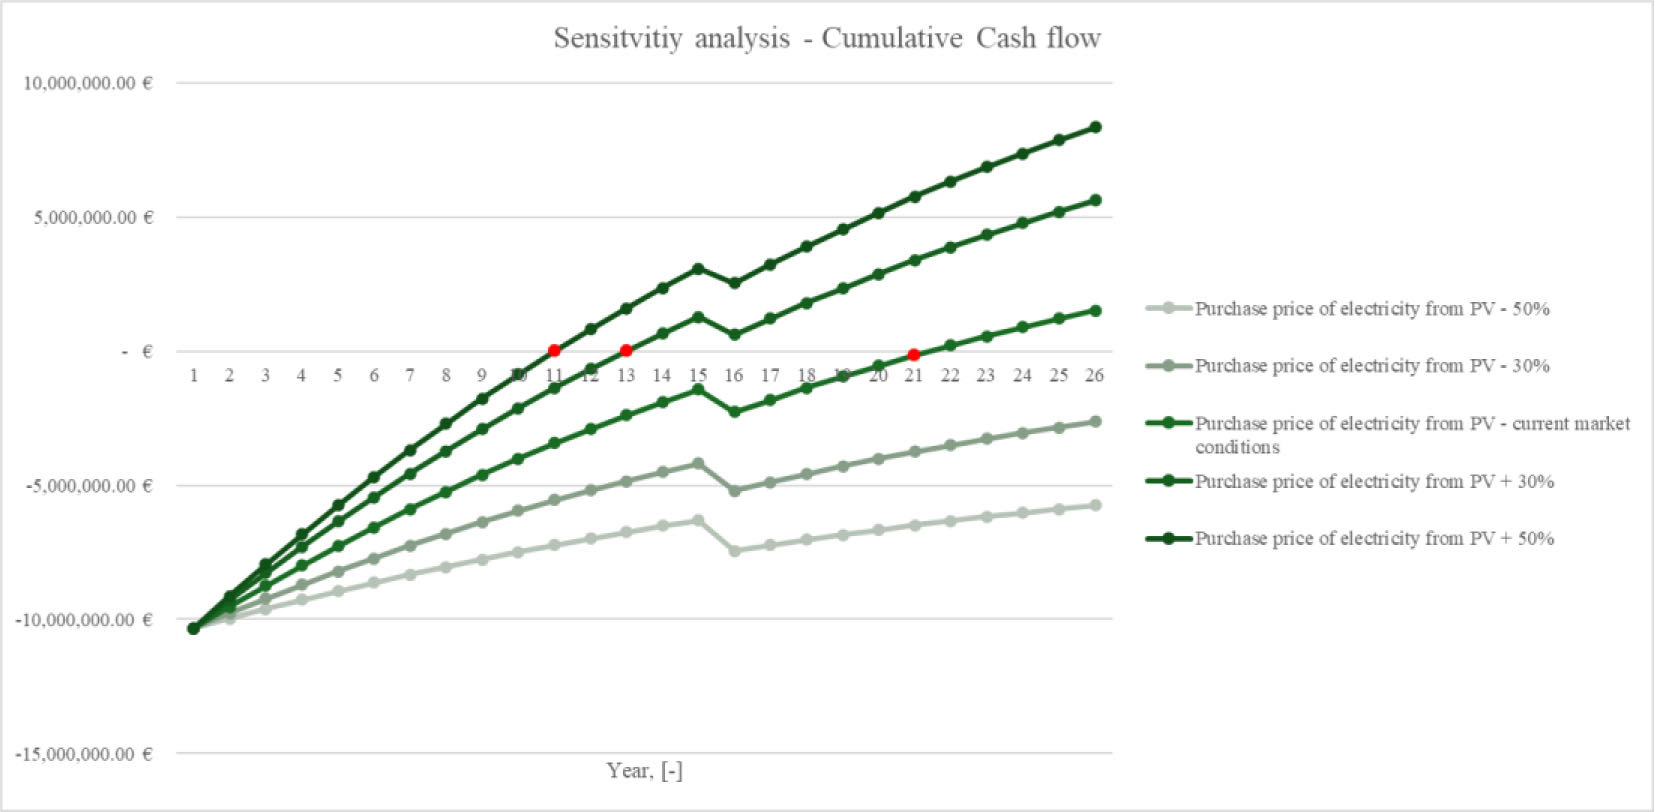
Also, the longer project payback period (the expected project payback period for PV systems is 10-15 years [24], [25]) is the result of the low purchase price of excess electricity that PV systems deliver to the grid, due to the current market conditions for public utilities set by the electricity system operator [16]. Figure 10 presents the effect of changing the guaranteed purchase price for excess electricity from a PV system and shows that for a small increase in the purchase price, a shorter payback period can be achieved, while if the purchase price is reduced, the project becomes unprofitable during the project lifetime.
Sensitivity analysis of the Purchase price of electricity on Cumulative Cash flow
The following section presents a more detailed economic calculation and the results obtained.
Figure 11 presents the cash flow overview for the public buildings solarization project over the entire project lifetime. The figure includes a breakdown of key financial components such as total revenue, total expenses, loan structure, depreciation, taxes, and cash flows, both financial and economic. It provides insight into the financial dynamics and long-term viability of the investment.
Cash flow – Overview by the years
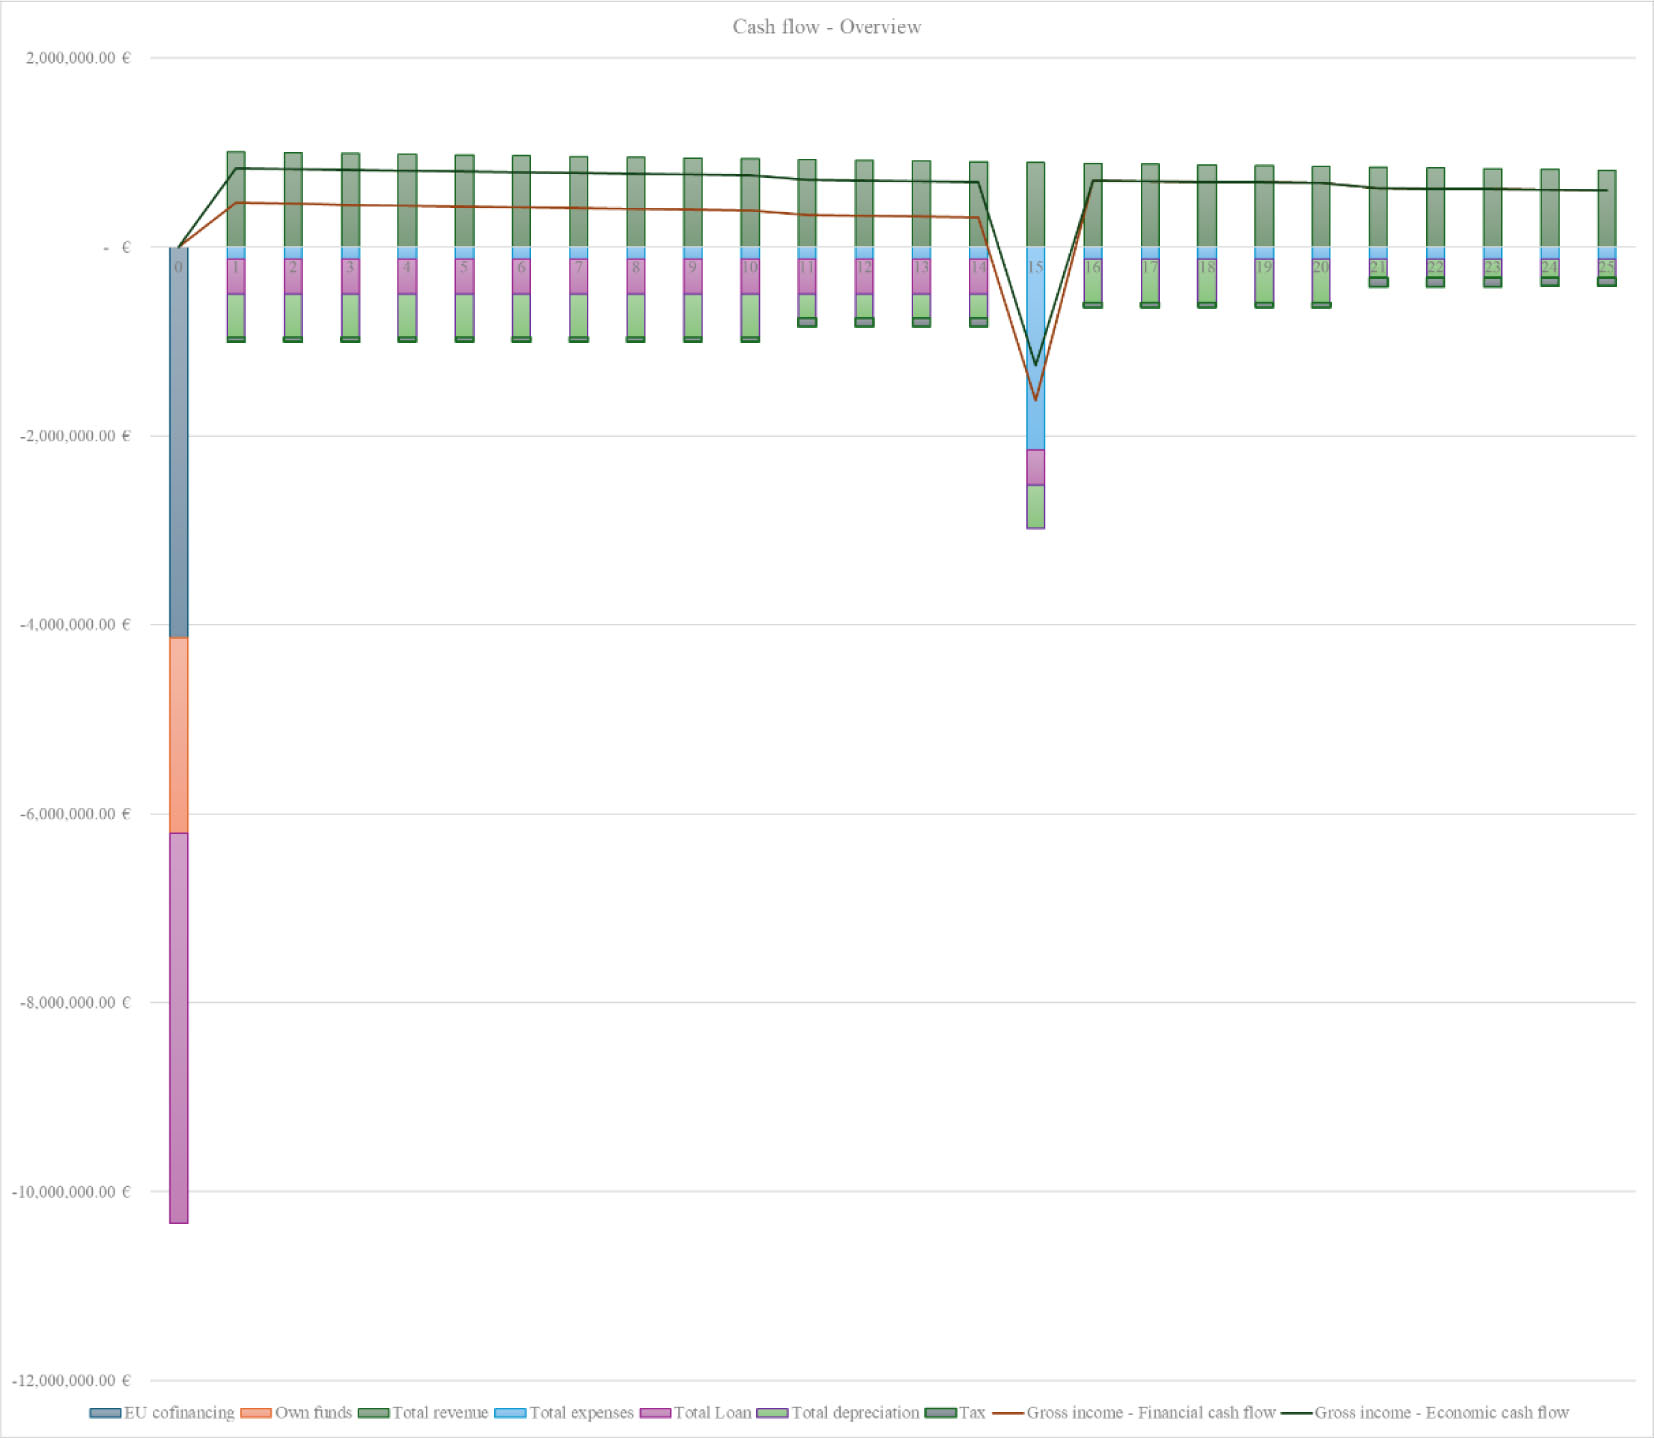
The initial year shows a substantial negative cash flow, primarily reflecting capital investment costs. The project financing is structured through a combination of EU co-financing and loan-based debt, as indicated by the stacked bars for “EU co-financing,” “Own funds,” and “Total loan.” This blended financing model significantly reduces the financial burden on the project initiators and enhances affordability.
During the operational phase (years 1 to 25), the project generates consistent annual gross revenues, which exceed operational expenses and taxes, resulting in positive financial and economic cash flows for most of the project lifespan. However, a marked deviation occurs in year 15, where both gross income and net cash flow sharply decline. This anomaly is attributed to the scheduled replacement of inverters, whose operational lifetime is shorter than that of PV modules. The associated capital outlay for inverter replacement is reflected as an increase in total expenses, leading to a temporary but notable dip in both financial and economic cash flows.
Despite this mid-term investment, the project resumes positive net earnings in the subsequent years, reaffirming its long-term financial sustainability. The figure also shows the impact of depreciation and tax obligations, which are consistently accounted for throughout the project lifecycle.
The cash flow analysis shown in Figure 11 demonstrates that the solarization of public buildings, when supported by a combination of EU funding and concessional loans, yields financially viable outcomes with manageable mid-life reinvestment requirements. The observed trends support the use of blended finance mechanisms and underscore the importance of accounting for component-specific lifetimes in long-term infrastructure projects.
Figure 12 presents the results of a sensitivity analysis conducted to evaluate the impact of variations in key techno-economic parameters on the IRR for a PV system implemented in public buildings. The analysis covers a ±50% change in three parameters: investment price, purchase price of electricity from PV, and PV system capacity. The discount rate, set at 3%, is included in the figure solely as a reference line to indicate the threshold of project feasibility; scenarios yielding IRR values above this rate are considered economically viable.
Sensitivity analysis – Overview of key parameters
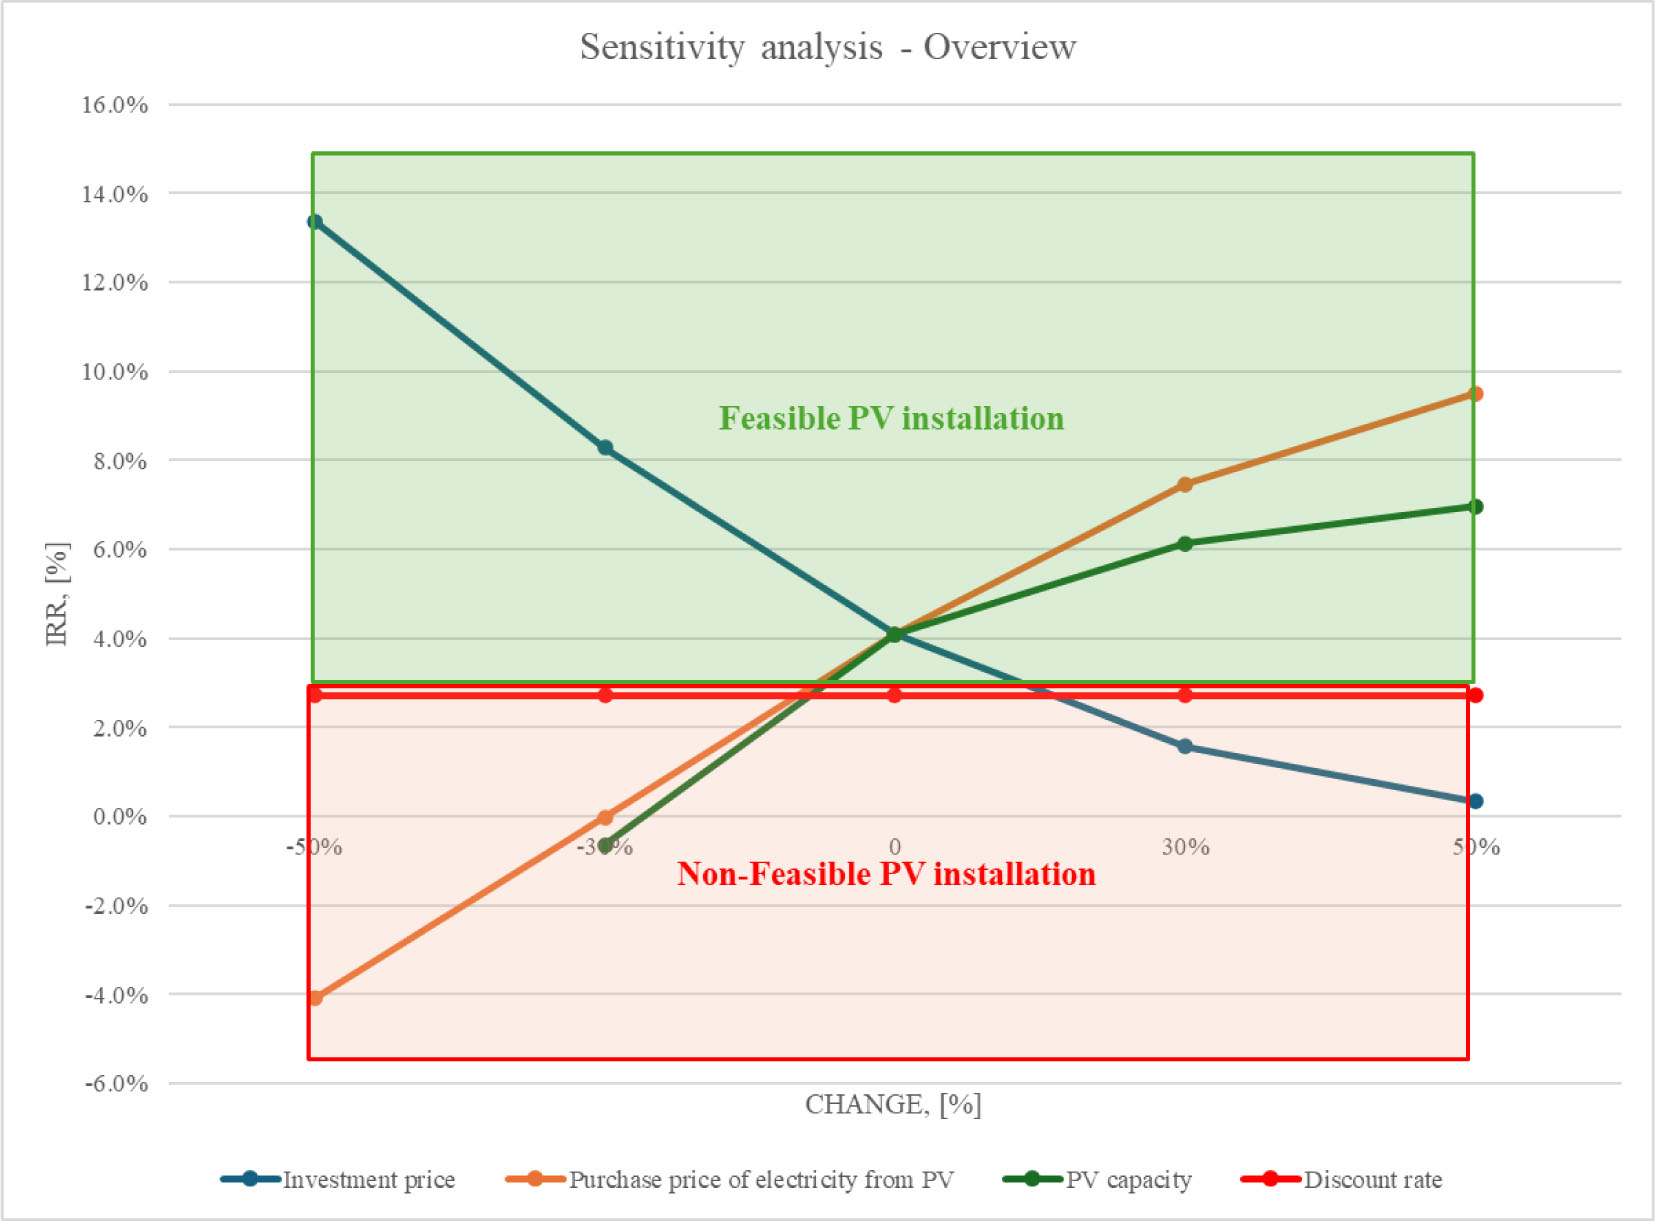
The investment price exhibits a strong inverse relationship with IRR. A 50% increase in the investment cost reduces the IRR to just above 0%, while a 50% decrease leads to an IRR exceeding 14%, indicating that reductions in capital expenditure significantly improve the economic performance of the PV system.
The purchase price of electricity from PV demonstrates a strong positive correlation with IRR. An increase of 50% in the electricity selling price results in an IRR of nearly 10%, while a 50% decrease causes the IRR to drop below -4%. This indicates that the revenue from electricity sales is a critical driver of project profitability.
Changes in PV system capacity have a moderate positive effect on IRR. A 50% increase in installed capacity raises the IRR to approximately 7%, while a 50% reduction leads to a decline in IRR close to 0%. This trend suggests that larger systems benefit from scale effects, although the impact is less pronounced compared to investment costs and electricity prices.
The horizontal line at 3% represents the discount rate, serving as the minimum acceptable rate of return for project feasibility. The green shaded region indicates parameter combinations where the project is considered feasible (IRR > 2.71%), while the red shaded area denotes non-feasible scenarios (IRR < 2.71%). Overall, the analysis highlights that investment cost and electricity sales price are the most influential parameters, emphasizing the need for cost-efficient technologies and favourable electricity purchase agreements to ensure economic viability of PV installations in public infrastructure.
This paper presents a comprehensive and replicable methodological framework for the spatial, energy, and economic analysis of the solarization of public buildings through the integration of PV systems. The method was applied to the City of Osijek as a case study to assess the feasibility and performance of large-scale PV integration in the public sector, using a combination of spatial data processing, energy simulation, and economic modelling based on cash flow analysis. The results highlight both the methodological robustness and the practical applicability of the proposed approach.
The novelty of this research lies in the integrated nature of the assessment method. While previous studies have investigated spatial, energy, or economic aspects of PV systems separately, this paper introduces a unified framework that links all three dimensions. Spatial data extracted from open-source GIS platforms was used to determine available rooftop surfaces across public buildings. These spatial characteristics were then correlated with empirical data on existing systems to estimate the potential PV capacities. Energy yield was assessed using location-specific simulations based on standard performance parameters and validated datasets. Finally, a detailed economic analysis, including the LCOE, NPV, and IRR, was conducted using dynamic cash flow modelling that accounted for system lifetime, operation and maintenance costs, component replacement schedules, and financing structure.
The case study of Osijek demonstrates the practical relevance of the method. Spatial analysis revealed that significant rooftop areas remain underutilized in terms of solar energy production. Based on the derived empirical relationship between roof area and installed system capacity, the total PV potential for new systems was estimated at 11.88 MW. Combined with existing systems, the total installed capacity reached 16.30 MW, capable of producing 19,730.62 MWh annually. These results confirm the technical feasibility and scalability of PV deployment in the public sector context.
Energy analysis showed strong seasonal variation in electricity generation, with summer months producing significantly more electricity than winter months. The use of high-resolution simulation data allowed for detailed temporal profiling of system performance, which is critical for future considerations such as storage needs or load balancing strategies. The production profile also aligns well with the typical working hours of public institutions, increasing the share of self-consumption and improving the return on investment.
Economic analysis indicated that the solarization of public buildings is financially viable under current market and policy conditions. The calculated LCOE is 49.74 EUR/MWh, which is substantially lower than the current grid electricity price of 149 EUR/MWh. The IRR was found to be 4.10%, exceeding the assumed discount rate of 2.71%, while the net present value amounted to 1.47 million euros, indicating long-term profitability. The cumulative cash flow analysis revealed a payback period of 21 years, with a temporary decrease in net cash flow during the 15th year due to the scheduled replacement of inverters. However, the financial model recovers thereafter and continues to generate net positive returns, demonstrating the long-term financial sustainability of the project. The duration of the project's payback period could be influenced by changing market conditions, i.e. by increasing the purchase price of electricity from PV systems, and it has been shown that with a small price increase, the project's payback period can be reduced to 10 to 15 years.
The sensitivity analysis further reinforced the economic robustness of the investment. Among the parameters tested, investment cost and electricity selling price had the most pronounced effects on the internal rate of return. A 50% reduction in investment cost increases the internal rate of return to above 14%, while a 50% decrease in the electricity price drops it below 0%, indicating a critical dependency on both capital costs and market conditions. The capacity of PV systems had a moderate impact, confirming that economies of scale can enhance project performance but are secondary to investment and revenue factors. These findings emphasize the importance of targeted public financing schemes and stable policy support, especially in the form of feed-in tariffs or capital subsidies, for encouraging the widespread adoption of solar energy in public infrastructure.
A key policy implication of the study is that the public sector can serve as a leading example in energy transition by implementing large-scale photovoltaic projects on its building stock. The results support recent directives and legislative developments at the European level, such as the EED and the RED, which mandate greater integration of renewable energy in the public building sector. The analytical framework developed in this study provides a decision-support tool for municipalities and national policymakers seeking to evaluate and prioritize solar investments across portfolios of public buildings.
The methodological transparency and modular structure of the framework allow for its adaptation to other urban contexts with minimal customization. By combining open-source geospatial tools, standardized energy modelling platforms, and universally applicable financial indicators, the approach is designed to be both scalable and transferable. Future research could focus on incorporating load profile data to assess self-consumption versus grid injection, evaluating the impact of battery storage systems, or extending the model to include hybrid systems and energy communities.
In conclusion, this paper contributes to the scientific and practical understanding of solar energy deployment in the public sector by providing a structured, data-driven, and integrated methodology for assessing the technical and economic potential of rooftop PV systems. The findings confirm that solarization of public buildings is not only technically and economically viable but also strategically aligned with regional and international energy policy objectives. The study offers a concrete framework for cities and municipalities to implement solar energy systems systematically and cost-effectively, thereby accelerating the energy transition and contributing to long-term sustainability goals.
- ,
- ,
- ,
Evaluating solar energy technical and economic potential on rooftops in an urban setting: the city of Lethbridge, Canada ,International Journal of Energy and Environmental Engineering , Vol. 10 (1), :13-322019, https://doi.org/10.1007/s40095-018-0289-1 - ,
Global Estimation of Building-Integrated Facade and Rooftop Photovoltaic Potential by Integrating 3D Building Footprint and Spatio-Temporal ,Datasets , 2024, https://doi.org/10.1016/j.ynexs.2025.100060 - ,
A review on technological and urban sustainability perspectives of advanced building-integrated photovoltaics ,Energy Sci Eng , Vol. 12 (3), :1265-12932024, https://doi.org/10.1002/ese3.1639 - ,
Holistic economic analysis of building integrated photovoltaics (BIPV) system: Case studies evaluation ,Energy Build , Vol. 203 , :1094612019, https://doi.org/10.1016/j.enbuild.2019.109461 - ,
Profitability of photovoltaic and battery systems on municipal buildings ,Renew Energy , Vol. 153 , :1163-11732020, https://doi.org/10.1016/j.renene.2020.02.077 - ,
Economic Viability and Environmental Benefits of Integrating Solar Photovoltaics in Public Community Buildings ,Energies 2025 , Vol. 18 (3), :7052025, https://doi.org/10.3390/en18030705 - ,
Impact of spatial layout optimization on photovoltaic power consumption: insights from China ,Int J Digit Earth , Vol. 18 (1), :24473392025, https://doi.org/10.1080/17538947.2024.2447339 - ,
Exploring non-residential technology adoption: an empirical analysis of factors associated with the adoption of photovoltaic systems by municipal authorities in Germany , 2022 - ,
Reduced real lifetime of PV panels – Economic consequences ,Solar Energy , Vol. 259 , :229-2342023, https://doi.org/10.1016/j.solener.2023.04.063 - ,
City of Osijek - Sustainable Energy and Climate Action Plan - SECAP, Regionalna energetska agencija Sjever (REA Sjever) ,Koprivnica , 2022 - ,
- ,
- ,
- ,
- ,
- ,
- ,
- ,
- ,
Life Expectancy of PV Inverters and Optimizers in Residential PV Systems ,Study, Burdorf , 2022 - ,
- ,
Lifetime evaluation method of PV inverter considering the influence of fundamental frequency and low frequency junction temperature ,Energy Reports , Vol. 8 , :249-2552022, https://doi.org/10.1016/j.egyr.2022.10.186 - ,
Review on Life Cycle Assessment of Energy Payback of Solar Photovoltaic Systems and a Case Study ,Energy Procedia , Vol. 105 , :68-742017, https://doi.org/10.1016/j.egypro.2017.03.281 - ,
Energy pay-back period analysis of stand-alone photovoltaic systems ,Renew Energy , Vol. 35 (7), :1444-14542010, https://doi.org/10.1016/j.renene.2009.12.016.