Sustainable mobility represents nowadays a big challenge, especially in urban areas, where traffic congestion is expensive both in terms of environmental impact, health issues and time loss. This situation is worsened by the large use of low-occupancy private cars: in Europe, the average occupancy rate is 1.8 passengers/car, while in Italy it is 1.7 [1]. However, in large cities, such as Milan, the rate, can drop to 1.2 passengers/car, thus increasing the risks of traffic jams, especially at peak-time [2]. This is the reason why, in urban areas, sharing mobility services, such as ride sharing (RS), are more and more adopted.
Ride sharing (RS), in its broader significance as “the shared use of transportation vehicles” (including “carpools, vanpools and public transit”) [3], has existed for several years. The first studies about the impacts and benefits of sharing vehicle rides on similar routes date back to the ‘80s, but were mostly focused on cases of private agreements between commuters or local pilot programs [4] and on how to assess impacts and benefits [3] with various methodologies, including surveys [5]. The idea of using web-based platforms to enhance the adoption of RS and to automatically match drivers and passengers was first developed at the end of the ‘90s by [6], with a study on a web-based application that had a ridematch optimization algorithm. In the last decade, however, with the spread of mobile applications, RS has been evolving in new forms. The two main types are represented by, long-distance ride sharing services, such as BlaBlaCar [7], and taxi-like services, such as Uber [8], on which studies, focused on their optimization, already exist [9]. The first type allows drivers to offer rides to passengers, with a pre-determined fee and a pre-determined route. It is mostly pre-booked, with a notice of some hours or days. The second type is, on the opposite, more used on short-distance, as an alternative to taxis. Also in this case, the fee (or a range of fees) is pre-determined, but, compared to the first type, it has the advantage to be in real-time. In both cases, passengers and drivers can leave feedbacks about each other, in order to improve the quality of the service.
The concept of RS is however in continuous evolution. According to recent studies, ride sharing can now be defined as an “automated system that facilitates drivers and riders to share one-time trips close to their desired departure times” [10]. This type of RS is also called dynamic ride sharing, real-time ride sharing, ad-hoc ride sharing, and instant ride sharing. Re-elaborating what suggested in [10], the main features of ride sharing, for the purpose of this study, shall be:
-
Dynamic – available on short notice, from few hours to few minutes before the departure;
-
Cost-sharing – applying an equal cost distribution among participants, in a way that all rider and passengers don’t have to pay more than the costs of travelling alone in a car; the economic advantage of the rider shall be less than the travel costs, in order not to do it for profit;
-
Private car – owned by the rider and not offering regular public service (e.g. taxi);
-
Random – offering occasional rides on short-distance and involving subjects that don’t necessarily know each other in advance;
-
Automatic matching – using automated software matching riders, based on optimization algorithms.
Ride sharing involves three main subjects: a driver, one or more riders, and a provider, that manages the service through a web-app and enables drivers and riders to access to the app.
Most of the work currently performed on RS is focused on the optimization of the online platforms used to match demand and offer, for example how to maximize the use of resources [11], how to consider travel uncertainty in matching optimization [12] and how to reduce the fares to compensate for detour and delay [13].
Several studies have tried to model RS in different cities, considering also broader impacts on environment and traffic congestion, for example in:
-
Riyadh [14], where GPS data are used to match rides and drives through a free app, with the aim to reduce traffic jams;
-
Beijing [15], where the main focus is on environmental performances, and both a “state of the art” Ride Sharing and an evolution in terms of less vehicles and adoption of Electric vehicles is studied;
-
Paris region [16], where also long- term effects of RS (such as rebound effect due to relocation of part of the population in outer areas) are considered;
-
Dublin [17], where a model is built with the same software as used for this work (COPERT) and the impact is considered in terms of reductions in emissions and the vehicle kilometres travelled;
-
a comparison between Barcelona and Hanover [18], where two pilot tests were held in order to evaluate mostly behavioural factors such as the intention of use RS for commuting and leisure trips and the most important design factors to attract users.
For Italy, some studies show example of modelling algorithms applied to simulated realities and tested with focus groups [19] and of optimization of ride sharing services through the use of mobile-phone data [20]. However, RS is not yet adopted in its full potential in any Italian city.
This paper wants to investigate how to simulate RS adoption in large cities, with an example of its application in one of the largest cities of the country. In particular, Milan Metropolitan Area (MMA) has been chosen due to two main reasons:
-
it has a high population density and a strong public transport offer;
-
there is a large database related to passengers mobility, thanks to a previous investigation from the municipality transport agency [2].
Moreover, Milan represents the core of Italian financial activity, with a very large number of companies and offices, and it is the most receptive city in Italy in terms of adoption of shared mobility, with a rate of Car Sharing subscriptions that is close to one third of the residents [21].
Thus, it can be considered one of the main hubs both in terms of mobility and economic activities, and can be used as a model for similar cities across the EU.
Some other sources investigate similar topics, but focusing on different results or using different methodologies. In particular, [22] highlights the impact of RS on vehicle-km travelled, but it includes also other types of vehicles used for RS, such as buses and vans and sees it as a replacement also for Local Public Transport. [23] investigates the use of GPS data to assess the applicability of RS in Tokyo area, with goals that are similar to this study but a different methodological approach. A similar approach is followed in [24], where RS is examined in the city of Atlanta with the aim to optimize rider-driver matching through the minimization of the total system-wide vehicle miles incurred by system users, and their individual travel costs.
The first part of the paper introduces the investigation methods, that can be replied to other cities, and the definition of the case study area. This is followed by the results of the simulation, applied to the case study, and the evaluation of the impacts (in terms of energy efficiency, environmental pollution and economics). The final part is focused on policy recommendations and future developments.
The applied transport model is based on a multimodal and multi-hour assignment, developed with the software VISUM [25].
The transport “offer” (network model) has been built using a graph that includes road network (based on Navteq commercial graph), with information on car, motorbike and pedestrian trips, together with bicycle lanes and LPT transit lanes. To this, the railway and the subway have been added as incremental networks.
In order to build the transport demand, there could be several pathways: for this study, the results of a survey on a sample of around 15% of the urban population (200,000 people), performed by the Municipality of Milan transport office (AMAT - []), has been used. This has allowed to build the Origin/Destination (O/D) matrix for an average working day, disaggregated over 24 hours: it indicates the number of estimated movements of people for each hour and each O/D pair.
Five main transport modes have been considered, according to what emerged from the results of the surveys: car, motorbike, bike, pedestrian, local public transport (bus, trolleybus, tram, subway and railway – LPT). Moreover, a sixth mode, called mixed, that involves the combination of car and LPT in the same trip, has been added.
Once demand and offer have been defined, the modal split (rate of choice for each transport mode) was calculated and assigned to the multimodal transport network in VISUM. The modal split falls within a multinomial Logit model that estimates the use of each transport mode based on “comfort” parameters, mostly related to time (travel time, parking searching time, pedestrian time) and trip costs (cost per passenger-km of private car [26], ticket fares [27], parking fare, traffic pollution charge).
The results are then used as input to assess the energy and environmental performance of the baseline case (and, in a further step, the sustainable mobility scenarios), with the software COPERT (the EU standard vehicle emissions calculator for emissions and energy consumption for a specific country or region [28]). The circulating vehicles are as per the national inventory by ISPRA [29] adapted to Milan Metropolitan Area (MMA).
In a previous study on sustainable mobility in MMA [30], the same transport model was used to simulate several sustainable mobility measures, as scenarios evolving from a baseline case. For this study, by using the same baseline case, further scenarios were analysed, where Ride Sharing was considered in parallel with the other mobility solutions in order to evaluate its applicability in MMA.
As mentioned in the previous paragraph, energy and environmental performances are calculated through the use of the software COPERT.
In order to evaluate the economic performances, the main source are the specific costs reported in the 2016 Sustainable Urban Mobility Plan (SUMP) of the municipality of Milan [31]. The main financial difference, compared to the baseline case, is related to both investment costs and variations in revenues and operating costs for public transport, parking areas and restricted traffic zones, all affecting the Municipality of Milan. With a standard formula, an annual cost (AC) of the Ride Sharing has been defined:
(1),
where:
-
is the investment required to implement the mobility measure;
-
is the discount rate (assumed at 3%);
-
is the duration of the loan (assumed at 30 years);
-
is the variation of the operating cost (negative values mean a net income for the municipality of Milan).
Since sustainable mobility measures (RS in this case) generate also non-financial positive impacts, that benefit society in terms of environmental and energy efficiency impacts and reduction of traffic congestion, a Net Annualized Cost was defined, that rewards the maximization of these types of benefits. The Net Annualized Cost is then normalized on the number of passengers daily traveling in the MMA, in order to obtain the per capita cost for RS:
(2)
, , , are calculated as the monetisation of energy savings (with reference to Italian electricity and fuel prices - that can be found in [32], [33] and [34]), CO2 and PM2,5 emissions avoided and congestion reduction (with reference to [35] and [36]).
As mentioned in the previous paragraph, Milan Metropolitan Area has been defined as the area where the methodology could be validated.
It has been chosen due to several reasons:
-
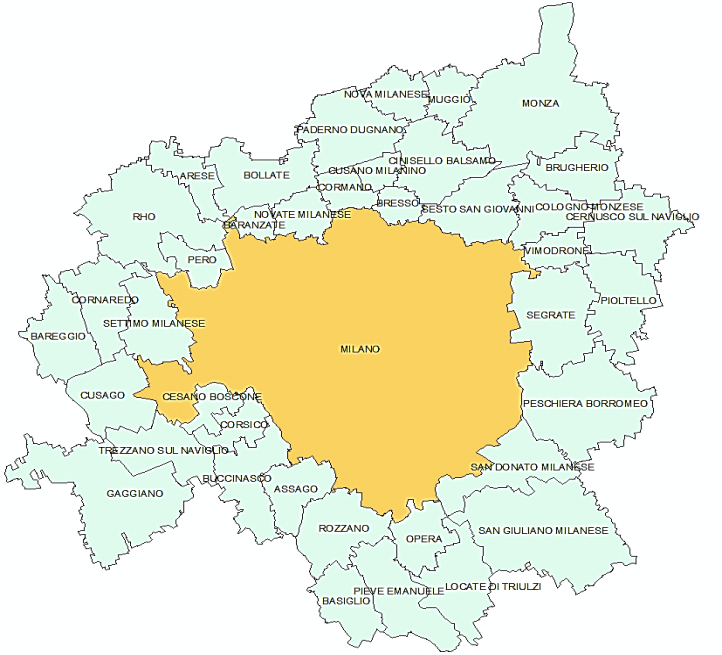
excluding Rome, Milan it is the most populated Italian city (1.35 million people and 7,400 inhabitants per km2 in the municipality, 3.2 million people and 2,000 inhabitants per km2 in MMA, that comprehends 39 municipalities, as shown in Figure 1);
-
during a normal working day, it accounts for 3.8 million people moving in the area, 80% of which inhabitants and the rest commuting from nearby provinces, with around 7.5 million trips in total [2];
-
it is one of the most important transport nodes of the country, in terms of air, rail, road networks, and LPT;
-
its LPT network is one of the most efficient in Italy, with 268 surface lines (buses, trams, trolley buses), 4 metro routes and 46 railway stations.
The Milan Metropolitan Area: the city of Milan and the 39 municipalities around it.
LPT is provided by ATM, a public limited company owned by the municipality, that manages also car parks, car sharing and bike sharing services.
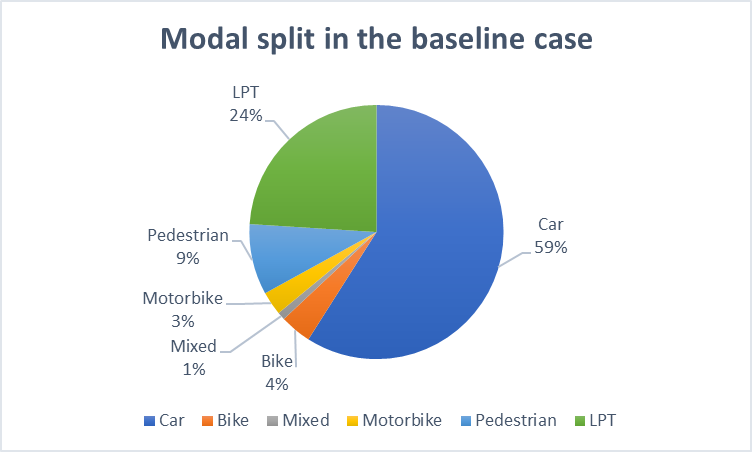
The main results of the baseline case simulation are shown in Figure 2 and Table 1. Private car is the main transport mode (59% of the trips), followed by LPT (24%) and pedestrian (11%). The other transport modes account for less than 5%. In terms of travelled distance, most of it (65.2%) is attributed to individual motorized transport (car and motorbikes), while LPT accounts for 30.1%. Less than 5% is performed through non-motorized transport. In terms of energy consumption, most of the 719 toe/y are due to fossil fuels (647 toe/y). Through the software COPERT, the main pollutants have been quantified in 1,781 kt/y of CO2 and 738 t/y of PM2.5.
Modal split in the Milan Metropolitan Area baseline case
Distances travelled by passengers and cars in the baseline case
|
Transport mode |
Passengers transport |
Traffic flow |
||
|
Passenger-km |
% |
Vehicle-km |
% |
|
|
Pedestrian |
1,513,976 |
3% |
1,513,976 |
5% |
|
Bike |
1,088,958 |
2% |
1,088,958 |
3% |
|
LPT |
16,736,491 |
30% |
463,607 |
1% |
|
Car |
34,799,546 |
62% |
29,052,404 |
87% |
|
Motorbike |
1,397,246 |
3% |
1,397,246 |
4% |
The mixed mode doesn’t appear in the table, since all the travelled distances have been divided in the modes composing it.
The RS model for the MMA has been built as one of the evolutions of the baseline case model. Two main parameters have been inserted:
-
Number of RS subscribers: the number of subscribers has been assumed equal to 20% of the population travelling in the city everyday (760,000 subscribers out of 3.8 million travellers), of which 50% are riders. 20% has been assumed considering also the high penetration that current car sharing services have in the city (around 30% of the residents are subscribed to at least one car sharing service, according to [21]).
-
Review of the transport model: RS has been added to the previously considered transport modes (car, motorbike, bike, pedestrian, LPT, mixed). Two cases have been analysed, one with RS as parallel to the other transport modes, and one as RS as a sub-mode of car, in parallel with private car. The two options are shown in Figure 3 and Figure 4.
Logit model with RS in parallel to other transport modes

Logit model with RS as sub-mode of car

The final adopted model has been the one reported in Figure 4, where the parameters for “old” transportation modes haven’t been changed with respect to the baseline case, while for RS the occupancy rate of the car has been put equal to 2, the unavailability of the car equal to the complementary to the number of RS subscribers, and, for riders, pedestrian time has been reduced and parking time has been set to 0.
In the next paragraphs, results are presented and the impact of RS is assessed in terms of mobility demand, energy and environmental performances and economics, in comparison with the above described baseline case.
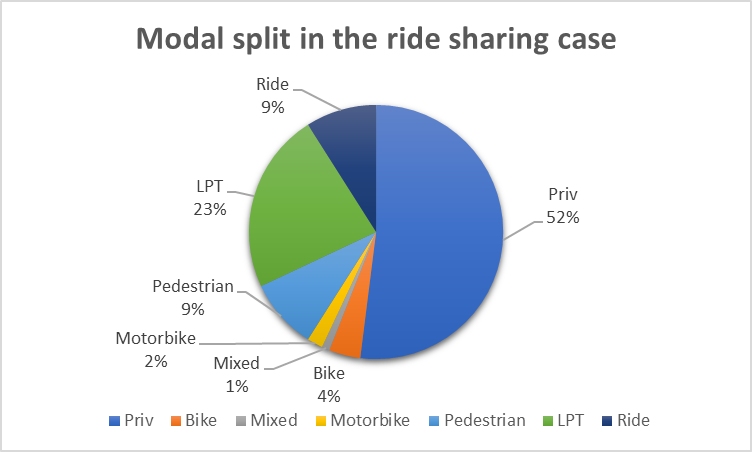
Mobility demand, with the final Logit model, gives the result that private car (Priv) is still the most used mode, however 9% of rides is covered by ride sharing, as shown in Figure 5. The 9% of share in RS is mostly related to a reduction in private cars use, while LPT and motorbike lose 1% of share each with respect to the baseline case.
Modal split in the ride sharing case
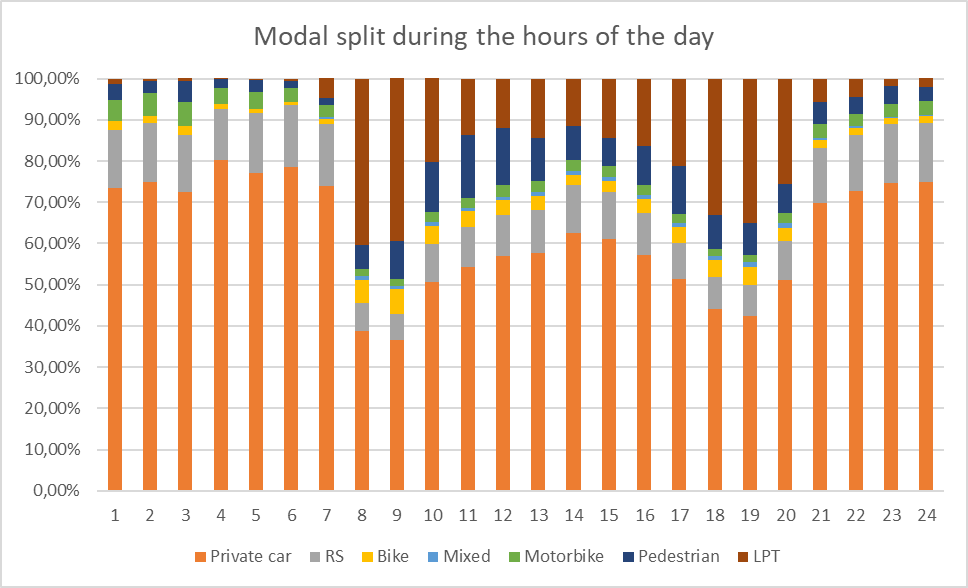
Considering the split during the day, in Figure 6 it can be noticed that private car is largely used at night, while LPT increases at peak time hours. Ride sharing is used at the same rate at almost all times of the day, with a small reduction at peak time, when LPT service is available at a higher frequency. In general, it follows the trend of the private car.
Modal split during the day
Considering the travelled distances, the main results are reported in Table 2. As already mentioned for the baseline case, mixed mode is here split into the different modes included in it. Moreover, RS and private car are summed-up as “car”.
Distances travelled by passengers and cars in the RS case
|
Transport mode |
Passengers transport |
Traffic flow |
Occupancy rate |
||
|
Passenger-km |
% |
Vehicle-km |
% |
||
|
Pedestrian |
1,431,955 |
3% |
1,431,955 |
5% |
1 |
|
Bike |
1,032,866 |
2% |
1,032,866 |
3% |
1 |
|
LPT |
15,911,016 |
29% |
463607 |
1% |
34.3 |
|
Car |
35,329,902 |
64% |
27,409,772 |
87% |
1.3 |
|
Motorbike |
1,143,875 |
2% |
1,143,875 |
4% |
1 |
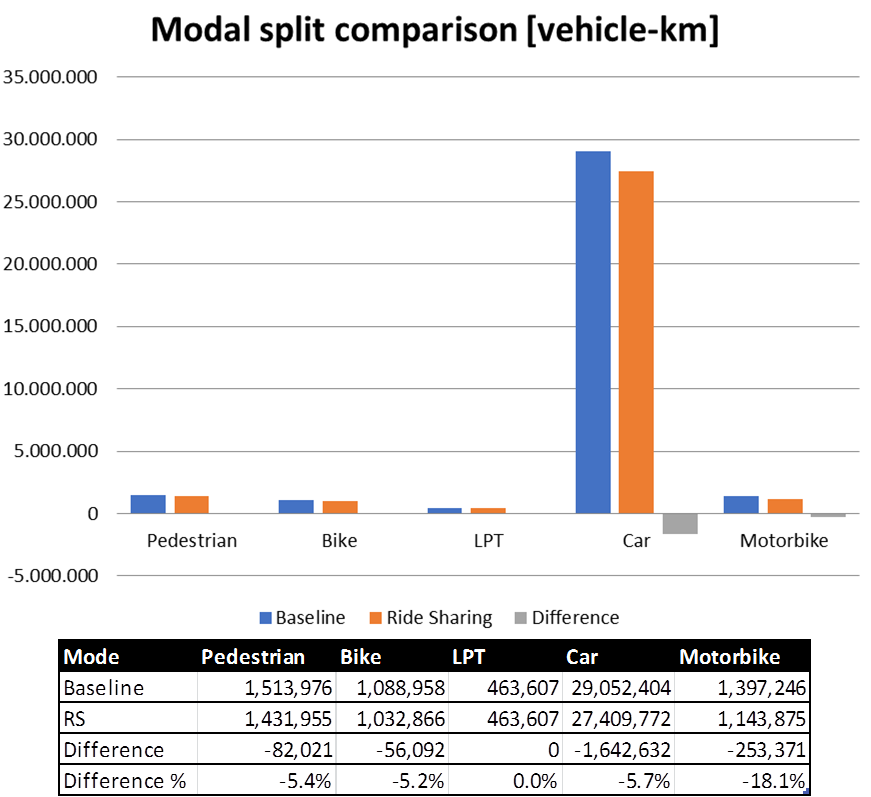
The changes in passengers transport and traffic flow with regards to the base case are reported in Figure 7 and Figure 8. Ride sharing and private car have been summed up in the “car” mode, since they use the same vehicle. It can be noticed that there is a general increase in the number of passengers using cars, with the same reduction in pedestrians, bike and LPT. The reduction is registered by motorbikes (-18.1%), that appear as more expensive than ride sharing.
Modal split comparison in passenger-km
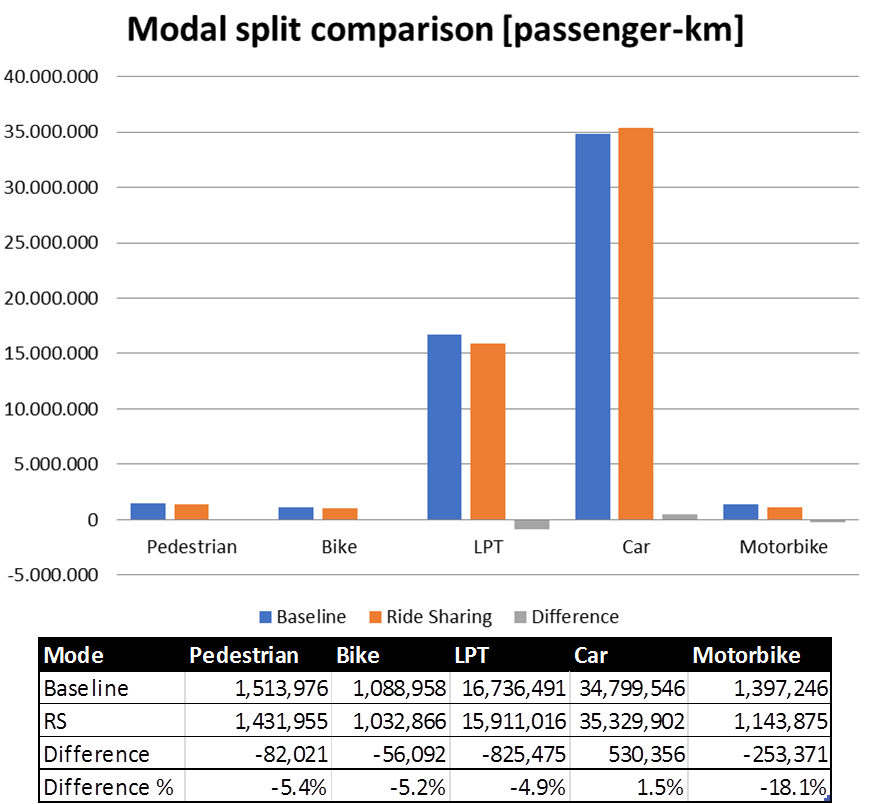
The increase in number of passengers travelling by car, that can seem contradictory with respect to the goal of RS adoption (that should be a reduction in greenhouse gas emissions) shall be however seen in the overall picture: in terms of number of vehicles, actually, there is a reduction of circulating cars of around 1.1 million vehicle-km, thanks to the increase of the average occupancy rate, for each car, from 1.2 to 1.3. Other positive impacts can be seen in Table 3and Table 4, regarding energy efficiency and environmental pollution.
Modal split comparison in vehicle-km
In terms of energy consumption the results are shown in Table 3 and Table 4.
Energy consumption comparison between baseline case and RS
|
MODE |
BASELINE |
RS |
Difference |
|||
|
[toe/y] |
% |
[toe/y] |
% |
[toe/y] |
% |
|
|
Traditional car |
555,866 |
77% |
524,600 |
77% |
-31,266 |
-6% |
|
LPG/Methane car |
45,171 |
6% |
42,600 |
6% |
-2,571 |
-6% |
|
Motorbike |
13,739 |
2% |
11,200 |
1% |
-2,539 |
-18% |
|
LPT Bus |
32,723 |
2% |
32,700 |
2% |
-23 |
0% |
|
LPT Subway |
24,994 |
2% |
25,600 |
2% |
606 |
2% |
|
LPT Tram |
4,452 |
0% |
4,500 |
0% |
48 |
1% |
|
LPT Trolleybus |
3,497 |
0% |
3,500 |
0% |
3 |
0% |
|
LPT Railway |
38,566 |
3% |
38,600 |
3% |
34 |
0% |
|
Electric car |
70 |
0% |
70 |
0% |
0 |
0% |
Fossil fuels and electricity consumption reduction comparison between baseline and RS
|
FUEL |
BASELINE |
RS |
Difference |
|||
|
[toe/y] |
% |
[toe/y] |
% |
[toe/y] |
% |
|
|
Fossil fuels |
647,498 |
90% |
611,200 |
90% |
-36,298 |
-6% |
|
Electricity |
71,578 |
10% |
71,600 |
10% |
22 |
0% |
|
Total |
719,077 |
100% |
682,700 |
100% |
-36,377 |
-5% |
Analysing the data, there is a slight increase in the consumption of LPT (subway and tram), while fossil fuelled cars overall reduce their consumption of 6% and motorbike of 18%, in line with the results of vehicle-km comparison. Considering fuels, there is a total reduction of 5%, with 6% reduction of fossil fuels use (36 ktoe/y) and a slight increase of electricity use (related to LPT), however lower than 1%.
From an environmental point of view, different pollutants were taken into account, with a focus on the change in emissions of PM10 (coarse particulate matter), PM2.5 (fine particulate matter), PMExhaust (particulate matter at exhaust discharge), EC (elemental carbon), OM (organic aerosol), NO (nitrogen oxide), NO2 (nitrogen dioxide), NMVOC (Non Methane Organic Volatile Compound), NH3 (ammonia), CO2 (carbon dioxide) and in FC (fuel consumption). The comparison between the results for baseline case and ride sharing is reported in Table 5.
Environmental impact (air pollutants) in RS case compared with baseline case
|
PM 10 |
PM 2.5 |
PM e |
EC |
OM |
NO |
NO 2 |
NMVOC |
SO 2 |
NH 3 |
CO 2 |
FC |
|
|
kg/d |
kg/d |
kg/d |
kg/d |
kg/d |
t/d |
kg/d |
t/d |
kg/d |
kg/d |
t/d |
t/d |
|
|
Base |
1275 |
976 |
644 |
479 |
137 |
12 |
5045 |
13 |
23 |
527 |
6478 |
2081 |
|
RS |
1208 |
925 |
612 |
455 |
131 |
11 |
4769 |
12 |
22 |
499 |
6115 |
1964 |
|
Diff% |
-5% |
-5% |
-5% |
-5% |
-4% |
-8% |
-5% |
-8% |
-4% |
-5% |
-6% |
-6% |
The fossil fuels consumption reduction of about 6% is reflected by the lower environmental impact of RS case, in which pollutant emissions are reduced in a range from 4% to 8%.
Costs of implementation of RS have been divided in two categories:
-
Investment costs, in order to build the online tools needed to support RS adoption;
-
Differential operation and maintenance costs (ΔOC), with regards to the baseline cases.
-
Lower income from LPT;
-
Positive income from RS management;
-
Positive income from parking payment;
-
Positive income from the fares of restricted traffic areas (RTA).
In particular, operation and maintenance costs for Milan public administration include:
Costs data have been derived from different sources: the already mentioned investigation [2], Milan SUMP [31], public documents, such as newspapers and magazine articles [37] and [38], and Milan LPT company financial statement [39]. The results are reported in Table 6.
Economics of the adoption of ride sharing
|
Type of cost |
Value |
|
|
Investment costs [M€] |
10 |
|
|
ΔOC [M€/y] |
37.8 |
|
|
Of which: |
LPT lost income |
69.6 |
|
RS management |
-21 |
|
|
Parking payment |
-10.3 |
|
|
RTA access |
-0.5 |
|
In order to evaluate the long-term financial impact of the adoption of RS, it has been assumed a loan to be refunded in 30 years, with an interest rate of 3%, as illustrated in the Methodology.
The financial results are:
-
Yearly instalment: 0.35 M€/y;
-
O and M costs: 37.8 M€/y;
-
Total costs: 38.15 M€/y.
Ride Sharing represents a valuable alternative to traditional transport modes. However, in order to understand its impact, a clear methodology shall be defined and applied.
In order to build the offer of mobility, several parameters shall be taken into account:
-
The road network;
-
The LPT offer;
-
The bike and pedestrian routes;
-
The integration of road and LPT with other (non-urban) network, such as trains, ferries (for coastal and river cities) and others;
-
The crossing points of all these networks.
However, this is usually done on standard data, available from several sources. The most difficult part is to build a reliable demand model, that takes into account the real situation of the considered area. For this work, the demand was built using a survey performed on a statistically-representative sample of the population, where questions like their usual weekly mobility habits were asked. However, the collection of such data, presents some barriers, such as costs, time, willingness to respond. Useful information can be found with other sources such as:
-
Mobile phone data (considering the telephone cells where they are connected and their change during the day);
-
GPS data from mobile phone apps;
-
Ticket and subscription data from LPT providers (however this excludes pedestrians, bikes and private vehicles).
The choice of one or the other transport mode is driven by comfort parameters that take into account both time (travel time, parking searching time, pedestrian time) and costs (cost per passenger-km of private car, ticket fares, parking fare, traffic pollution charge)
The main output parameters to be monitored address sustainability in different forms: not only as environmental and cost impacts, but also in terms of traffic flow, using parameters such as passenger-km or vehicle-km of the different transport modes.
When a baseline case has been modelled, several scenarios can be built onto it. In this case, only RS scenario was presented, but many others were simulated both in terms of policies (e.g. changing LPT fares, incentivise the acquisition of a less-consuming or electric car, etc.) and infrastructure (e.g. enlargement of the subway network, enhancement of the electric network to accommodate for more tramways, etc.).
Ride Sharing, in the presented form (with private cars, not pre-programmed, low-cost, etc.) represents a valuable and still under-estimated option to increase transport sustainability in urban areas. In particular, from the presented study it emerges that, also with “expected” subscription rates, the impacts are quite positive in terms of reduction of circulating private cars and motorbikes (or, better, increase in occupancy rate of private cars), with a consequent saving in terms of fossil fuels consumption and Greenhouse Gases (GHGs) and particulate emissions.
From the above results, compared also with previous works on RS, it is possible to draw the following recommendations, for a policy maker that would like to implement RS in large cities.
-
Safety and privacy:
-
both riders and drivers shall be registered to the app through a verified account;
-
at the start and the end of the ride, the provider shall record the identity of each person on-board the car, through the mobile phone data;
-
at the end of the ride, riders and driver shall give a score to the trip companions;
-
before the ride, rider and driver shall receive each other’s picture and score, in order to recognize each other and evaluate whether to accept or not the match;
-
there shall be the possibility to set some filters (e.g. women can choose to exclude men riders or drivers);
-
the app shall include an emergency button that is directly connected to the police.
-
Economics:
-
the cost of the service shall be assumed equal to a standard recognized fee/km, e.g. 0.25€/km ([26]), divided by the number of passengers, in order not to generate a source of income for riders;
-
costs for riders might include access to RTAs or parking payments, depending on the ride;
-
there shall not be cash exchange on-board the vehicle, everything shall be managed through the app that, at the end of each month, calculates the due amount for the riders and the revenue for the drivers, that is the total amount of the performed rides, cut of a % related to the commission for the provider (e.g. 10%).
-
Ride sharing process:
-
riders and drivers insert in the app their origin, destination, departure time, number of passengers and time tolerance. The app shall match them automatically and, once the ride is approved on both sides, rider and driver shall meet in the agreed place at the agreed time;
-
the time to agree or disagree on a match shall be limited to maximum few minutes;
-
it shall possible to refuse, for the same trip request, two matches; if a third is refused, the request is automatically deleted;
-
it shall not be possible to modify the origin and destination once the ride has been approved, unless by contacting the provider.
-
for safety reasons, meeting point shall be in places that guarantee the rider to get-in and get-out easily, such as parking spots or public transport stops.
Ride sharing represents an interesting opportunity for the reduction of traffic load in big cities. In particular, by simulating a RS service for Milan Metropolitan Area, it is possible to export the methodology both to similar contexts (cities with around 2 million inhabitants, with a high load of commuters) and to smaller areas. The methodology has been successfully applied, for example, to the case of Parma, that is representative of a medium-size city in Northern and Central Italy, and a comparative analysis with the results of MMA is ongoing.
Even if it might seem to generate a rebound effect, in terms of passenger-km that are switching from other modes to the use of cars, the overall result is positive in terms of reduction of circulating vehicles (especially cars and motorbikes), due to an increase in vehicle-km, fuel and energy savings and CO2, PM2.5 and other pollutants emission reduction.
The cost to adopt a RS system is high, but, as a further development, it can be compared, in terms of specific costs related to environmental and energy parameters, with the costs of adoption of other transport solutions (e.g. increasing LPT services, increasing car sharing services, etc.). In particular, it can become an interesting option when a minimum threshold of subscribers is reached, in order to guarantee higher average occupancy rates of cars and reduce significantly the number of circulating vehicles.
The presented model is built using survey data on the population. A further development, that is being investigated at the moment, is to re-build the O/D matrix with the use of mobile-phone data, in order to evaluate whether the model is reflecting the current situation and provide a further validation.
|
Abbreviations |
|
|
AC |
Annual Cost |
|
GHG |
Greenhouse Gases |
|
LPG |
Liquefied petroleum gases |
|
LPT |
Local Public Transport |
|
MMA |
Milan Metropolitan Area |
|
O/D |
Origin/Destination |
|
PMx |
Particulate Matter |
|
RS |
Ride Sharing |
|
RTA |
Restricted Traffic Area |
|
SUMP |
Sustainable Urban Mobility Plan (PUMS in Italian) |
- The environmental and social costs of mobility in Italy – fifth report (in Italian) , 2005
- Investigation on the people’s mobility in Milan Metropolitan Area (2005/2006) (in Italian) , 2007
- ,
A methodology for the assessment of ridesharing program benefits and impacts ,Socio-Economic Planning Sciences , Vol. 18 (4), 1984, https://doi.org/10.1016/0038-0121(84)90004-1 - ,
Ridesharing in great Britain: Performance and impact of the Yorkshare schemes ,Transportation Research Part A: General , Vol. 17 (3), 1983, https://doi.org/10.1016/0191-2607(83)90039-0 - ,
Planning and analysis of a ridesharing evaluation study ,Socio-Economic Planning Sciences , Vol. 19 (1), 1985, https://doi.org/10.1016/0038-0121(85)90026-6 - ,
Seattle smart traveler: dynamic ridematching on the World Wide Web ,Transportation Research Part C: Emerging Technologies , Vol. 7 (1), 1999, https://doi.org/10.1016/S0968-090X(99)00007-8 - Website, , https://www.blablacar.it/, [Accessed: 10.4.2019]
- Website, , https://www.uber.com/, [Accessed: 10.4.2019]
- ,
Ride-sharing service planning based on smartcard data: An exploratory study ,Transport Policy , Vol. 79 , 2019, https://doi.org/10.1016/j.tranpol.2019.04.009 - ,
Sustainable Passenger Transportation: Dynamic Ride sharing ,ERIM Report Series Research in Management ERS-2010-010-LIS , 2010 - ,
Real-time ride-sharing framework with dynamic timeframe and anticipation-based migration ,European Journal of Operational Research , Vol. 288 (3), 2021, https://doi.org/10.1016/j.ejor.2020.06.038 - ,
Ride-sharing under travel time uncertainty: Robust optimization and clustering approaches ,Computers and Industrial Engineering , Vol. 149 , 2020, https://doi.org/10.1016/j.cie.2020.106601 - ,
Exact matching of attractive shared rides (ExMAS) for system-wide strategic evaluations ,Transportation Research Part B: Methodological , Vol. 139 , 2020, https://doi.org/10.1016/j.trb.2020.06.006 - ,
A Smart Real-time Ride-share for Riyadh City ,Procedia - Social and Behavioral Sciences , Vol. 195 , 2015, https://doi.org/10.1016/j.sbspro.2015.06.205 - ,
Environmental benefits from ridesharing: A case of Beijing ,Applied Energy , Vol. 191 , 2017, https://doi.org/10.1016/j.apenergy.2017.01.052 - ,
Appraising the environmental benefits of ride-sharing: The Paris region case study ,Journal of Cleaner Production , Vol. 177 , 2018, https://doi.org/10.1016/j.jclepro.2017.12.186 - ,
Estimating the environmental benefits of ride-sharing: A case study of Dublin ,Transportation Research Part D: Transport and Environment , Vol. 14 (7), 2009, https://doi.org/10.1016/j.trd.2009.07.008 - ,
On-demand Shared Ride-hailing for Commuting Purposes: Comparison of Barcelona and Hanover Case Studies ,Transportation Research Procedia , Vol. 47 , 2020, https://doi.org/10.1016/j.trpro.2020.03.105 - ,
Dynamic Ride Sharing Service: Are Users Ready to Adopt it? ,Procedia Manufacturing , Vol. 3 , 2015, https://doi.org/10.1016/j.promfg.2015.07.329 - ,
Investigating ride sharing opportunities through mobility data analysis ,Pervasive and Mobile Computing , Vol. 14 , 2014, https://doi.org/10.1016/j.pmcj.2014.05.010 - Second national report on Sharing Mobility (in Italian) , 2017
- ,
The sustainability of shared mobility: Can a platform for shared rides reduce motorized traffic in cities? ,Transportation Research Part C: Emerging Technologies , Vol. 117 , 2020, https://doi.org/10.1016/j.trc.2020.102707 - ,
Mobile phone GPS data in urban ride-sharing: An assessment method for emission reduction potential ,Applied Energy , Vol. 269 , 2020, https://doi.org/10.1016/j.apenergy.2020.115038 - ,
Dynamic ride-sharing: A simulation study in metro Atlanta ,Transportation Research Part B: Methodological , Vol. 45 (9), 2011, https://doi.org/10.1016/j.trb.2011.05.017 - VISUM software, , http://vision-traffic.ptvgroup.com/en-us/products/ptv-visum/, [Accessed: 31.3.2018]
- Costs per travelled km by car, , http://www.aci.it/i-servizi/servizi-online/costi-chilometrici.html, [Accessed: 15.3.2019]
- Ticket fares, , https://www.atm.it/it/ViaggiaConNoi/Biglietti/Pagine/Tipologie.aspx, [Accessed: 28.3.2019]
- , COPERT,
- National Car Fleet (in Italian) , 2012
- , ENERGY EFFICIENCY SOLUTIONS FOR SUSTAINABLE URBAN MOBILITY: CASE STUDY OF THE MILAN METROPOLITAN AREA, 2018
- , Sustainable Urban Mobility Plan (in Italian), 2019
- Natural Gas and Electricity prices, , https://www.arera.it/it/prezzi.htm, [Accessed: 20.3.2019]
- Analisi e Statistiche energetiche, , https://dgsaie.mise.gov.it/, [Accessed: 15.3.2019]
- Natural gas statistics, , http://www.unionepetrolifera.it/?page_id=480, [Accessed: 20.3.2019]
- Update of the Handbook on External Costs of Transport - Transport and Environmental Policy Research, Vol. 1 , 2014
- Damages per tonne emission of PM2.5, NH3, SO2, NOX, and VOCs from each EU25 Member State (Excluding Cyprus) and surrounding seas, AEA Technology Environment ,Vol. 1 , 2005
- , Milano, incassi record per Area C: nel 2016 quasi trenta milioni dai pedaggi, La Repubblica Newspaper, 2017
- , Area C, ricavi record (e inaspettati) nel 2016, Milano Today, 2017
- Financial statement - 2015, 2016, https://www.atm.it/it/IlGruppo/ComeLavoriamo/Pagine/BilancioATMServiziSpA.aspx, [Accessed: 15.3.2019]


