


The enormous amount of waste heat which is released from industry often has a high potential to be transformed into mechanical work using one of the conventional or unconventional technologies. Some of the promising new technologies which are still under development and are usually considered for waste heat recovery are thermoelectric generators, phase change materials, Organic Rankine Cycles (ORC), Kalina cycles and trilateral flash cycles [1].
Thermoelectric generators make use of the Seebeck effect to generate electric energy [2]. Waste heat is applied to generate temperature gradient over the conductor, which further generates voltage difference. Although the efficiency does not exceed 10% [3], these generators distinguish their compactness and reliability, since they have no moving parts, as well as their operation has almost no environmental impact [4]. The maximal operation temperature of commercially available thermoelectric generators is 250 °C [5].
Paraffin mixtures are applied as phase change material, and mechanical work is utilised in a generator during the phase change from liquid to solid, and vice versa. The efficiency of this kind of electricity generation, which is still under laboratory testing, is well below 10% [1].
Organic working fluid is applied instead of water in the ORC. This way, the evaporation conditions of working fluid matches the temperature of the waste heat source better, which guarantees high flexibility and thermal efficiency of the ORC, thus, its applications have increased significantly in recent years [6].
Even better waste heat source temperature adaptation is possible when a mixture of two working fluids having different boiling temperatures is applied, such as in the Kalina cycle [7], which extracts source heat efficiently and is favourable at low temperature conditions [8].
Trilateral flash cycles use single working fluid. When boiling working fluid at high pressure, a flash expands, a vapour mixture is formed, which enters a separator. Here, the saturated vapour is produced, which can perform mechanical work when expanding in a turbine [9]. Flash expansion reduces thermal efficiency, which is, therefore, lower than in the case of an ORC working within the same temperature interval [10]. According to Yari et al. [9] trilateral flash cycles are still under technical development.
A short overview of possible technologies for mechanical work or direct electrical energy recovery from waste heat, shows that ORC and the Kalina cycle have the highest potential at the moment. When both are compared under the same operating conditions, it may be stated that ORC is more compact and exhibits higher thermal efficiency [11], while the Kalina cycle generates up to 3% higher power output [12], however, it is much more complex and demands higher investment costs [13]. Moreover, the applied heat exchangers have to be larger and corrosion resistant [14].
At the moment, ORC is the most promising and applied power plant technology for waste heat utilisation. Its commercial application exists in the electric power range from 20 kW eto 20 MWe. One of the most common applications is utilisation of geothermal energy. Here, the ORC may replace a standard flash cycle, or may even be applied as its bottom cycle to utilise the exhaust condensate from the separator of the flash unit [15]. Besides, ORC may be found widespread in other energy sectors too. Villarini et al. [16] investigated ORC application within a solar driven triregenerative system. Solar energy stored in a heat storage tank drove an ORC, while heat rejected from the ORC was applied within heat supply system, or to produce chill in an absorption chiller. Application of ORC within a wood drying plant fuelled with sawmill biomass is presented in Borsukiewicz-Gozdur et al. [17]. The authors have shown that the application of organic working fluids instead of water increased the system flexibility, and resulted higher electric power output and higher drying air temperature. ORC based waste heat utilisation in Combined Heat and Power (CHP) plants was shown by Qiu [18], who studied the application of different working fluids. He presents the comparison and optimisation of 8 mostly applied working fluids nowadays, and gives a preferable ranking. Furthermore, ORC can be efficient as a bottoming cycle in combined cycle power plants, as reported in Katulić et al. [19]. The authors carried out an exergoeconomic optimisation of a bottoming cycle where, instead of water, selected organic fluids were used in the lower pressure levels of the heat recovery steam generator. Their study proved that it is economically justified to use selected organic fluids instead of water in the lower pressure level of a combined-cycle power plants bottoming cycle. ORC application for waste heat recovery from cars and trucks is considered in the Automotive industry [20], while it also has high potential for waste heat recovery in heat intensive industries. Ustaoglu et al. [21] showed the efficiency increase of the wet rotary kiln process in the Cement industry by the utilisation of waste heat with ORC. Similarly, Campana et al. [22] found application of ORC effective for waste heat recovery in the Glass, Steel and Crude Oil industries. Walsh and Thornley [23] focused on coke ovens used in the Steel industry, and proposed an ORC based utilisation of low temperature heat from coke oven exhaust. They showed that the potential savings due to on-site electricity generation suggested a payback period of less than 4 years. Varga and Csaba [24] suggested ORC for low temperature waste heat recovery in crude oil processing as an effective technology for additional energy efficiency increasing and improvement of refinery competitiveness. Therefore, ORC may be of interest for possible investors in the Energy sector who, however, would need a quick answer as to whether their investment is going to be economically efficient or not. A simple decision model was, therefore, developed, which can be used to check the technical feasibility and economic viability of an ORC system, and to select the appropriate working fluid, based only on basic information on the waste heat source, i.e., source temperature and mass (heat) flow rate. No complex thermodynamic ORC model was integrated into the decision model, although, correlation was applied instead, in order to keep the model simple and highly applicable.
An ORC thermodynamic model was built in order to develop design correlations for simple and quick estimation of ORC operational parameters and component design. The ORC system layout is presented in Figure 1. Exhaust gases carrying waste heat flow through the set of heat exchangers (SH, EV and PH), and reject their heat to the working fluid. Exhaust gases are released to the atmosphere at approximately 120 °C, which is set as the lower limit, in order to avoid any water condensation within the exhaust. The produced live vapour expands in the turbine and then enters the regenerator, where the exhausted vapour rejects heat to the vapour cooler integrated within the water cooled condenser, where it finally condenses. The condensate is then pumped to working pressure and directed through the set of heat exchangers to produce live vapour. The condenser is cooled by cooling water. The latter is supplied by the cooling tower, where the final heat transfer to the surroundings takes place.
ORC system schematic and T-s diagram
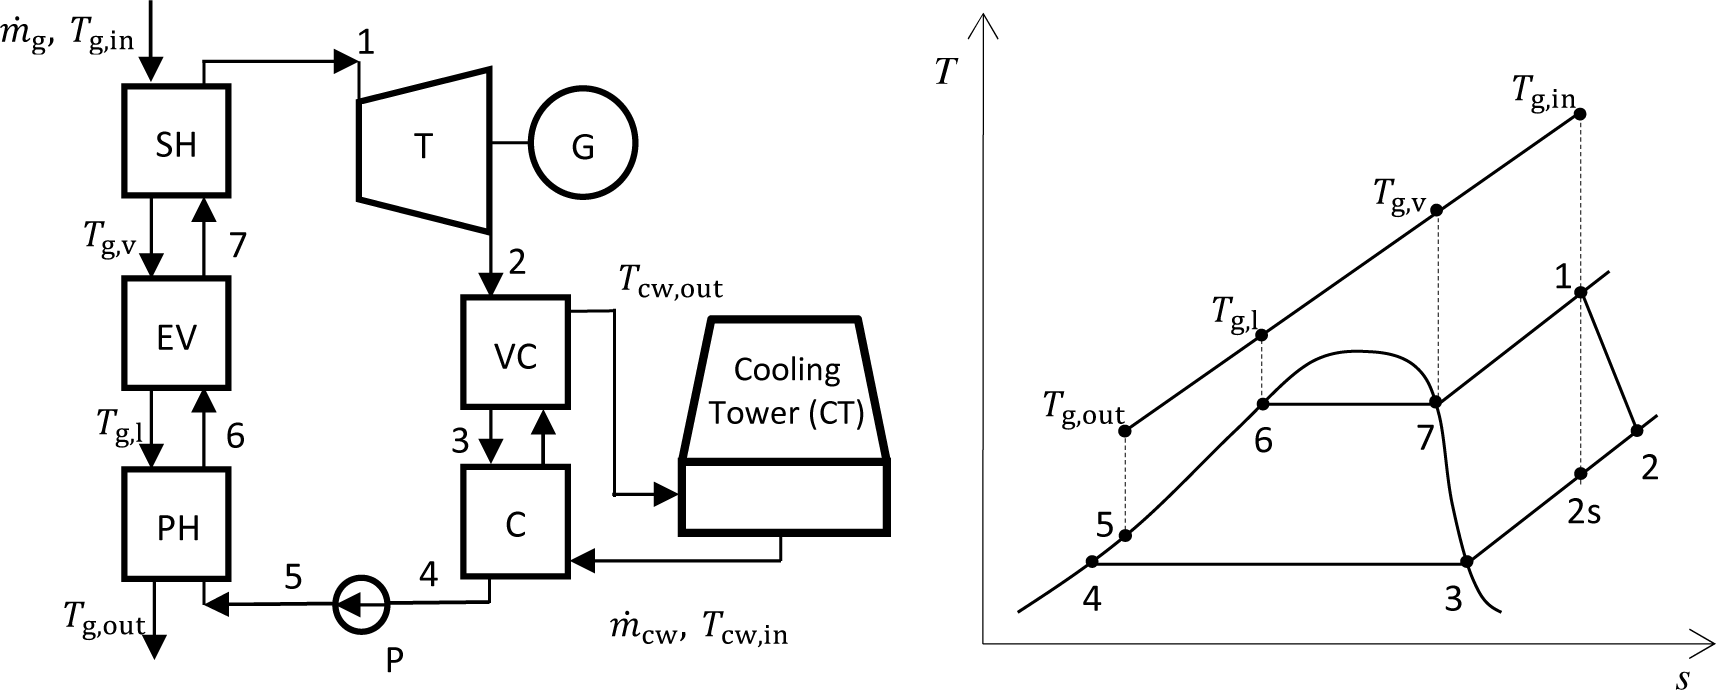
ORC operational points are calculated using a simple ORC model written in Excel, with the REFPROP database [25] applied as an Excel Add-in. The live vapour pressure and temperature (p1 and T1) and condensation temperature T3 = T4 = TC are set as input data. Any other thermodynamic state is predicted by the model, as well as calculating turbine and pump specific work. The specific heat transferred to the working fluid in a super-heater, evaporator and preheater, and the specific rejected heat in the vapour cooler and condenser are also estimated by the ORC thermodynamic model.
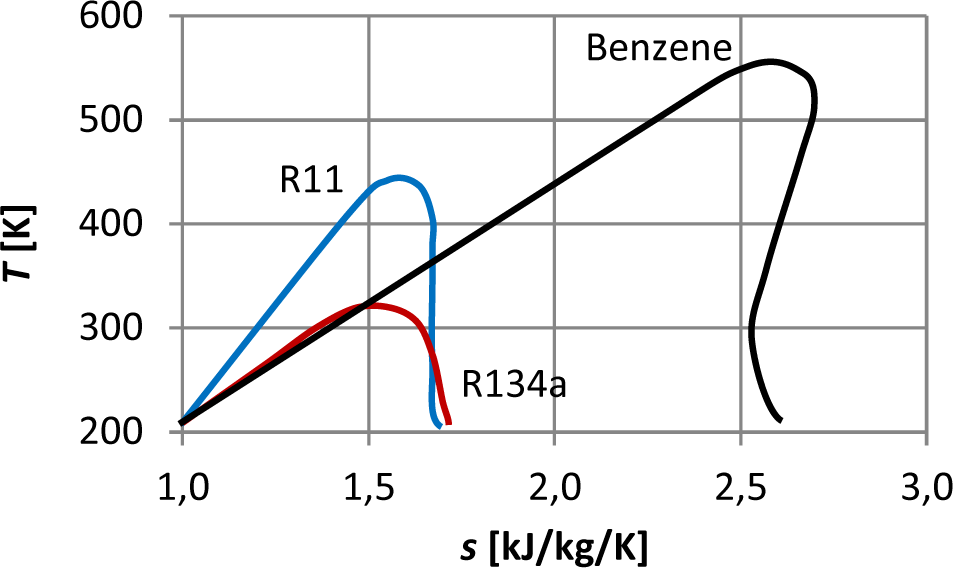
Different organic fluids with different thermodynamic characteristics may be used in the ORC. Figure 2 shows characteristic shapes of the working fluid saturation line in a T-s diagram, which depends on the complexity of the fluid molecular structure. Three fluids: Benzene with overhanging, R11 with isentropic and R134a with bell shaped saturation line which are commonly adopted for technical applications [26], were chosen to be applied as possible working fluids, although the future work would lead to considering other pure fluids [27] or their mixtures [28]. The basic physical properties of the selected organic working fluids are given in Table 1. R11 is a chlorofluorocarbon with the highest Ozone Depletion Potential (ODP = 1), and it is not in use anymore. Since 1990 it has been replaced widely by R123. However, R11 was applied in a study as a representative of refrigerants with an isentropic saturation line. It should also be noted that R134a has high global warming potential, thus, it is currently being replaced by R1234yf.
ORC working fluid T-s diagram
Physical data of selected working fluids [29]
Working fluid |
Molecular weight [kg/kmol] |
Boiling point [°C] |
Tcritical [°C] |
pcritical [MPa] |
|---|---|---|---|---|
R134a |
102.03 |
−26.07 |
101.00 |
4.055 |
R11 |
137.37 |
23.71 |
197.96 |
4.408 |
Benzene |
78.01 |
80.10 |
289.90 |
4.894 |
The choice of working fluid is dictated by the temperature range of the applied heat source, as well as by the screening criteria, which are also important to working fluid selection [30]. The screening criterion used is Payback Period (PBP) and not the systems efficiency, which may demand too high an investment cost and may deteriorate economic viability, usually the most important issue for the investor.
Selection of optimal live vapour and condenser parameters of an ORC is not an easy task. According to Vaja and Gambarotta [31], the maximal global system efficiency defined as the ratio of generator power and available waste heat rate does not always coincide with the maximal cycle efficiency. Thus, they performed an optimization and found appropriate live vapour and condenser parameters for all three working fluids. These, were a little modified and applied in the present model. The list of selected live vapour parameters and condenser temperature for each of the three working fluids is given in Table 2. Although the benzene has the highest critical pressure, the chosen evaporator pressure is very low comparing to other two fluids, in order to reduce its very high specific volume ratio (v2/v1), which increases turbine outlet flow area enormously as well as its cost. Superheating of working fluids R134a and R11 is selected in order to avoid any possibility of wet expansion in turbine. This is not necessary for benzene due to its overhanging shape of saturation line. Condenser temperature was set to 40 °C in all three cases in order to allow high enough pinch point temperature difference (∆Tpinch = 5 °C) of condenser and cooling tower heat exchanger.
Selected live vapour and condenser parameters for each individual working fluid
Working fluid |
Evaporator pressure p1 = p5 [MPa] |
Final temperature T1 [°C] |
Condenser temperature T3 = T4 [°C] |
|---|---|---|---|
R134a |
3.7234 |
105** |
40 |
R11 |
3.8359 |
197** |
40 |
Benzene |
2.0000 |
221.4* |
40 |
** Superheated cycle
* Saturated cycle
An Excel based thermodynamic ORC model with the REFPROP database [25], applied as an Excel Add-in presented in the previous paragraphs, was used to calculate any unknown ORC operational point, as well as turbine and pump specific work and specific heat transferred to the working fluid or rejected to the souroundings. The live vapour pressure and temperature (p1 and T1) and condensation temperature (T3 = T4 = TC) presented in Table 2 for the three proposed working fluids were set as input data. The predicted thermodynamic states and specific operating parameters are presented in Table 3 and Table 4, respectively, for all three working fluids. The highest thermal efficiency is obtained when benzene is used as the working fluid, although the live vapour pressure was substantially reduced and saturated cycle was applied. However, the specific volume ratio v2/v1 is still very high. It is almost 20 times higher than that of R134a, which has the lowest thermal efficiency. From the efficiency point of view, the benzene is a superior working fluid, however, its high v2/v1 ratio can deteriorate economic viability due to high turbine cost. Its weakness is also the high evaporation temperature, which is inconvenient regarding application of low temperature waste heat sources. The lower source temperature limit (Tg,in,min) when using benzene is 340 °C and only 135 °C when R134a is used.
ORC thermodynamic states for different working fluids
|
Working fluid |
||||||||
|---|---|---|---|---|---|---|---|---|---|
R134a |
R11 |
Benzene |
|||||||
State |
p [MPa] |
T [°C] |
v [m3/kg] |
p[MPa] |
T [°C] |
v [m3/kg] |
p[MPa] |
T [°C] |
v [m3/kg] |
1 |
3.723 |
105.0 |
4.599E-03 |
3.836 |
197.0 |
4.172E-03 |
2.000 |
221.4 |
1.904E-02 |
2 |
1.017 |
46.2 |
2.084E-02 |
0.174 |
69.1 |
1.142E-01 |
0.024 |
111.8 |
1.670E+00 |
3 |
1.017 |
40.0 |
1.997E-02 |
0.174 |
40.0 |
1.029E-01 |
0.024 |
40.0 |
1.351E+00 |
4 |
1.017 |
40.0 |
8.720E-04 |
0.174 |
40.0 |
6.945E-04 |
0.024 |
40.0 |
1.166E-03 |
5 |
3.723 |
42.2 |
8.632E-04 |
3.836 |
42.2 |
6.916E-04 |
2.000 |
40.8 |
1.165E-03 |
6 |
3.723 |
96.8 |
1.349E-03 |
3.836 |
188.4 |
1.191E-03 |
2.000 |
221.4 |
1.612E-03 |
7 |
3.723 |
96.8 |
3.414E-03 |
3.836 |
188.4 |
3.429E-03 |
2.000 |
221.4 |
1.904E-02 |
In order to predict the ORC generator power and estimate possible electricity production, the ORC net specific work has to be multiplied by the working fluid mass flow rate (ṁwf). The latter is predicted as:
(1)
where ṁg is the exhaust gas flow rate, Tg,in is the inflow exhaust gas temperature, Tg,out is the outflow exhaust gas temperature, cp,g is specific heat of exhaust gases and h1 and h5 is the working fluid enthalpy in states 1 and 5, respectively.
Specific operating parameters of ORC for different working fluids
|
Working fluid |
||
|---|---|---|---|
Parameter |
R134a |
R11 |
Benzene |
ηt [%] |
7.80 |
16.05 |
19.23 |
wT [kJ/kg] |
17.315 |
40.149 |
125.063 |
wP [kJ/kg] |
2.933 |
3.170 |
2.877 |
qPH [kJ/kg] |
101.1 |
157.4 |
380.9 |
qE [kJ/kg] |
57.3 |
57.7 |
254.4 |
qSH [kJ/kg] |
25.9 |
15.4 |
0.0 |
qVC [kJ/kg] |
6.9 |
18.3 |
90.3 |
qC [kJ/kg] |
163.1 |
175.2 |
422.8 |
qrej [kJ/kg] |
170.0 |
193.5 |
513.1 |
v2/v1 [-] |
4.53 |
27.4 |
87.7 |
Tg,in,min [°C] |
135 |
265 |
340 |
With known ṁwf, the exhaust gas temperature at the evaporator inlet (Tg,v) and preheater inlet (Tg,l) are simple to obtain from the energy conservation equations of both heat exchangers. They are needed to estimate evaporator and preheater effective heat transfer area.
Once all the temperatures and mass flow rates are known, it is possible to estimate the basic design of ORC components like heat exchangers, pump and turbine. The plate type heat exchangers are applied due to their compactness and high effectiveness [32], which result in less heat transfer area than that when using shell and tube heat exchangers. The heat transfer area is of main importance, since it dictates the cost of the heat exchanger which is used in the economic evaluation of the system. The effective heat transfer area of any heat exchanger may be estimated by:
(2)
where is the heat flow rate, Ui is the overall heat transfer coefficient, and ∆TLM,i is the logarithmic mean temperature difference.
Heat flow rate is a product of working fluid mass flow rate and specific heat transferred by the individual heat exchanger specified in Table 4. Overall heat transfer coefficient (U ) may be calculated by considering two convective heat transfer resistances in series (working fluid and secondary fluid sides):
(3)
When a plate heat exchanger is designed an optimisation is performed to find an optimal combination of number and dimensions (length and width) of plates, which results high heat transfer at both sides of the plate with as low a pressure drop as possible. This is possible only when an actual heat exchanger with known heat flow rate and characteristic temperatures is designed. A general approach which may estimate the optimal heat exchanger design within a broad interval of design conditions as applies in the case of the present decision-making tool is, therefore, almost impossible. A simplified approach was, therefore, used, and an achievable constant overall heat transfer coefficient was applied. A similar approach may be found in van de Bor and Infante Ferreira [33], where the overall heat transfer coefficient within heat pumps operating with R134a, R11, propane and butane was set to 1,200 W/m2/K. In the present study, U = 1,200 W/m2/K was used in the evaporator and condenser where the phase transformation from liquid to vapour and vice versa takes place, U = 400 W/m2/K was used to design all other heat exchangers. Logarithmic mean temperature difference is defined by:
(4)
where suffixes h and c are used for hot and cold media, respectively. Thus, any logarithmic mean temperature can be calculated using the characteristic system temperatures specified in Table 3.
The cooling tower is a forced convection type and consists of a plate type water to air heat exchanger and an axial fan forcing the ambient air through the heat exchanger. A cheaper brazed plate heat exchanger was applied due to the noncorrosive operational environment. The air flow rate depends on its temperature variation, and can be predicted from:
(5)
It was assumed that ∆Tair = 10 °C. Eq. (2) was applied to estimate the effective heat transfer area of the cooling tower heat exchanger. U = 400 W/m2/K was used and Tambient = 25 °C was applied for the logarithmic mean temperature prediction.
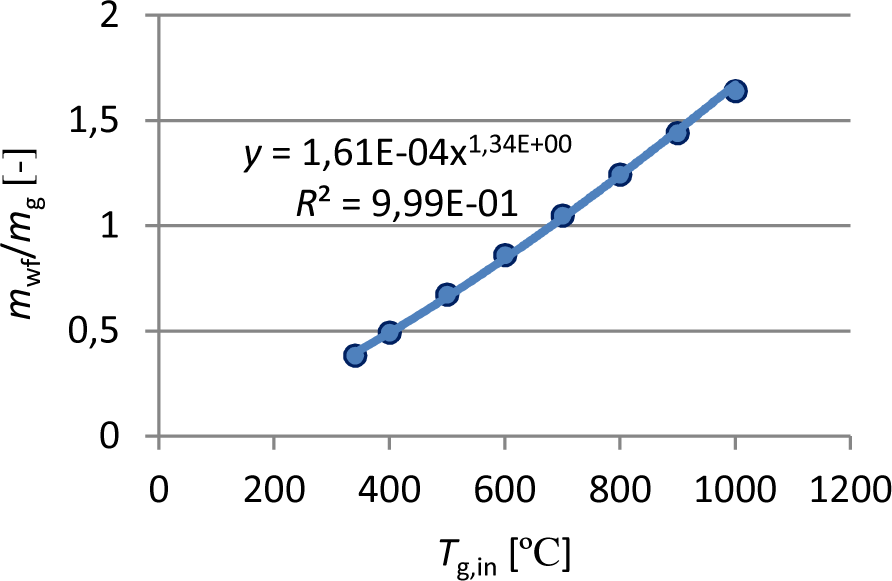
For the sake of simplicity, a simple correlation was developed which estimates the specific effective heat transfer area of any heat exchanger applied in the ORC system. According to eq. (1), the working fluid mass flow rate ṁwf is proportional to ṁg and temperature difference (Tg,in − Tg,out). Figure 3 shows its variation with Tg,in for benzene. Since Tg,out is set constant (Tg,out = 120 °C), a simple interpolation function in the form:
(6)
Expression can be used to predict the mass flow rate ratio for any Tg,in. Constants C1,m and C2 are specified in Table 5 for all three working fluids. The approximation accuracy for any of the three fluids is within ±2%.
Similarly, any heat exchanger specific effective heat transfer area is estimated as:
(7)
where C1,i and C2,i are constants specified in Table 5. Figure 4 shows an example of eq. (7) application when benzene is used as the working fluid.
Variation of working fluid mass flow rate with Tg,in for benzene
Correlation constants C1,i and C2,i applied in the ORC design correlations
|
Working fluid |
||
|---|---|---|---|
Correlation constants |
R134a |
R11 |
Benzene |
C1,m [-] |
2.83976E-05 |
3.02988E-04 |
1.60759E-04 |
C2 [-] |
1.80852E+00 |
1.39663E+00 |
1.33893E+00 |
Heat rejection side including cooling tower |
|||
C1,C [m2/(kg/s)] |
4.30768E-04 |
5.04888E-03 |
6.69357E-03 |
C1,VC [m2/(kg/s)] |
6.55131E-05 |
9.31190E-04 |
1.40392E-03 |
C1,CT [m2/(kg/s)] |
6.58207E-03 |
6.01915E-02 |
6.64542E-02 |
C1,CT,air flow [kgair/s/(kg/s)] |
2.75845 |
3.04764E+01 |
3.77168E+01 |
C2 [-] |
1.80852E+00 |
1.39663E+00 |
1.33893E+00 |
Heat supply side |
|||
C1,PH [m2/(kg/s)] |
4.116 |
6.246 |
6.769 |
C1,E [m2/(kg/s)] |
0.382 |
0.416 |
0.743 |
C1,SH [m2/(kg/s)] |
0.402 |
0.278 |
0 |
C2 [-] |
0 |
0 |
0 |
Variation of specific heat exchange area (AHE,i/ṁg) with Tg,in for benzene
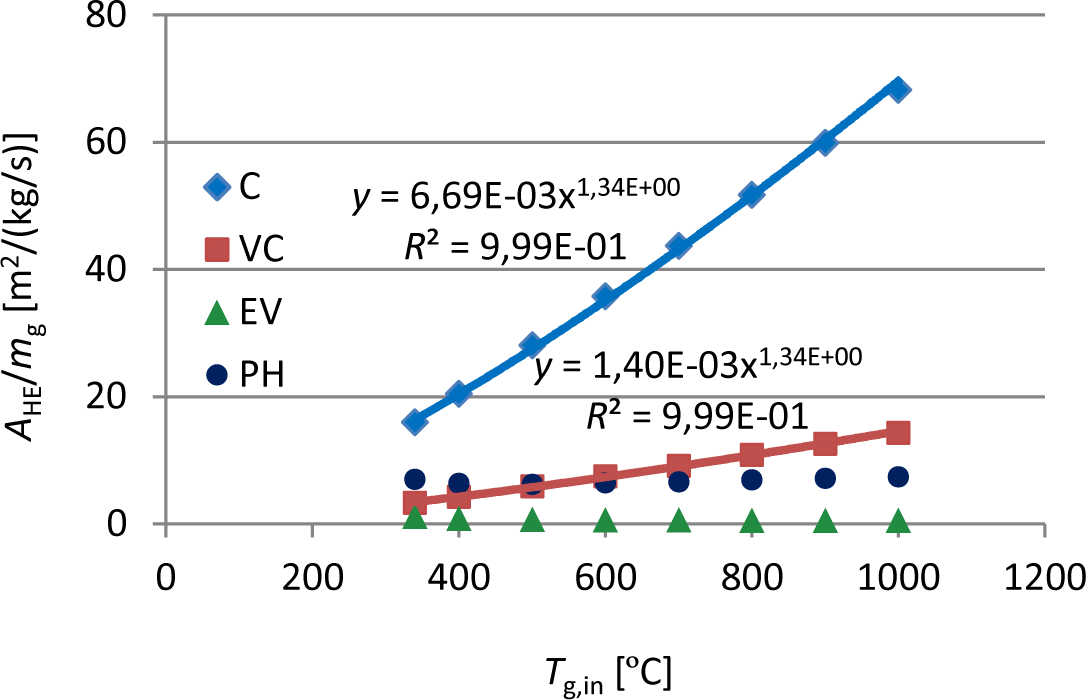
This simplification is possible, since the effective heat transfer area of any heat exchanger depends on the exhaust gas temperature and working fluid mass flow rate, and, as the latter depends on the exhaust gas flow rate and temperature, the same has to apply for the effective heat transfer area too. As can be seen from Table 5, the specific effective heat transfer area of the condenser, vapour cooler and cooling tower increases with the exhaust gas temperature (C2,i > 0), while, on the other hand, the specific effective heat transfer area of the preheater, evaporator and super-heater is constant (C2,i = 0). The explanation is very simple. Working fluid flow rate, as well as the thermal power of any heat exchanger increase with the exhaust gas temperature. The logarithmic mean temperature difference at the heat rejection side of an ORC does not change, thus, the heat transfer area increases proportionally to the thermal power (working fluid flow rate). At the heat supply side of the ORC, the logarithmic mean temperature difference increases with the exhaust gas temperature and compensates the need for an additional heat transfer area, thus, the latter remains almost unchanged (Figure 4).
Eq. (6) and eq. (7) apply for the cooling tower too. The cooling air mass flow rate passing through the cooling tower may be predicted by eq. (6), while eq. (7) estimates its heat exchanger effective heat transfer area. Corresponding constants are given in Table 5.
Pump and turbine design parameters necessary to estimate component cost are volumetric flow rate at pump entry and volumetric flow rate at turbine exit. Both volumetric flow rates reflect the actual machine dimensions, which correlates with its cost, and may be estimated by multiplying the appropriate specific volume specified in Table 3 with the working fluid mass flow rate predicted by the correlation [eq. (6)].
Different profitability criteria may be applied in the economic analysis. PBP and the Net Present Value (NPV) were used in the present work. The standard procedure for determination of both factors was used [34], thus, it is not presented here, while the investment evaluation is presented in more detail. The characteristic economic parameters used in NPV and PBP calculation are summarised in Table 6. The values correspond to renewable energy source application projects in Slovenia, and were set as the default values, which, however, may be changed by the decision model user at any time. The electricity price (Cel) considers the average production electricity price in Slovenia, increased by the subsidies from the governmental renewable energy production support scheme.
Economic parameters
Parameter |
Symbol |
Value |
|---|---|---|
Lifetime of the plant [year] |
n |
15 |
Interest rate [%] |
i |
5.00 |
Inflation rate [%] |
iL |
1.50 |
Electricity price [EUR/MWh] |
Cel |
121.20 |
Annual electricity cost index [%] |
- |
2.50 |
Labour and maintenance cost factor [-] |
fm |
1.6 |
Annual labour cost index [%] |
- |
1.50 |
The evaluation of the investment required to build an ORC system is considered as the sum of the costs for purchasing and installing all the equipment required. Cost functions proposed by Bejan et al. [35] are used to estimate the purchasing cost of individual components. The purchase cost of an equipment item (Cy) is estimated as:
(8)
where Xy is the item size or capacity, Cref is the cost at a different size or capacity Xref, and α is the scaling exponent.
The reference values Cref and Xref and scaling exponent α used in this study are presented in Table 7, where the investment cost computation procedure is summarised. The heat exchanger cost depends on the heat transfer area, type of heat exchanger and refrigerant type. Cost functions proposed by Ommen et al. [36] apply for plate heat exchanges operating with common refrigerants, while values from Henchoz et al. [37] were adopted for water applications. The electrical motor cost function depends on the motors shaft power [36]. The same cost function is applied for both electrical motor and generator. Two different pump cost functions are used. The first proposed by Quoilin et al. [38] applies when any refrigerant is used, while the second, derived from catalogue prices, applies with non-aggressive media like water. The turbine purchasing cost is estimated using the appropriate compressor cost function [36]. According to Quoilin et al. [38], the turning volumetric expanders (such as scroll expanders) into compressors, and vice versa, is feasible with good efficiency, which was, on small scale machines only, also shown by other researchers [39], [40]. Dynamic expanders (radial and axial turbines) prevail in medium size and large ORC units [41], thus a radial compressor cost function seemed to be a reasonable choice to account for the turbine purchasing cost. Volumetric flow rate at the turbine exit, which dictates turbine size, was applied as a capacity parameter in this cost function. All miscellaneous components, such as control and expansion valve, oil separator, liquid vapour separator, etc., as well as working fluid cost were neglected, since their cost does not significantly increase the final system purchasing cost.
ORC cost estimation
Component |
Symbol |
Cost estimation method |
|---|---|---|
ORC-plant |
CORC |
CORC = (CPH + CE + CSH + CC + CVC + CT + CG + CP)MF, MF = 1.65 |
Preheater |
CPH |
Eq. (6) (Cref = 15,526.00 EUR, xref = 42 m2, α = 0.80) [36] |
Evaporator |
CE |
Eq. (6) (Cref = 15,526.00 EUR, xref = 42 m2, α = 0.80) [36] |
Superheater |
CSH |
Eq. (6) (Cref = 15,526.00 EUR, xref = 42 m2, α = 0.80) [36] |
Condenser |
CC |
Eq. (6) (Cref = 15,526.00 EUR, xref = 42 m2, α = 0.80) [36] |
Vapour cooler |
CVC |
Eq. (6) (Cref = 15,526.00 EUR, xref = 42 m2, α = 0.80) [36] |
Turbine |
CT |
Eq. (6) (Cref = 10,631.00 EUR, xref = 178.4 m3/h, α = 0.79) [36] |
Generator |
CG |
Eq. (6) (Cref = 10,710.00 EUR, xref = 250 kW, α = 0.65) [36] |
Pump |
CP |
Eq. (6) (Cref = 900.00 EUR, xref = 300 W, α = 0.25) [38] |
Cooling tower |
CCT |
CCT = (CCT,HE + CCT,F + CCT,P)MF, MF = 1.5 |
Heat exchanger |
CCT,HE |
Eq. (6) (Cref = 420.00 EUR, xref = 1 m3, α = 0.823) [37] |
Axial fan |
CCT,F |
Eq. (6) (Cref = 48.91 EUR, xref = 1 m3/h, α = 0.463)* |
Pump |
CCT,P |
Eq. (6) (Cref = 960.00 EUR, xref = 20 m3/h, α = 0.57)* |
Exhaust system adapt. |
CSA |
10% of CORC |
Electricity delivery unit |
CEDU |
Eq. (6) (Cref = 20,000.00 EUR, xref = 500 kW, α = 0.80) [36] |
Building expenses |
CB |
Cinst,sp = 1,500.00 EUR/m2 1/20 m2/kW |
Engineering cost |
CE |
6% of total installed cost |
* Derived from catalogue prices
For all the equipment, a multiplication factor MF was applied to the purchasing cost in order to compute the installed cost. According to Henchoz et al. [37], the multiplication factor MF = 1.65 is consistent with the one used for the current energy conversion technology.
Further investment costs are related to the rejected energy source system adaptation, some extra installation space, and the engineering cost (see Table 7 for the details). Total capital investment of ORC (TCIORC) is finally calculated as the sum:
(9)
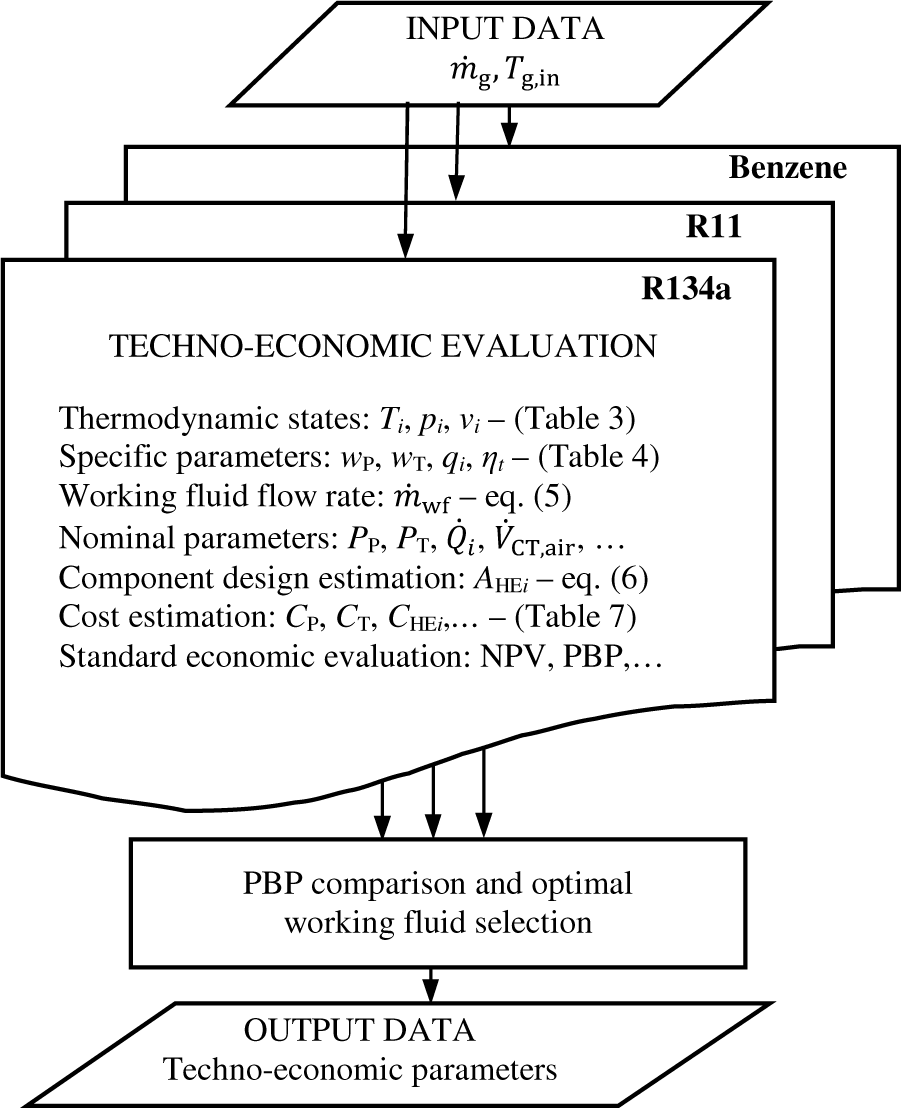
The techno-economic model is designed as a decision-making tool, which compares the application of all three working fluids and finally selects the optimal one according to the applied screening criteria. Its design and operation are presented in Figure 5. The input data are exhaust gas (waste heat carrier) parameters, i.e., temperature and mass flow rate. Techno-economic evaluation runs parallel for all three working fluids. Table 3 and Table 4 are applied first to obtain any thermodynamic state and the specific operating parameters of all ORC components. Eq. (6) is applied next to calculate the working fluid mass flow rate and estimate the pump, turbine and generator power, as well as the thermal power of all heat exchangers including the cooling tower. The design parameters of ORC components are calculated in the following step. The heat transfer area of all heat exchangers is estimated using eq. (7), and eq. (6) is used to predict the design volumetric flow rate of the cooling tower fan, while the ORC pump and turbine design flow rate are estimated by multiplying the working fluid mass flow rate with the corresponding specific volume, as explained in the previous section. Finally, total ORC system cost is calculated as specified in Table 7, and annual electricity production is estimated according to waste heat availability. Both values are then applied to predict NPV and PBP. The final decision on the most appropriate working fluid is made considering the limiting pitch point temperature difference and the lowest PBP.
Simplified flow chart of techno-economic evaluation and decision procedure
Thermodynamic model validation is presented first, and then an example of techno-economic model application under different operating conditions is shown and the results are discussed.
The simplified ORC model and design correlations were validated with the results presented in Vaja and Gambarotta [31] and Tian et al. [11], obtained for an Internal Combustion Engine (ICE) bottoming ORC. Exhaust gases were applied from a 12 cylinder 4 stroke supercharged natural gas fired ICE. The exhaust gas temperature was 470 °C and their mass flow rate was 4.354 kg/s. The working fluids were benzene, R11 and R134a, and the same live vapour parameters were applied as presented in Table 2, while the selected condenser temperature was set 5 °C lower. The comparison of some of the results presented in Table 8 shows a reasonable accuracy, although slightly higher condenser pressure (condenser temperature was set to 40 °C in the present model) reduces the turbine expansion ratio, as well as predicted power, thermal efficiency and specific volume ratio v2/v1. Eq. (6) predicts working fluid mass flow ratio and volumetric flow ratio at turbine entry correctly. The predicted values are in between those obtained from references Tian et al. [11] and Vaja and Gambarotta [31].
Validation of ORC model with the results published in Tian et al. [11] and Vaja and Gambarotta [31]
Working fluid |
PORC [kW] |
ṁwf[kg/s] |
[m3/s] |
ηt [%] |
pcond [kPa] |
v2/v1 [-] |
Source |
|---|---|---|---|---|---|---|---|
|
349.3 |
2.737 |
0.052 |
0.199 |
19.6 |
107 |
[31] |
Benzene |
329.8 |
2.693 |
0.051 |
0.192 |
24.0 |
88 |
Present |
|
334.1 |
2.560 |
0.049 |
0.198 |
19.6 |
107 |
[11] |
|
290.3 |
7.487 |
0.030 |
0.166 |
147.9 |
32 |
[31] |
R11 |
274.5 |
7.422 |
0,031 |
0.161 |
174.0 |
27.4 |
Present |
|
291.4 |
7.483 |
0.027 |
0.155 |
147.2 |
35 |
[11] |
|
147.5 |
8.967 |
0.041 |
0.085 |
883.3 |
5 |
[31] |
R134a |
133.4 |
9.279 |
0.043 |
0.077 |
1,017.0 |
4.5 |
Present |
|
159.7 |
9.917 |
0.034 |
0.079 |
883.8 |
6 |
[11] |
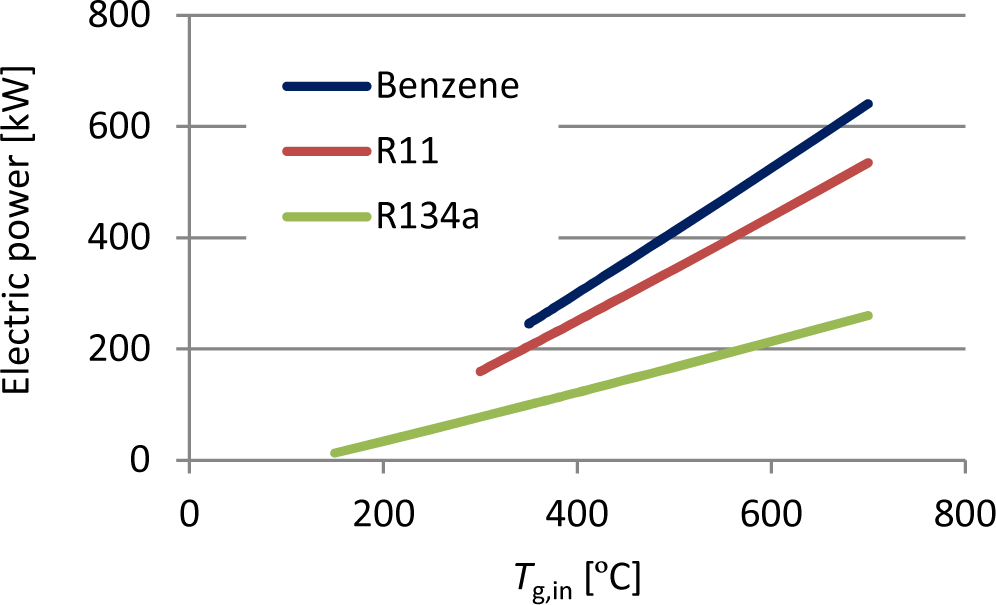
The presented ORC techno-economic model was applied to predict variation of generator power with waste heat temperature for all three working fluids. The mass flow rate of waste heat carrying exhaust gasses was set to 5 kg/s. The waste heat availability was set to 7,600 hours per year, while a 0.95 system availability factor was used. The results are presented in Figure 6. Electric power increases with source temperature. Approximately 75% electic power gain may be expected when the exhaust gases temperature increases from 400 °C to 600 °C. At a constant source temperature, the maximum electric power is obtained when benzene is used as the working fluid, while the application of R134a results in the minimum generator power. A simple comparison shows more than 50% power reduction when R11 is replaced by R134a, and approximately 20% power increase when it is replaced by propane. However, the benzene can be applied only if the source temperature is 340 °C or higher, while ORC with R134a operates at source temperatures as low as 135 °C.
Generator power
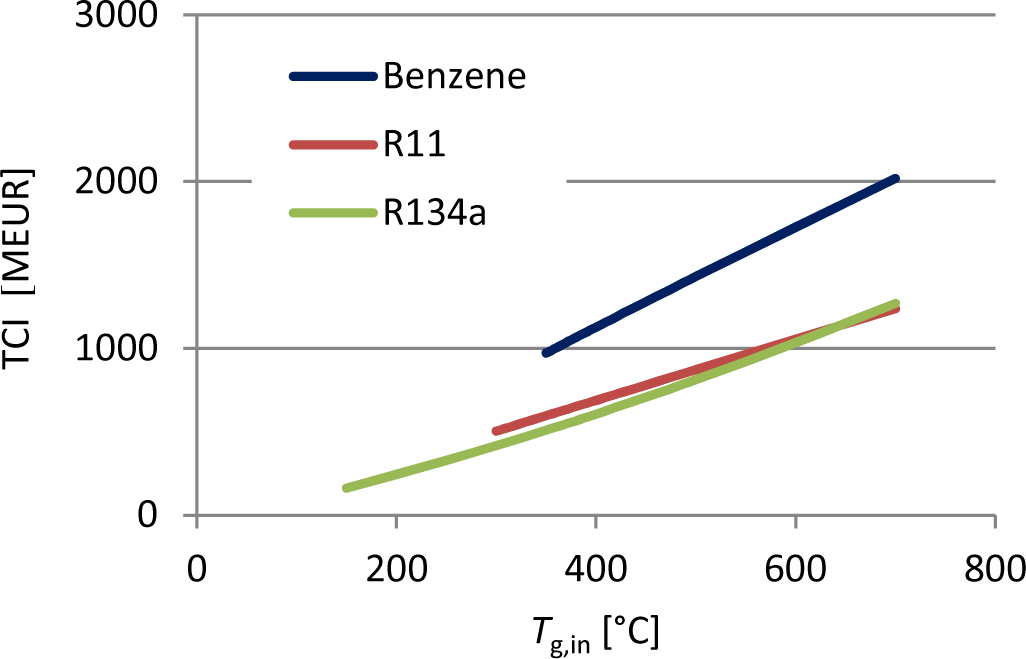
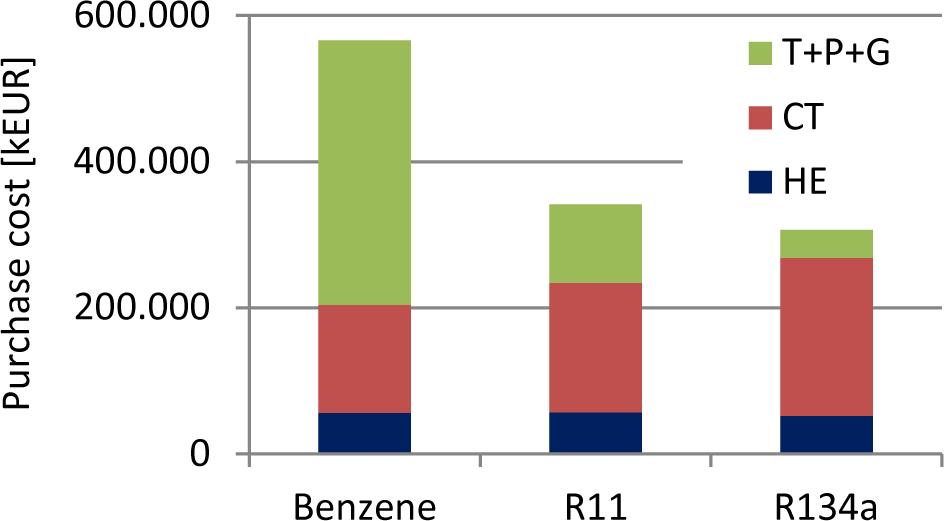
The highest electric power, however, does not guarantee the best economic characteristics of the ORC with benzene. As shown in Figure 7, this working fluid demands very high investment cost because of the very expensive Turbine, Pump and Generator (T + P + G) set, representing more than 60% of the purchase cost of all ORC components (Figure 8). Especially disadvantageous is a large turbine size, which is dictated by very high specific volume ratio v2/v1 (Table 4). On the other hand, the TPG set represents less than 30% and 10%, respectively, when R11 and R134a, respectively, are applied (Figure 8). The specific volume ratio v2/v1 is well bellow 30 in both cases, which allows, according to Invernizzi et al. [42] reasonable turbine efficiency to be achieved in a simple single stage turbine. Figure 8, however, says a great deal too on the thermodynamic efficiency of application of a single working fluid, which dictates the amount of rejected heat and, thus, the size of the cooling tower. As shown, the R134a, having the lowest thermal efficiency (Table 4), needs the largest and the most expensive cooling tower, which represents more than 65% of the system purchase cost, while this share is below 25% when the propane is considered as the working fluid. Results shown in Figure 7 and Figure 8 may somehow be misleading. Although the application of three working fluids is presented under the same conditions (same source temperature and mass flow) the very different ORC system size is not considered, since the gained electric power differs substantially from one working fluid to another, and, as presented in Figure 6, the power gained by propane is more than two times higher than that obtained by R134a. The specific investment cost thus shows a different classification of the three fluids: R11 is leading, with the mean specific investment cost 2,750.00 EUR/kWe. Propane, with the mean specific investment cost 3,760.00 EUR/kWe, is second, while R134a, with the mean specific investment cost 4,980.00 EUR/kWe, occupies the last place.
Total capital investment
Purchase cost (Tg,in = 400 °C)
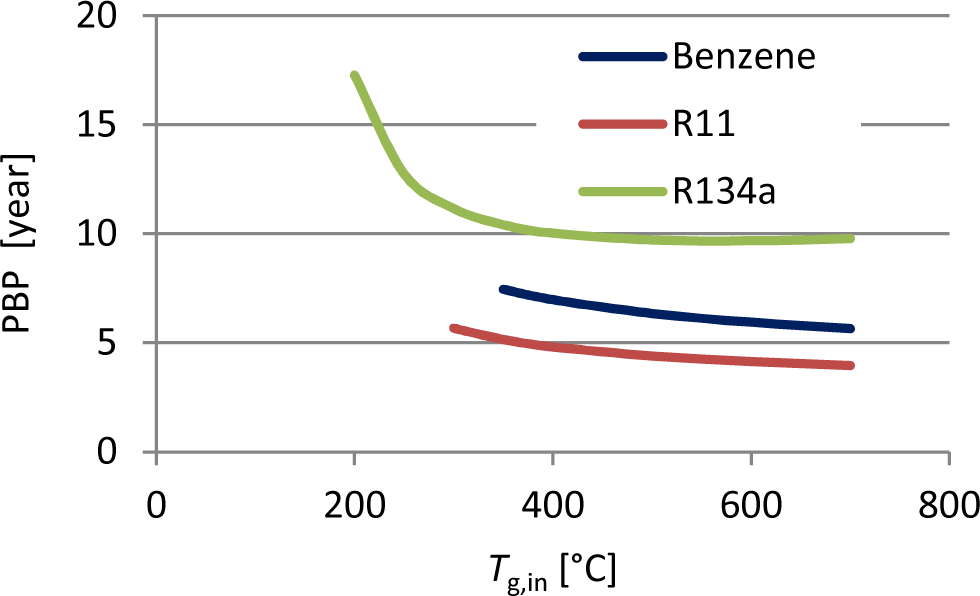
The highest economic viability is, therefore, guaranteed when R11 is applied as the working fluid, and a PBP below 5 years is achievable when the waste heat temperature is 400 °C or higher (Figure 9). Although R134a application results in low economic gain, it is favourable at low source temperatures, especially below 265 °C where neither benzene nor R11 are applicable.
Payback period
A simple decision model was developed, which can be used to check the technical feasibility and economic viability of an ORC system, based only on basic information on the waste heat source, i.e., source temperature and mass (heat) flow rate. Two profitability criteria, NPV and PBP, were introduced for economic evaluation, while an ORC design correlations based model was developed and applied for prediction of ORC technical parameters and components design estimation. The model is applicable for three commonly adopted working fluids for technical applications, R134a, R11 and benzene, and predicts basic technical and economic parameters of the ORC system.
Model validation was performed with the previously published data for all three working fluids. Although simplified, the model predicted the basic ORC thermodynamic characteristics correctly. It gives quick answers, and can be incorporated easily into a decision algorithm, which, when supported by a set of ORC component design and cost functions, can serve as an effective tool for preliminary feasibility evaluation of any proposed ORC based waste heat recovery system.
An example of model application was made to show its basic capabilities. An ORC based bottoming system was applied to recover heat from the exhaust gases of an ICE. It was found that the benzene resulted in the highest electric power gain, although it demanded very high investment, and its application was limited to high waste heat source temperatures. From the economic point of view, R11 surpassed the other two working fluids at moderate to high source temperature, while R134a guaranteed the system operation at low source temperature. The results show clearly that R11 or similar working fluids may be preferable than the thermodynamically more efficient benzene or other overhanging fluids for the smaller turbine size (lower specific volume ratio v2/v1) which guarantees lower investment cost and higher system economy.
The research described in this paper was a part of the INTERREG Central Europe CE-Heat project which was supported financially by the European Regional Development Fund. Its support is greatly appreciated.
A |
effective heat transfer area |
[m2] |
C |
cost |
[EUR] |
cp |
specific heat |
[J/kg/K] |
C1, C2 |
correlation constants |
[-] |
fm |
labour and maint. cost factor |
[-] |
h |
heat transfer coefficient |
[W/m2/K] |
h |
specific enthalpy |
[J/kg] |
i |
interest rate |
[%] |
iL |
inflation rate |
[%] |
ṁ |
mass flow rate |
[kg/s] |
MF |
multiplication factor |
[-] |
n |
lifetime of the plant |
[year] |
p |
pressure |
[Pa] |
q |
specific heat |
[J/kg] |
heat flow rate |
[W] |
|
s |
specific entropy |
[J/kg/K] |
T |
temperature |
[K], [°C] |
U |
overall heat transf. coeff. |
[W/m2/K] |
v |
specific volume |
[m3/kg] |
volumetric flow rate |
[m3/s] |
|
w |
specific work |
[J/kg] |
X |
size or capacity |
[-] |
Greek letters |
||
α |
scaling factor |
[-] |
∆ |
difference |
[-] |
ηt |
thermal efficiency |
[%] |
ρ |
density |
[kg/m3] |
Subscripts and superscripts |
||
B |
building |
|
C |
condenser |
|
c |
cold |
|
CT |
cooling tower |
|
cw |
cooling water |
|
E |
evaporator |
|
el |
electricity |
|
En |
engineering |
|
F |
fan |
|
G |
generator |
|
g |
exhaust gas |
|
h |
hot |
|
HE |
heat exchanger |
|
in |
inflow |
|
l |
liquid |
|
out |
outflow |
|
P |
pump |
|
PH |
preheater |
|
ref |
reference |
|
rej |
rejected |
|
SA |
system adaptation |
|
sf |
secondary fluid |
|
SH |
superheater |
|
T |
turbine |
|
v |
vapour |
|
VC |
vapour cooler |
|
wf |
working fluid |
|
Abbreviations |
||
NPV |
Net Present Value |
|
ORC |
Organic Rankine Cycle |
|
PBP |
Payback Period |
|
- ,
Evaluating the Potential of Process Sites for Waste Heat Recovery ,Applied Energy , Vol. 161 (1),pp 627-646 , 2016, https://doi.org/https://doi.org/10.1016/j.apenergy.2015.07.011 - ,
Designing High Efficiency Segmented Thermoelectric Generators ,Energy Conversion and Management , Vol. 66 ,pp 165-172 , 2013, https://doi.org/https://doi.org/10.1016/j.enconman.2012.07.030 - ,
Energy Efficiency Analysis and Impact Evaluation of the Application of Thermoelectric Power Cycle to Today’s CHP Systems ,Applied Energy , Vol. 87 (4),pp 1231-1238 , 2010, https://doi.org/https://doi.org/10.1016/j.apenergy.2009.06.009 - ,
A Review on Heat Sink for Thermo-Electric Power Generation: Classifications and Parameters Affecting Performance ,Energy Conversion and Management , Vol. 134 ,pp 260-277 , 2017, https://doi.org/https://doi.org/10.1016/j.enconman.2016.12.046 - ,
Integrated Thermoelectric and Organic Rankine Cycles for Micro-CHP Systems ,Applied Energy , Vol. 97 ((C)),pp 667-672 , 2012, https://doi.org/https://doi.org/10.1016/j.apenergy.2011.12.072 - ,
A Multi-Approach Evaluation System (MAES) of Organic Rankine Cycles (ORC) Used in Waste Heat Utilization ,Applied Energy , Vol. 132 ,pp 325-338 , 2014, https://doi.org/https://doi.org/10.1016/j.apenergy.2014.07.007 - , Combined Cycle and Waste Heat Recovery Power Systems Based on a Novel Thermodynamic Energy Cycle Utilizing Low-Temperature Heat for Power Generation, Proceedings of Joint Power Generation Conference, 1983
- ,
Low Heat Power Generation System ,Applied Thermal Engineering , Vol. 70 (2),pp 1056-1061 , 2014, https://doi.org/https://doi.org/10.1016/j.applthermaleng.2014.03.037 - ,
Exergoeconomic Comparison of TLC (Trilateral Rankine Cycle), ORC (Organic Rankine Cycle) and Kalina Cycle Using a Low Grade Heat Source ,Energy , Vol. 83 ,pp 712-722 , 2015, https://doi.org/https://doi.org/10.1016/j.energy.2015.02.080 - ,
Comparison of Trilateral Cycles and Organic Rankine Cycles ,Energy , Vol. 36 (10),pp 6208-6219 , 2011, https://doi.org/https://doi.org/10.1016/j.egypro.2017.12.532 - ,
Fluids and Parameters Optimization for the Organic Rankine Cycles (ORCs) Used in Exhaust Heat Recovery of Internal Combustion Engine (ICE) ,Energy , Vol. 47 (1),pp 125-136 , 2012, https://doi.org/https://doi.org/10.1016/j.energy.2012.09.021 - ,
Opportunities for Low-Grade Heat Recovery in the UK Food Processing Industry ,Applied Thermal Engineering , Vol. 53 (2),pp 188-196 , 2013, https://doi.org/https://doi.org/10.1016/j.applthermaleng.2012.03.024 - ,
Second Law Assessment of Binary Plants Generating Power from Low-Temperature Geothermal Fluids ,Geothermics , Vol. 33 (5),pp 565-586 , 2004, https://doi.org/https://doi.org/10.1016/j.geothermics.2003.10.003 - ,
A Review of Research on the Kalina Cycle ,Renewable and Sustainable Energy Reviews , Vol. 16 (7),pp 5309-5318 , 2012, https://doi.org/https://doi.org/10.1016/j.rser.2012.05.040 - ,
Thermo-Economic Evaluation of Various Bottoming ORCs for Geothermal Power Plant, Determination of Optimum Cycle for Sabalan Power Plant Exhaust ,Geothermics , Vol. 70 ,pp 181-191 , 2017, https://doi.org/https://doi.org/10.1016/j.geothermics.2017.06.007 - ,
Influence of the Incident Radiation on the Energy Performance of Two Smallscale Solar Organic Rankine Cycle Trigenerative Systems: A Simulation Analysis ,Applied Energy , Vol. 242 ,pp 1176-1188 , 2019, https://doi.org/https://doi.org/10.1016/j.apenergy.2019.03.066 - ,
ORC Power Plant for Electricity Production from Forest and Agriculture Biomass ,Energy Conversion and Management , Vol. 87 ,pp 1180-1185 , 2014, https://doi.org/https://doi.org/10.1016/j.enconman.2014.04.098 - ,
Selection of Working Fluids for Micro-CHP Systems with ORC ,Renew. Energy , Vol. 48 ,pp 565-570 , 2012, https://doi.org/https://doi.org/10.1016/j.renene.2012.06.006 - ,
Exergoeconomic Optimization of a Combined Cycle Power Plant’s Bottoming Cycle Using Organic Working Fluids ,Energy Conversion and Management , Vol. 171 ,pp 1721-1736 , 2018, https://doi.org/https://doi.org/10.1016/j.enconman.2018.06.103 - ,
Multi-Criteria Evaluation of Several Million Working Fluids for Waste Heat Recovery by Means of Organic Rankine Cycle in Passenger Cars and Heavyduty Trucks ,Applied Energy , Vol. 206 ,pp 887-899 , 2017, https://doi.org/https://doi.org/10.1016/j.apenergy.2017.08.212 - ,
Thermal and Exergetic Approach to Wet Type Rotary Kiln Process and Evaluation of Waste Heat Powered ORC (Organic Rankine Cycle) ,Appl. Therm. Eng. , Vol. 112 ,pp 281-295 , 2017, https://doi.org/https://doi.org/10.1016/j.applthermaleng.2016.10.053 - ,
ORC Waste Heat Recovery in European Energy Intensive Industries: Energy and GHG Savings ,Energy Conversion and Management , Vol. 76 ,pp 244-252 , 2013, https://doi.org/https://doi.org/10.1016/j.enconman.2013.07.041 - ,
Cost Effective Greenhouse Gas Reductions in the Steel Industry from an Organic Rankine Cycle ,Chem. Eng. Trans. , Vol. 25 ,pp 905-910 , 2011, https://doi.org/https://doi.org/10.3303/CET1125151 - ,
Techno-Economic Evaluation of Waste Heat Recovery by Organic Rankine Cycle Using Pure Light Hydrocarbons and Their Mixtures as Working Fluid in a Crude Oil Refinery ,Energy Conversion and Management , Vol. 174 ,pp 793-801 , 2018, https://doi.org/https://doi.org/10.1016/j.enconman.2018.08.031 - , National Institute of Standards and Technology (NIST), REFPROP Software
- ,
Working Fluids for Low Temperature Organic Rankine Cycles ,Energy , Vol. 32 (7),pp 1210-1221 , 2007, https://doi.org/https://doi.org/10.1016/j.energy.2006.07.001 - ,
Experimental Investigation of an Automotive Air Conditioning System Using R444A and R152a Refrigerants as Alternatives of R134a ,Strojniški Vestnik ‒ Journal of Mechanical Engineering , Vol. 65 (4),pp 212-218 , 2019, https://doi.org/https://doi.org/10.5545/sv-jme.2019.6040 - ,
Experimental Study on Organic Rankine Cycle Utilizing R245fa, R123 and Their Mixtures to Investigate the Maximum Power Generation from Low-Grade Heat ,Energy , Vol. 133 ,pp 636-651 , 2017, https://doi.org/https://doi.org/10.1016/j.energy.2017.05.128 - ,
Multicomponent Working Fluids for Organic Rankine Cycles (ORCs) ,Energy , Vol. 23 (6),pp 449-463 , 1998, https://doi.org/https://doi.org/10.1016/S0360-5442(98)00009-7 - ,
Fluid Selection and Parametric Optimization of Organic Rankine Cycle Using Low Temperature Waste Heat ,Energy , Vol. 40 (1),pp 107-115 , 2012, https://doi.org/https://doi.org/10.1016/j.energy.2012.02.022 - ,
Internal Combustion Engine (ICE) Bottoming with Organic Rankine Cycles (ORCs) ,Energy , Vol. 35 (2),pp 1084-1093 , 2010, https://doi.org/https://doi.org/10.1016/j.energy.2009.06.001 - ,
Optimization of an Organic Rankine Cycle Constrained by the Application of Compact Heat Exchangers ,Energy Conversion and Management , Vol. 188 ,pp 333-345 , 2019, https://doi.org/https://doi.org/10.1016/j.enconman.2019.03.039 - ,
Quick Selection of Industrial Heat Pump Types Including the Impact of Thermodynamic Losses ,Energy , Vol. 53 ,pp 312-322 , 2013, https://doi.org/https://doi.org/10.1016/j.energy.2013.02.065 - ,
The Importance of Using Discounted Cash Flow Methodology in Techno-economic Analyses of Energy and Chemical Production Plants ,J. Sustain. Dev. Energy Water Environ. Syst. , Vol. 5 (2),pp 163-176 , 2017, https://doi.org/https://doi.org/10.13044/j.sdewes.d5.0140 - ,
, Thermal Design & Optimization , 1996 - ,
Technical and Economic Working Domains of Industrial Heat Pumps Part 1: Single Stage Vapour Compression Heat Pumps ,International Journal of Refrigeration , Vol. 55 ,pp 168-182 , 2015, https://doi.org/https://doi.org/10.1016/j.ijrefrig.2015.02.012 - ,
Performance and Profitability Perspectives of a CO2 Based District Energy Network in Geneva’s City Centre ,Energy , Vol. 85 ,pp 221-235 , 2015, https://doi.org/https://doi.org/10.1016/j.energy.2015.03.079 - ,
Thermo-Economic Optimisation of Waste Heat Recovery Organic Rankine Cycle ,Applied Thermal Engineering , Vol. 31 (14-15),pp 2885-2893 , 2011, https://doi.org/https://doi.org/10.1016/j.applthermaleng.2011.05.014 - ,
Experimental Testing of a Small-Scale Two Stage Organic Rankine Cycle Engine Operating at Low Temperature ,Energy , Vol. 141 ,pp 869-879 , 2017, https://doi.org/https://doi.org/10.1016/j.energy.2017.09.127 - ,
Experimental and Modeling Investigation of an Organic Rankine Cycle System Based on the Scroll Expander ,Energy , Vol. 134 ,pp 35-49 , 2017, https://doi.org/https://doi.org/10.1016/j.energy.2017.06.001 - , Volumetric Expander Versus Turbine ‒ Which is Better Choice for Small ORC Plants, 3rd International Seminar on ORC Power Systems, Paper ID: 022, Brussels, Belgium, 2015
- ,
Bottomimg Micro-Rankine Cycles for Micro-Gas Turbines ,Applied Thermal Engineering , Vol. 27 (1),pp 100-110 , 2007, https://doi.org/https://doi.org/10.1016/j.applthermaleng.2006.05.003