Wastewater treatment contributes to greenhouse gases mainly through the production of methane (CH4), nitrous oxide (N2O) and/or carbon dioxide (CO2) during the treatment processes, and through the operation energy requirements. CH4 produced in Wastewater Treatment Plants (WWTP) and released to the atmosphere represents an important threat as it has a global warming potential of 25 CO2eq over a 100 year time horizon [1]. Moreover, the atmospheric CH4 concentrations have rapidly increased since 2007 [2] with sewage contributing about 5% of the global CH4 sources [3], [4]. Energy usage is another major source of carbon emissions in WWTP [5] since these facilities are energy intensive, being responsible of a significant fraction of a national energy balance [6]. For example, in Spain, ~1% of the national electrical energy consumption can be attributed to activities related to sewage treatment [7]. Nevertheless, the energy consumed in the WWTP could be greatly reduced if technology manages to make use of the residual energy contained in the wastewater [8], [9]. Some authors even point to the possibility that WWTP can become net energy producers [10], thus turning into strategic facilities that integrate water and energy that allow communities for an uninterrupted delivery of services [11] helping urban energy systems to move towards a more sustainable, cleaner, and efficient energy future [12].
In this regard, a novel and promising technology for producing energy from low-strength wastewaters are Microbial Electrolysis Cells (MECs) [13]. These are electrochemical devices that produce hydrogen by combining the ability of electrogenic bacteria to oxidize organic matter (using the anode as an electron acceptor) with hydrogen evolution reaction at the cathode. These systems have been extensively optimized recently in terms of hydrogen production, wastewater treatment efficiency or energy consumption [14]-[16]. Although this process requires the input of a small amount of electrical energy, the energy recovered as hydrogen on the cathode can potentially help to offset the overall energy usage during wastewater treatment [17], [18]. Despite that, the benefits that this technology may provide in the field of wastewater treatment are unclear as the studies that assess its economic and environmental feasibly are still scarce [19], although some authors already state that financial viability of MEC systems will be positive in the near future [20]. For instance, and regarding the environmental performance of MECs, in a pioneering study by Foley et al. [21], the authors concluded that the utilization of MECs in the treatment of wastewater to produce hydrogen peroxide can reduce significantly the CO 2 footprint when compared with conventional hydrogen peroxide-producing technologies. More recently, Streeck et al. [19] concluded that using a MEC for the conversion of industrial wastewater into methanol can become a more environmentally friendly alternative to conventional methanol production form fossil fuels provided the system is operated with 100% renewable electricity and the CO2 is sourced only from the MEC. Moreover, strong efforts have been made for lowering the applied potential required by MECs for domestic wastewater, therefore lowering the required energy consumption [16]. These systems could even work in a full biological mode instead of having a pure chemical counter electrode drastically lowering cell potential although requiring a complex control system [22].
This paper consists of a case study in which it is attempted to estimate the carbon footprint associated to wastewater treatment and MEC technology, by comparing the carbon footprint of a domestic WWTP (active sludge) with the WWTP using MEC. The MEC reactor is meant to be integrated within the biological treatment of an existing domestic WWTP. MEC architecture and process design are based on the assumptions made in a previous study in which an identical setup was used to evaluate the techno-economic perspectives of MEC technology [23]. This study also tries to identify the critical steps and factors that have the highest contribution to the carbon footprint, and suggests potential reducing approaches.
An online free-access software (
Energy consumption (fuel, electricity, natural gas, etc.);
Specific procedures related to water and waste management activities (biological treatment, etc.);
Production of inputs (reagents, consumables, construction materials, equipment, etc.);
Movement of persons;
Transport of goods, sludge, waste, materials (incoming freight, internal freight, outgoing freight);
Waste treatment and sludge processing.
The O2C™ tool is based on Life Cycle Analysis (LCA) and the greenhouse gas metrics (ISO 14040) defined by international guidelines. O2C™ therefore integrates the methodological rules of the Bilan Carbone® audit defined by French Environment & Energy Management Agency (ADEME) in France and is based on the guide published by Scientific and Technical Association for Water and the Environment (ASTEE). The inputs required to conduct a carbon assessment of a plant are known as emission factors. These emission factors are obtained from public sources (Bilan Carbone® by ADEME, ASTEE, ECOINVENT, etc.) but also ‒ in order to adapt to the water treatment industry – investigations conducted by the The International Research Center on Water and Environment (CIRSEE), the research center of Suez Environnement. This is the case for emissions related to the decomposition of organic materials in anaerobic conditions (CH4) or the treatment of nitrogenous life forms (urea, ammonium, proteins) present in water (N2O generated during the nitrification and denitrification phases). Research into these matters has appeared in recent publications [24], [25].
The emission factors database is at the core of O2C™, and is the result of a collaborative process. It is transparently shared with the entire water industry on the website
This study takes into account the following GHG emissions (figures in brackets indicate the warming potential): CO2 (1×), CH4 (25×) and N2O (298×). CH4 and N2O emissions were independently calculated since they are specific emissions connected with wastewater treatment procedures: while CH4 is produced by the decomposition of organic matter under anaerobic conditions, N2O is connected to the treatment of nitrogen compounds present in water (urea, ammonium, proteins).
The carbon footprint analysis takes into account both the construction of the plants (including construction materials, evacuated materials, equipment, energy needs and transportation) and operation requirements (including consumables, energy, process emissions, by-products and transportation).
The analysis presented in the results and discussion section of the present paper is based on a comparison of two scenarios. The first scenario (designated as WWTP) corresponds to an existing domestic WWTP located in Andalucía, southern Spain. The second scenario incorporates a MEC within the biological treatment of the referred existing plant and will be designated as WWTP + MEC. Both scenarios are fully described and can be consulted in a previous paper in which the integration of MEC technology within the mentioned WWTP is analyzed from a techno-economical perspective [23]. Nevertheless, a brief summary of the WWTP scenario (which corresponds to scenario 0 in Escapa et al. [23]) and of the WWTP + MEC scenario (which corresponds to scenario 2 in Escapa et al. [23]) is presented below.
The first scenario studied consists of a conventional WWTP located in Southern Spain and designed for 73,600 Population Equivalent (PE), a processing capacity of 12,696 m3d−1, 1,595 t BOD 5,eliminatedy−1 and 215 t Neliminatedy−1. Wastewater stream is conducted to a screen and grit chamber to prepare it to an aerobic biological treatment and is finally conducted to the secondary settling tank, which involves the physical separation of suspended solids from the wastewater flow. Part of the solids are recirculated to the aerobic treatment and the rest is conducted to a gravity thickener and finally to a centrifuge that allows the sludge to dewater, recovering the resultant liquid and sending it back to the entrance flow. The Dried Sludge (DS) is commonly landfilled. The biological reactor (activated sludge) has a total volume of 16,000 m3 with a hydraulic retention time of 31 hours. Chemical Oxygen Demand (COD), Total Kjeldahl Nitrogen (TKN) and Total Phosphorus (TP) concentration at the exit of the grit chamber are 695 g CODm−3, 48.15 g TKNm−3 and 13.04 g TPm−3, respectively. Removal efficiencies are 89%, 73% and 88% for COD, TKN and TP, respectively, which are above the minimum removal efficiency permitted.
In the second scenario (WWTP + MEC), a MEC is integrated as part of the biological treatment, where the effluent from the grit chamber is fed directly into the MEC reactor. This is followed by the polishing step (aerobic reactor), which removes the remaining COD, obtaining an effluent with TKN and COD concentrations below 15 and 125 gm−3, respectively. This plant also includes a gas compressor and a gas storage tank to manage the biohydrogen produced in the MEC. The selected Organic Loading Rate (OLR) of the MEC reactor is 3,100 g CODm−3d−1, which corresponds to an HRT of 5.2 h. The COD removal in the MEC reactor remains at 44%, current densities on the order of 2.5 Am−2, hydrogen production up to 0.60 m3manode−3d−1, energy consumption of 1 kWh kg COD−1, sludge production of 0.3 g COD biomass/g COD and coulombic efficiency and cathodic conversion efficiencies of 50% and 75%, respectively. The size of the aerobic reactor was calculated as 9,000 m3 so that nitrification, denitrification and COD removal can be accomplished effectively following the calculation methods described by [26], [27].
In this section, the carbon footprint of the existing plant is detailed for both, the construction and the operation phases.
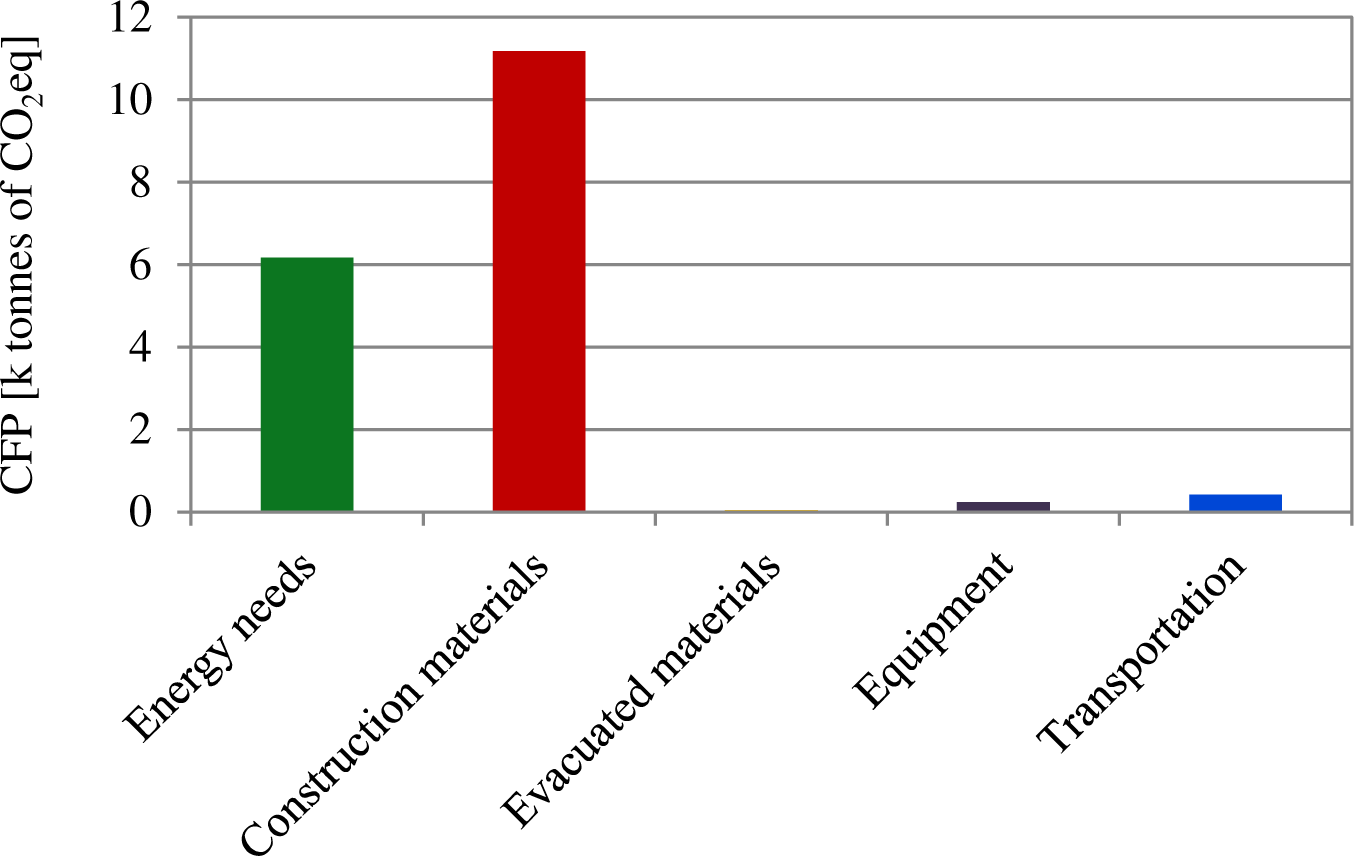
Using the model described in materials and methods section, the carbon footprint during the construction phase was found to be 17,525 t CO2eq, 62% of which was associated to the construction materials (11,179 t CO2eq) (Figure 1). Here, standard reinforced concrete has the highest impact (7,328 of t CO2eq) followed by the reinforcing steel (1,196 t CO2eq) and the pavement (942.8 t CO2eq).
The energy consumption was 20,000 MWhe, generating a total of 6,120 t CO2eq which contributed 34% to the total GHG emissions of the entire construction stage [data based on the mix from the Union for the Coordination of the Transmission of Electricity (UCTE)] [28].
Transportation (of construction materials and equipment) together with equipment itself and the disposal of evacuated materials made a minor contribution of only 4% (701 t CO2eq), in fact the contribution of the latter one, evacuated materials, could be neglected.
Infrastructure contribution of WWTP to CFP

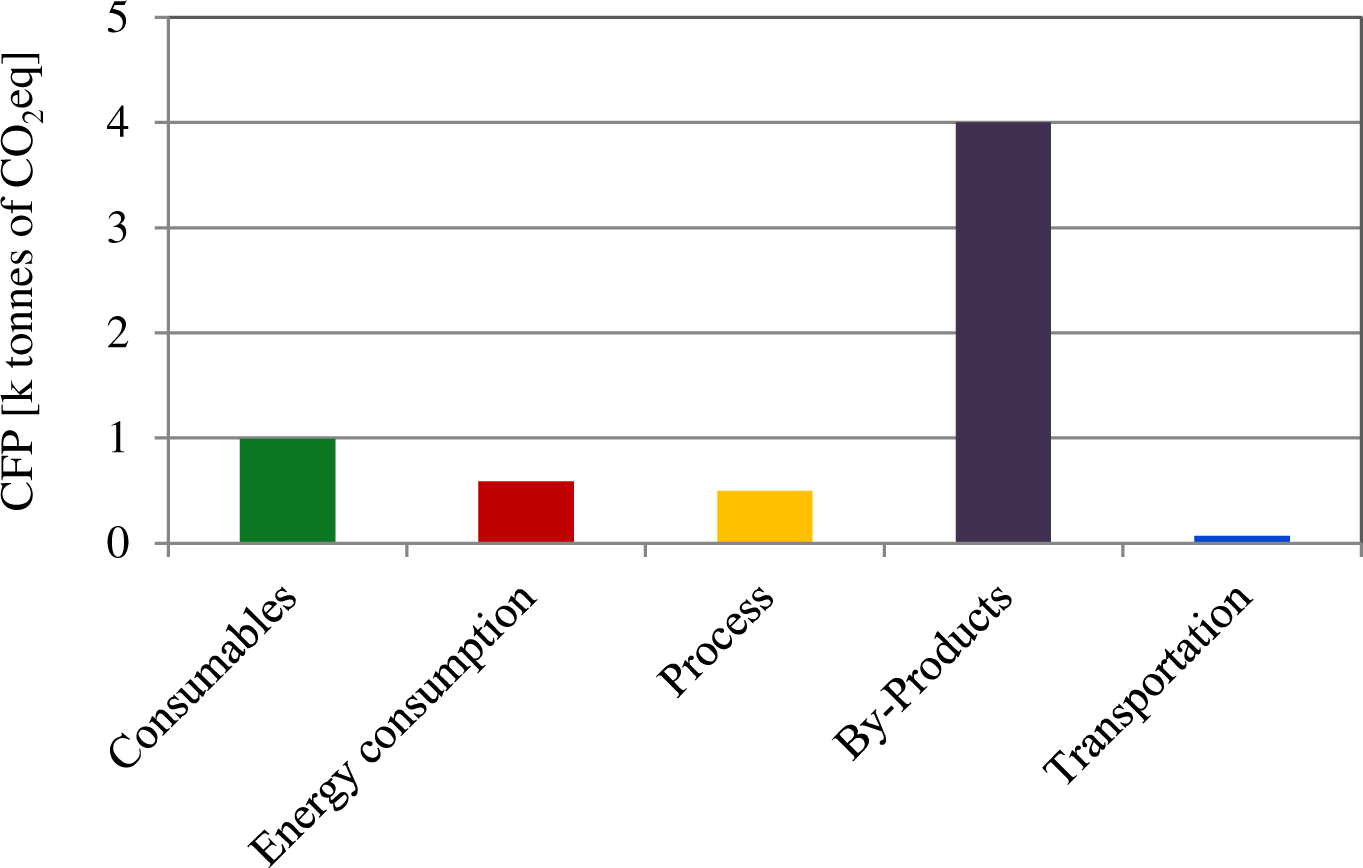
During the operation phase, by-products make the highest contribution to the CFP (4,004 t CO2eq y−1) (Figure 2), among them the DS and its landfilling were the main generators of CO2eq emissions (7,040 t DS y−1). Consumables (which mainly included chemical products, services or office supplies) generate 991 t CO2eq y−1, most of which can be attributed to the chemicals required for the wastewater treatment process. Energy consumption contributes only by 10% (588 t CO2eq y−1), and it is below the emissions linked to treatment process: 330 t CO2eq y−1 for 2,990 t y−1 of COD removed and 170 t y−1 of N nitrified. Moreover, emissions from discharge are also below the treatment process and estimated to be 180 t CO2eq for 240 t y−1 of COD discharged and 15 t y−1 of N-TNK. Transportation has a minor contribution of only 1% and it is mainly due to by-products transport.
Operation contribution of WWTP to CFP

The carbon footprint of the hypothetical WWTP + MEC plant is detailed in this section, and as in the previous scenario emissions are presented separately for the construction and the operation phases.
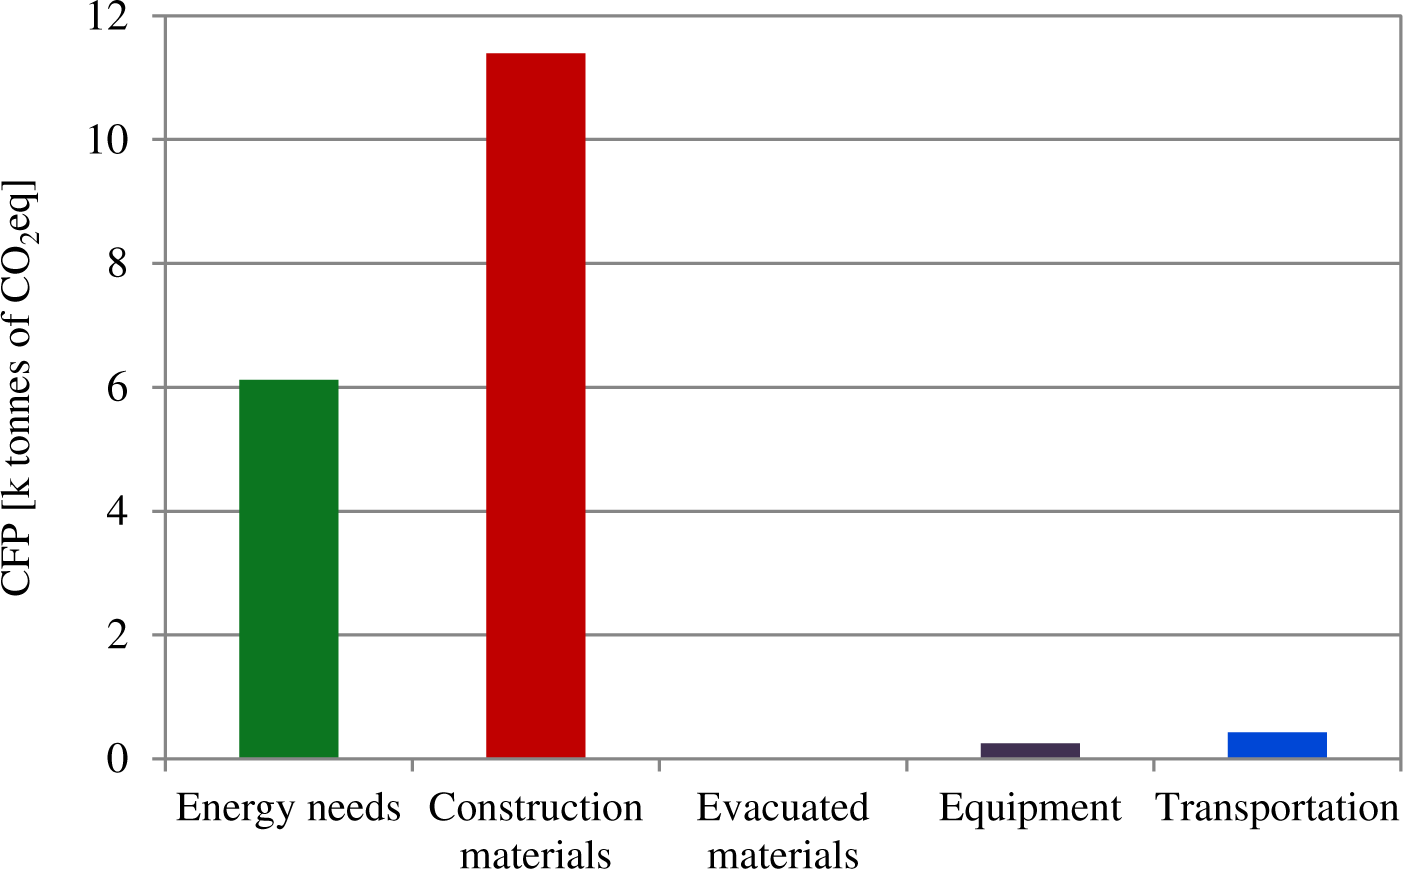
Figure 3 shows the distribution of GHG emissions generated during the construction phase which amounted to 17,765 t CO2eq. As in the WWTP scenario, construction materials have the highest impact (11,395 t CO2eq) representing 63%. The use of carbonaceous materials for the fabrication of anodes only contributes 240 t CO2eq, which represents a low amount compared to the total emissions, thus highlighting the low impact the MEC technology has on the overall system.
Similarly to the results obtained in the WWTP scenario, the energy needs contribute a 34% (6,120 of t CO2eq) to the total GHG emissions during the construction phase, and the equipment, transportation and evacuated materials make a minor contribution of only 3%.
Infrastructure contribution of WWTP + MEC to CFP

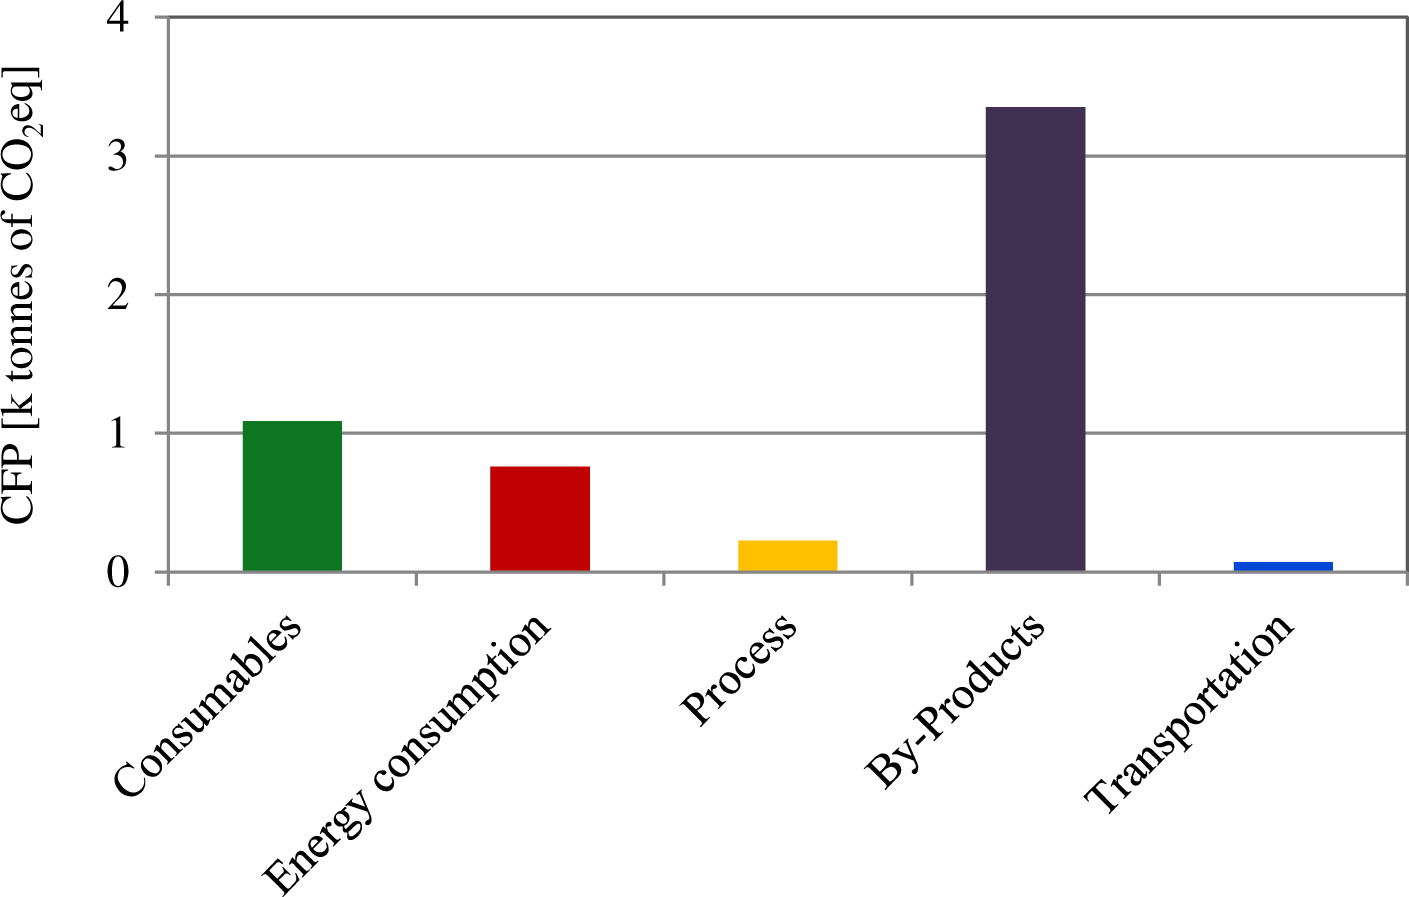
In contrast to the construction phase, the operation phase WWTP + MEC plant results in significant GHG emissions savings. On the one hand, the lower sludge generation (7,040 t DS y−1 in the WWTP scenario against the 5,914 t DS y−1 in the WWTP + MEC scenario) resulted in a reduction of emissions from 4,004 to 3,353 t CO2eq y−1 (Figure 4), which accounts for a 16% decrease in by-products management. In fact, the lesser sludge production in MECs represents an important advantage of this technology as previously shown by other authors [29]. Another source of important GHGs emissions reduction in the WWTP + MEC scenario comes from energy balance of the plant. Here, even though the emissions associated to energy usage were slightly higher than those in the WWTP scenario (759 t CO2eq y−1vs. 588 t CO2eq y−1), the biohydrogen produced in the MEC (1,373,568 Nm3 y−1), would largely compensate that by avoiding the emission of 2,267 t CO2eq y−1, and providing 37% self-sufficiency. Thus, the lower sludge generation together with the energy recovered in the MEC as biogas would allow to save up to 2,747 t CO2eq y−1 in total in the WWTP + MEC scenario. Process emissions linked to the treatment itself (COD and nitrogen removal) and to water discharge were similar to those found in the base scenario. Transportation of by-products had also a small contribution of only 1%.
Operation contribution of WWTP + MEC to CFP

This study estimates the CFP associated to a hypothetical domestic WWTP that integrates a MEC within the biological treatment. The configuration of this plant is based on a real plant located in the South of Spain. The infrastructure was found to have a strong impact on carbon footprint since 74 and 77% of greenhouse emissions came from the construction and maintenance of WWTP and WWTP + MEC, respectively. Contributions from transportation were negligible in both cases. The most significant differences between those scenarios was found in the operation, where WWTP + MEC saved over 2,700 t CO2eq y−1 emissions compared to the WWTP scenario. Most of this saving comes from the biohydrogen that can be recovered from the MEC during the treatment process. Moreover, current research on alternative materials can potentially reduce the carbon footprint of MEC technology, making the whole process more favorable. Also this kind of systems could be powered by renewable energy which would bring this approach to practical application.
The Spanish ‘Ministerio de Economía y Competitividad’ is acknowledged for the financial support of project ref: CTQ2015-68925-R (MINECO/FEDER, EU), cofinanced by FEDER Funds.
| Abbreviations | |
| CFP | Carbon Footprint |
| CO2eq | CO2 equivalent |
| COD | Chemical Oxygen Demand |
| DS | Dried Sludge |
| DWW | Domestic Wastewater |
| EI | Equivalent Inhabitants |
| GHG | Greenhouse Gas |
| LCA | Life Cycle Assessment |
| MEC | Microbial Electrolysis Cell |
| OLR | Organic Loading Rate |
| TKN | Total Kjeldhal Nitrogen |
| TP | Total Phosphorus |
| WWTP | Wastewater Treatment Plant |
- ,
Methane Emission During Municipal Wastewater Treatment ,Water Research , Vol. 46 (11),pp 3657-3670 , 2012, https://doi.org/https://doi.org/10.1016/j.watres.2012.04.024 - ,
The Growing Role of Methane in Anthropogenic Climate Change ,Environmental Research Letters , Vol. 11 (12),pp 120207 , 2016, https://doi.org/https://doi.org/10.1088/1748-9326/11/12/120207 - ,
Methane Emissions from Wastewater Management ,Environmental Pollution , Vol. 114 (2),pp 177-185 , 2001, https://doi.org/https://doi.org/10.1016/S0269-7491(00)00222-0 - ,
Global Methane and Nitrous Oxide Emissions from Terrestrial Ecosystems Due to Multiple Environmental Changes ,Ecosystem Health and Sustainability , Vol. 1 (1),pp 1-20 , 2015, https://doi.org/https://doi.org/10.1890/EHS14-0015.1 - ,
Fit-For-Purpose Wastewater Treatment: Conceptualization to Development of Decision Support Tool (I) ,Science of The Total Environment , Vol. 607-608 ,pp 600-612 , 2017, https://doi.org/https://doi.org/10.1016/j.scitotenv.2017.06.269 - ,
Linkage Analysis for the Water-Energy Nexus of City ,Applied Energy , Vol. 189 ,pp 770-779 , 2017, https://doi.org/https://doi.org/10.1016/j.apenergy.2016.04.020 - ,
Potential Use of Microbial Electrolysis Cells (Mecs) in Domestic Wastewater Treatment Plants For Energy Recovery ,Frontiers in Energy Research , Vol. 2 (Article 19),pp 1-10 , 2014, https://doi.org/https://doi.org/10.3389/fenrg.2014.00019 - , , World Energy Outlook 2018, 2018
- ,
Determination of the Internal Chemical Energy of Wastewater ,Environmental Science & Technology , Vol. 45 (2),pp 827-832 , 2010, https://doi.org/https://doi.org/10.1021/es103058w - ,
Experimental Determination of Energy Content of Unknown Organics in Municipal Wastewater Streams ,Journal of Energy Engineering , Vol. 130 (2),pp 10 , 2004, https://doi.org/https://doi.org/10.1061/(ASCE)0733-9402(2004)130:2(45) - ,
Resilience Implications of Energy Storage in Urban Water Systems ,Journal of Sustainable Development of Energy, Water and Environment Systems , Vol. 6 (4),pp 674-693 , 2018, https://doi.org/https://doi.org/10.13044/j.sdewes.d6.0210 - ,
Benchmarking South East European Cities with the Sustainable Development of Energy, Water and Environment Systems Index ,Journal of Sustainable Development of Energy, Water and Environment Systems , Vol. 6 (1),pp 162-209 , 2018, https://doi.org/https://doi.org/10.13044/j.sdewes.d5.0179 - ,
Microbial electrolysis Cells: An Emerging Technology for Wastewater Treatment and Energy Recovery. From Laboratory to Pilot Plant and Beyond ,Renewable and Sustainable Energy Reviews , Vol. 55 ,pp 942-956 , 2016, https://doi.org/https://doi.org/10.1016/j.rser.2015.11.029 - ,
Regenerable Nickel-Functionalized Activated Carbon Cathodes Enhanced by Metal Adsorption to Improve Hydrogen Production in Microbial Electrolysis Cells ,Environmental Science & Technology , Vol. 52 (12),pp 7131-7137 , 2018, https://doi.org/https://doi.org/10.1021/acs.est.7b06005 - ,
Induced Bioelectrochemical Metabolism for Bioremediation of Petroleum Refinery Wastewater: Optimization of Applied Potential and Flow of Wastewater ,Bioresource Technology , Vol. 260 ,pp 227-232 , 2018, https://doi.org/https://doi.org/10.1016/j.biortech.2018.03.122 - ,
Basséguy, R. and Erable B., Catalysis of the Hydrogen Evolution Reaction by Hydrogen Carbonate to Decrease the Voltage of Microbial Electrolysis Cell Fed with Domestic Wastewater ,Electrochimica Acta , Vol. 275 ,pp 32-39 , 2018, https://doi.org/https://doi.org/10.1016/j.electacta.2018.04.135 - ,
Bioelectrochemical Hydrogen Production from Urban Wastewater on a Pilot Scale ,Journal of Power Sources , Vol. 356 ,pp 500-509 , 2017, https://doi.org/https://doi.org/10.1016/j.jpowsour.2017.02.087 - ,
Low Temperature Domestic Wastewater Treatment in a Microbial Electrolysis Cell with 1 m2 Anodes: Towards System Scale-Up ,Fuel Cells , Vol. 17 (5),pp 584-592 , 2017, https://doi.org/https://doi.org/10.1002/fuce.201700034 - ,
Bio-Electrochemical Conversion of Industrial Wastewater-COD Combined with Downstream Methanol Synthesis – An Economic and Life Cycle Assessment ,Green Chemistry , Vol. 20 (12),pp 2742-2762 , 2018, https://doi.org/https://doi.org/10.1039/C8GC00543E - ,
Avenues to the Financial Viability of Microbial Electrolysis Cells [MEC] for Domestic Wastewater Treatment and Hydrogen Production ,International Journal of Hydrogen Energy , Vol. 44 (5),pp 2426-2434 , 2019, https://doi.org/https://doi.org/10.1016/j.ijhydene.2018.12.029 - ,
Life Cycle Assessment of High-Rate Anaerobic Treatment, Microbial Fuel Cells, and Microbial Electrolysis Cells ,Environmental Science & Technology , Vol. 44 (9),pp 3629-3637 , 2010, https://doi.org/https://doi.org/10.1021/es100125h - , Method and Device for Controlling the Activity of a Bioelectrochemical System Comprising Both a Bioanode and a Biocathode, World Intellectual Property Organization, International and National Patent Documents, WO/2016/051064, 2017
- ,
Estimating Microbial Electrolysis Cell (MEC) Investment Costs in Wastewater Treatment Plants: Case Study ,International Journal of Hydrogen Energy , Vol. 37 (24),pp 18641-18653 , 2012, https://doi.org/https://doi.org/10.1016/j.ijhydene.2012.09.157 - ,
Life Cycle Inventory Practices For Major Nitrogen, Phosphorus and Carbon Flows in Wastewater and Sludge Management Systems ,The International Journal of Life Cycle Assessment , Vol. 21 (8),pp 1197-1212 , 2016, https://doi.org/https://doi.org/10.1007/s11367-016-1095-8 - ,
Life Cycle Assessment of Urban Wastewater Systems: Quantifying the Relative Contribution of Sewer Systems ,Water Research , Vol. 77 ,pp 35-48 , 2015, https://doi.org/https://doi.org/10.1016/j.watres.2015.03.006 - , , Wastewater Engineering, Treatment and Reuse, 2003
- , , Wastewater Treatment Plant Design, 2003
- , , 2019
- ,
Carbon and Nitrogen Removal and Enhanced Methane Production in a Microbial Electrolysis Cell ,Bioresource Technology , Vol. 130 ,pp 366-371 , 2013, https://doi.org/https://doi.org/10.1016/j.biortech.2012.11.080


