The transformation of the energy system towards renewable energy sources is a widely recognised necessity by now. The increasing integration of wind and photovoltaic power plants poses challenges to the grid stability, due to the highly volatile power generation of these technologies. 44.4% of the total generated electricity from renewables was generated by wind and photovoltaic plants in the EU-28 in 2016 compared to 14.4% in 2005 [1]. The increasing discrepancy of power supply and demand has to be compensated by additional flexibility in the energy system. Enhancement of power system stability in context of increasing integration of renewable energy sources was for instance discussed in the work of Morel et al. [2]. Technological measures for providing flexibility include energy storage systems, demand-side management and the possibility of flexible power plant operation [3].
Plants that operate on biomass-based technologies, like biogas plants, are characterized by almost infinitely long storability of the energy carrier. Therefore, they have a high potential to generate power in a demand-oriented way [4]. Nowadays, the majority of biogas plants in Europe are designed to produce biogas and to generate power continuously operating as base load power plants. Combined Heat and Power (CHP) units are used to increase the total efficiency of the energy conversion from biogas to electricity and heat to around 85-90% [5].
As power generation costs are usually far higher than the prices at electricity markets, fixed feed-in tariffs for electricity generated by biogas plants are often applied by national governments. These tariffs represent fixed and guaranteed prices for the generated electricity over a certain period [6]. In the last years, several countries have implemented premium models instead of fixed feed-in tariffs for propagation of direct marketing of biogas plants. Premiums represent additional payments to the electricity market price, in order to make participation at electricity markets economically viable. They can be distinguished in fixed premiums (constant amount of premium) and sliding premiums (premium depends on electricity market price). Electricity spot markets and markets that organize control energy reserves are particularly interesting for direct marketing of biogas plants. Control energy reserves are organised by Transmission System Operators (TSO) and they are used for frequency control. Depending on the required reaction time of the power generation unit, control energy reserves can be distinguished in primary, secondary and tertiary reserves. Furthermore, they can be divided in positive (increase power on demand) or negative (decrease power on demand) reserves. Germany, as the country with the highest amount of installed power from biogas worldwide, was one of the first countries to implement incentives for demand-oriented power generation with biogas plants in the legal framework. A sliding market premium model was implemented in the Renewable Energy Sources Act (EEG) of 2012 [7] and the experience obtained in Germany has shown that integration of biogas plants in electricity markets is possible. A review on biogas and biomethane utilization in Germany with a discussion of potential alternative biogas plant concepts that meet the needs of the future energy system can be found in Daniel-Gromke et al. [8].
Various publications have dealt with the technical requirements of flexible power generation with biogas plants, e.g. the studies of Haering et al. [9] and Liebetrau et al. [10]. The economics of flexible power generation with biogas plants have also been investigated in several studies. Barchmann et al. [11] assessed the economics of optimised power generation schedules considering different feeding regimes. Hahn et al. [12] performed an economic evaluation of various concepts of demand-oriented biogas production in context of flexible power generation. Lauer et al. [13] combined an economic assessment with a Life Cycle Assessment (LCA) to evaluate the ecological impact of flexible power generation with biogas plants. An assessment of the global warming potential in course of a LCA coupled with an economic assessment of flexible power generation concepts for Austrian biogas plants was conducted by Saracevic et al. [14]. Ertem and Acheampong [15] investigated the effects of flexible power generation concepts on the heat efficiency utilization efficiency at German biogas plants. A techno-economic assessment of flexible power generation from biomass-based plants was conducted by Purkus et al. [16] highlighting potentials and obstacles in Germany and identifying decreasing price volatility as a main limitation.
Process simulation proved to be an adequate tool for investigation of the technical and economic effects of flexible power generation with biogas plants. Simulations have the advantage, that various scenarios can be investigated in a short time without the risk of costly plant malfunctions. Grim et al. [17] investigated the necessary techno-economic requirements for flexible power generation under Swedish conditions using simulations. They connected the Anaerobic Digestion Model No.1 [18] with a Dynamic Biogas plant Model (DyBim) for simulation of demand-oriented biogas production and assessed various scenarios of flexible power generation. Werlen et al. [19] performed a similar study under Swiss conditions. Ballussou et al. [20] used a model-based analysis to investigate future capacity expansion scenarios for biogas plants in Germany considering different legal frameworks. Lauven et al. [21] developed a unit commitment optimization model to assess the revenue potential of flexible biogas plants focusing on the Italian and German electricity market, concluding that economic viability of flexible power generation has decreased in the last years due to lower electricity prices and price spreads. Dynamic mathematical models together with process simulation were also used by Hvala et al. [22] for optimization of wastewater treatment plants including anaerobic digestion units.
In this study, the effects of flexible power generation on an Austrian biogas plant are assessed using an equation-oriented, flow-sheeting process simulation program. In contrast to studies like that of Grim et al. [17] and Lauer et al. [13] constant feeding was assumed and feeding strategies of the biogas plant were not optimised. Three different scenarios of flexible power generation were simulated in this work considering participation in the spot market and in markets for control energy reserves similarly to the approach used by Barchmann et al. [11] or Lauer et al. [13]. The investigated biogas plant focuses on biomethane production by biogas upgrading and waste treatment, with the possibility of generating electricity and heat with two CHP units. Plants with such a setup have not been investigated thoroughly yet in context of flexible power generation. One year of plant operation was simulated ex-post. The results of the simulation are used to assess effects on technical units of the plant and to identify potential restrictions, like limitations of the installed biogas storage capacity. Additionally, the economics of flexible power generation under Austrian conditions are investigated and discussed in context of a potential future premium system.
The biogas plant investigated in this work is an Austrian waste treatment plant that has its main focus on biomethane production by removing carbon dioxide and trace components through a gas permeation process. Additionally, the plant has two CHP units (526 kW and 836 kW) that are operated in case of malfunction or maintenance times of the biogas upgrading units. The input materials used at the biogas plant mainly consist of food and fodder industry wastes, kitchen wastes and wastes derived from the agricultural industry.
In this work, the possibility of using these units for flexible power generation while continuously producing biomethane was investigated. The biogas storage capacity installed at the plant is designed to store around 6-7 h of produced biogas under nominal conditions. The yearly production of the plant is about 4.4 Mio. m³ biogas. Heat that is generated by the CHP units is used to cover the heat demand of the biogas plant. Heat from a local district heating grid is used for heating of the fermenters and for hygienisation of the input material if the CHP units of the plant are not operated. Excess heat that is generated by the CHP units cannot be used directly at the plant or stored in the plant’s heat storage is fed into the district heating system.
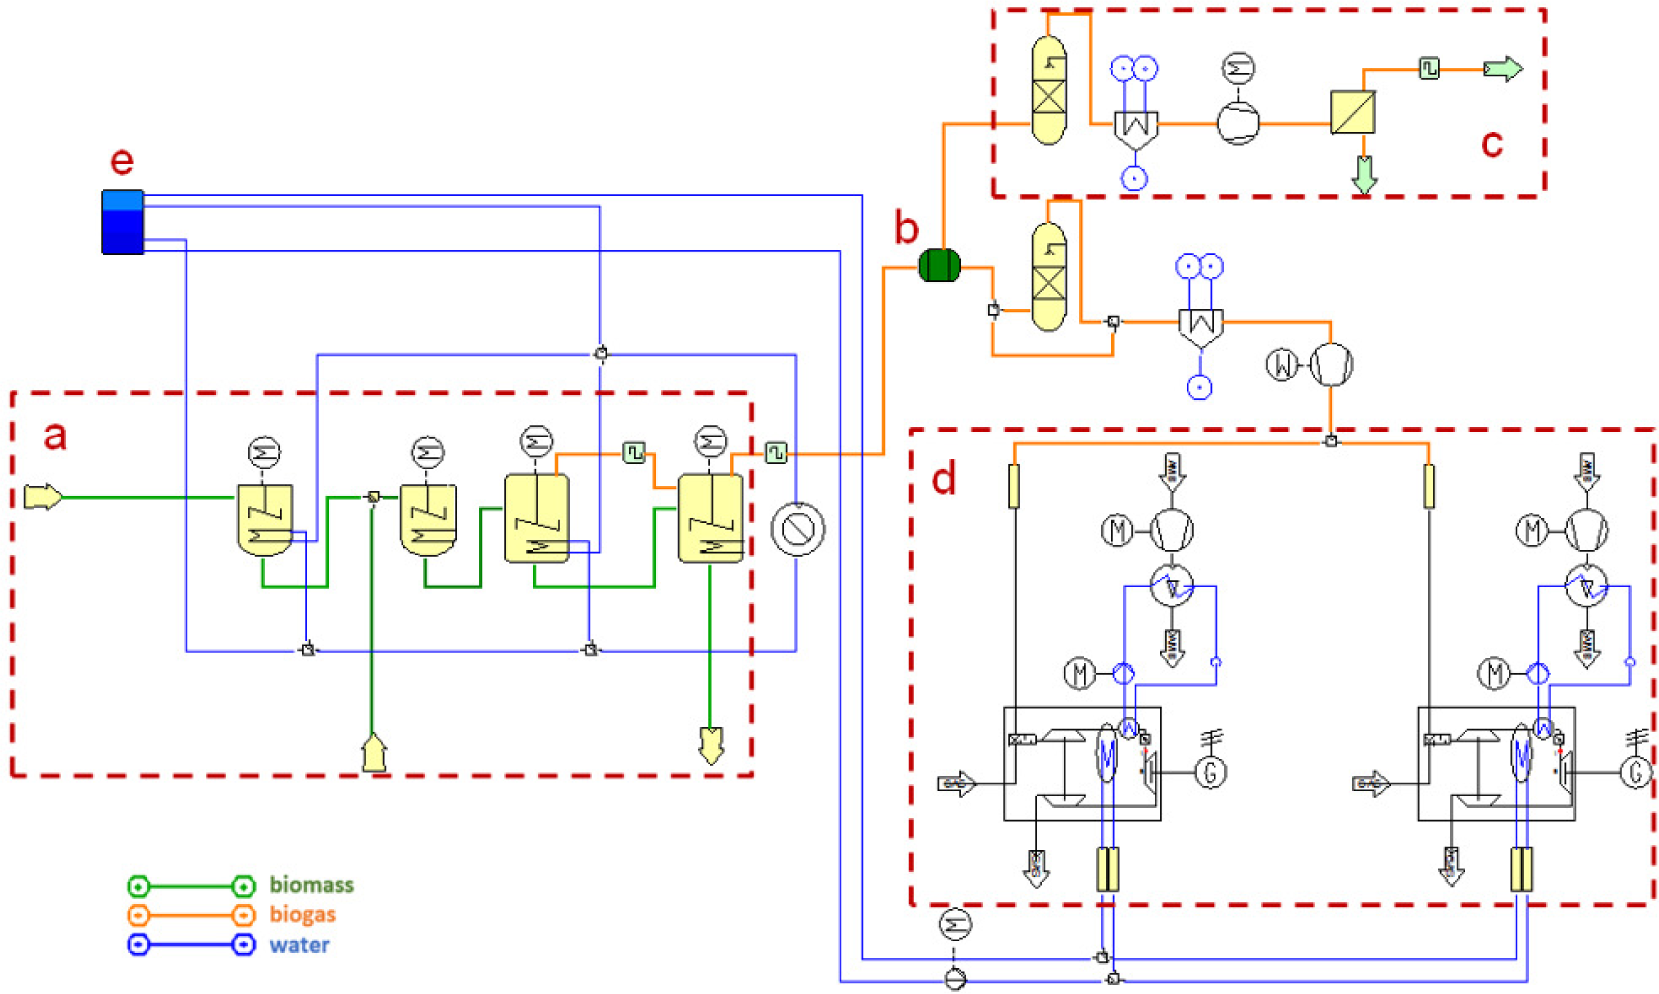
The investigated biogas plant was modelled in the process simulation program IPSEpro 7.0. It is an equation-oriented flow-sheeting program with focus on energy systems and power plant processes. The solver used for calculation bases on the Newton-Raphson algorithm and dynamic time stepping is used for time-dependent simulations. A model of the investigated biogas plant was developed in the simulation environment. The flow sheet of the simulation model is shown in Figure 1. It includes models of the biogas production units (a), biogas storage (b), biogas upgrading units (c), CHP units (d) and a simple heat storage model (e). Equations for mass and energy balance were implemented in all models. The biogas storage’s mass balance is shown in eq. (1), whereby dm/dt represents the biogas that is stored in the biogas storage, ṁIN stands for the biogas that is produced in the fermenters and transferred to the biogas storage, ṁCHP stands for the biogas that is transferred from the biogas storage to the CHP units and ṁCH4 stands for the biogas that is transferred from the storage to the biogas-upgrading units:
(1)
As a variety of input materials with different compositions is processed in the biogas plant, the amount of produced biogas and its composition vary widely. The volume flow of produced biogas varied from 219.7 to 1,252.2 mN3 in the investigated period (mid-July 2016 to mid-July 2017). The methane concentration in the biogas varied from 59.4-72.5% v/v (dry gas), the rest of the biogas was carbon dioxide with traces of hydrogen sulphide (other trace substances were neglected in the simulations). Additionally, it was assumed that the biogas was saturated with water vapour after the fermentation. The methane concentration of the produced biomethane was set to 98.1% v/v in the simulations, which corresponds to the average concentration measured at the biogas plant during the investigated period. This concentration is very constant, as the biomethane quality needs to fulfil national regulations for gas injection into the public gas grid.
A simple model of the biogas plant’s heat storage (hot water tank) was used in the simulation. The heat storage installed at the biogas plant has a capacity of 30 m³ and heat can be stored in or taken from the storage via heat exchangers, therefore the mass of water inside the tank is constant. The heat storage model registered the heat generated by the CHP units (Q̇CHP) and the heat demand of the biogas producing units (Q̇DEMAND). Heat production and heat demand curves were further evaluated after the simulation to calculate the amount of heat that can be fed into or needs to be supplied from the district heating grid. The amount of heat that is stored in the storage/fed into the district heating grid (dQ/dt positive) or has to be supplied from the district heating grid (dQ/dt negative and no heat stored in the storage) was calculated according to eq. (2). The maximum heat flow supplied to the storage from the CHP units was 1,504.4 kW, the heat demand of the biogas producing units varied from 172.4-435.47 kW.
(2)
A more detailed description of the biogas plant model can be found in Saracevic et al. [23]. Schedules for power generation can be implemented in the model as input parameters.
Flow sheet of the simulated biogas plant (a, b, c, d, e are described in the text) (adapted after [23])
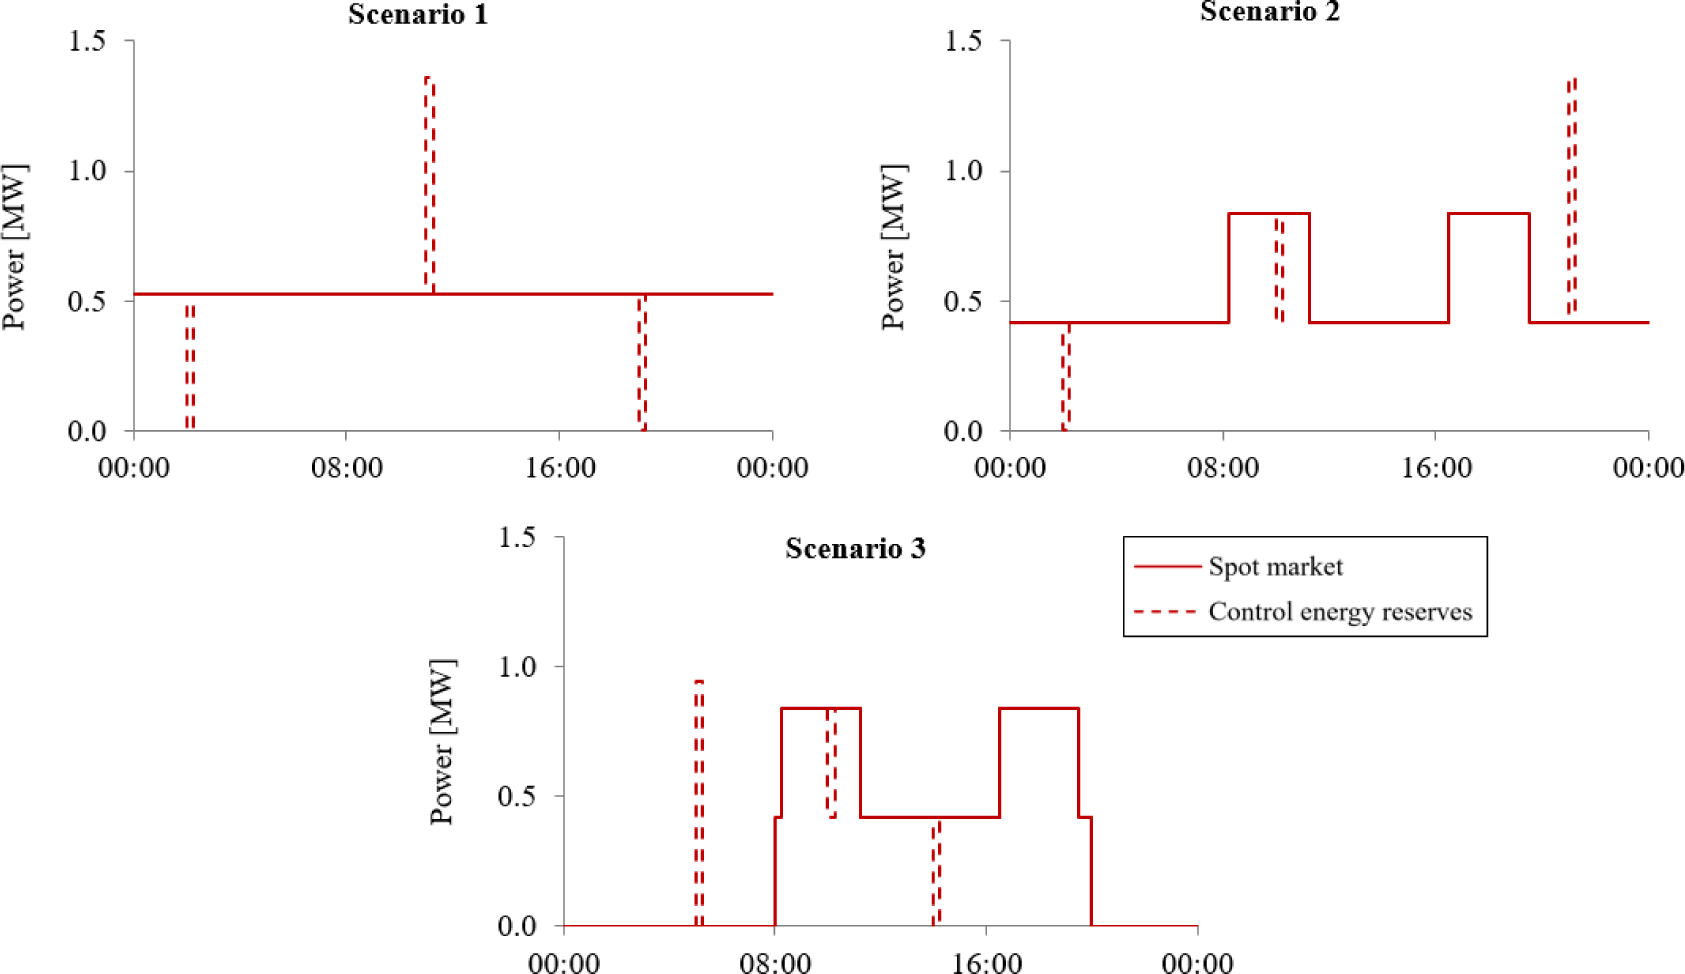
Three scenarios for flexible power generation were defined. Schematic daily power generation schedules of the scenarios are shown in Figure 2 and they were implemented in the simulation model of the biogas plant. The scenarios consider participation in the spot market and in markets that organize secondary control energy reserves. Control energy reserves have to be held available by the plant operator at all times and the required reaction time of the power generation units at markets for secondary control energy reserves is 5 minutes. Revenues from participating in markets for control energy reserves can be obtained by the power price (compensation for holding power capacity available) and the energy price (revenue for actually provided reserve). In the simulations, it was assumed that power was generated according to a power generation schedule, while biogas was continuously upgraded to biomethane. Continuous biomethane production is necessary due to biomethane delivery contracts that have to be fulfilled.
In scenario 1 and 2 it was assumed that one CHP unit is continuously generating power and providing negative control energy reserves, while the other unit is only used to provide positive control energy reserves. The advantage of this scenario is that the engines do not have to be started frequently (except when control reserves are activated), which reduces the mechanical exposure of the engines. Additionally, in scenario 2 a demand-oriented power generation profile was assumed with higher power generation from 08:00-11:30 and 16:30-20:00. The reason for this is that the prices at the spot market tend to be higher during these times and therefore higher revenues can be expected. Scenario 3 assumed demand-oriented power generation with one engine too, but only from 08:00-20:00. The advantage of this scenario is that power generation is avoided during times, when electricity prices are low, but it has the negative effect of increased mechanical exposure of the engines due to more starts. Additionally, heat has to be taken from the district heating grid to cover the heat demand of the biogas plant in times when CHP units are not operated. The plant’s heat storage capacity is not sufficient to store all of the excess heat generated in times, when CHP units are operated and to cover the total heat demand, when CHP units are not operated, which results in additional heat costs for this scenario.
In addition to the three scenarios that consider a power generation schedule while continuously producing biomethane, a reference scenario was simulated that represents the current state of operation of the plant (biomethane production only without power generation). The three scenarios with power generation were compared to this reference scenario to assess economic and technical effects of flexible power generation.
Schematic daily schedules of power generation of the investigated scenarios
The described scenarios were simulated ex-post assessing one year of plant operation (mid-July 2016 to mid-July 2017). Participation at the intraday market and the market for secondary control energy reserves was assumed and published data from the EPEX spot market [24], the internet platform for allocation of control energy reserves [25] and the Austrian transmission system operator (APG) [26] was used for economic evaluations. An energy price of 200 EUR/MWh and 45 EUR/MWh was considered for participation at the market for secondary positive and negative control energy reserves, respectively. The average power price that was granted at every weekly tender for control energy reserves was used. Experience has also shown that the TSO typically activates secondary control energy reserves for a shorter period than the maximum of 15 minutes. In this work, it was assumed that the duration of every call-off order was 3 minutes, which corresponds to information obtained by a virtual power plant operator. Additionally, it was assumed that the total provided reserve was called off whenever control energy reserves were activated (which does not necessarily have to be the case). Further key parameters of the economic assessment are summarized in Table 1. CHP unit start-up costs consider the engine life span loss due to the increased mechanical exposure during an engine start. If heat is taken from the local district heating grid then heat costs are taken into account, if excess heat generated by the CHP units is supplied to the district heating grid then heat revenues are considered. The biomethane price can unfortunately not be stated due to secrecy reasons, but was chosen at a level so that the reference scenario is on the limit of profitability according to the plant operator.
A biogas storage capacity of 4,800 m³ was used in the simulations. According to information of the plant operator, the usable range of the gas storage volume lies between 5 and about 80% of the maximum capacity. This range considers a reserve that has to be kept in case of malfunctions or maintenance times of the biogas upgrading units and to avoid negative pressures in the system. This was also considered in the simulations. The biogas storage level at the beginning of the simulation was set to be half of the maximum level for each of the simulated months. The CHP units start-up procedure time was assumed to be three minutes from standstill to full-load.
Key parameters of the economic assessment
| Parameter | Value |
|---|---|
| Electricity cost [EUR/MWh] | 60 |
| Heat cost [EUR/MWh] | 55 |
| Heat revenue [EUR/MWh] | 40 |
| CHP unit start-up cost [EUR] | 10 |
| CHP unit maintenance cost [EUR/h] | 16.5 |
| Power grid utilization cost [EUR/MWh] | 1.76 |
The following chapters show the results of the techno-economic assessment for the three investigated power generation scenarios. Economic results as well as the effects on needed biogas storage capacities and CHP units while generating power flexibly are presented.
The economic results of the assessment performed in this work are shown in Figure 3. The lower diagram shows the difference in profit between the three scenarios with power generation and the reference scenario, which was assumed to be at the limit of profitability. The Additional Profit (AP) was calculated by comparing variable costs and revenues of the simulated scenarios (PVAR,FLEX) to that of the reference scenario (PVAR,REF) according to eqs. (3-5). Variable revenues include revenues from sale of biomethane (RCH4), from covering the plant’s heat (RHEAT,SUB) and electricity (RELEC,SUB) demand, from participation in the electricity spot market (RSPOT) and in markets for control energy reserves (RCONT) and from suppling heat to the district heating grid (RHEAT,DIST). Variable costs include operational and maintenance costs of the biogas upgrading units (CCH4,OP) and CHP units (CCHP,OP), CHP unit start-up costs (CCHP,START) and electricity grid utilization costs (CGRID):
(3)
(4)
(5)
It can be seen that all of the three scenarios perform economically worse than the reference scenario. This is no surprising result as the electricity spot market price at the time of the study was far less than the price for biomethane and the feed-in tariffs for biogas plants. The average electricity price at the EPEX spot intraday market during the simulated period was 34.7 EUR/MWh (weighted average), whereas the feed-in tariff for electricity from biogas plants in Austria is 189.7 EUR/MWh (209.7 EUR/MWh for plants with a particularly high heat utilization) [6]. However, it can be seen that participation in the markets for secondary control energy reserves increases the profitability in most of the simulated months.
Economic comparison of the three scenarios with power generation and the reference scenario (upper diagram: required premium in EUR per MWh traded at the spot market, lower diagram: additional profit that can be generated by flexible power generation, filled bars: simulation results for participation in the spot market and the markets for control energy reserves, dashed bars: contribution of participation in the markets for control energy reserves to the results)
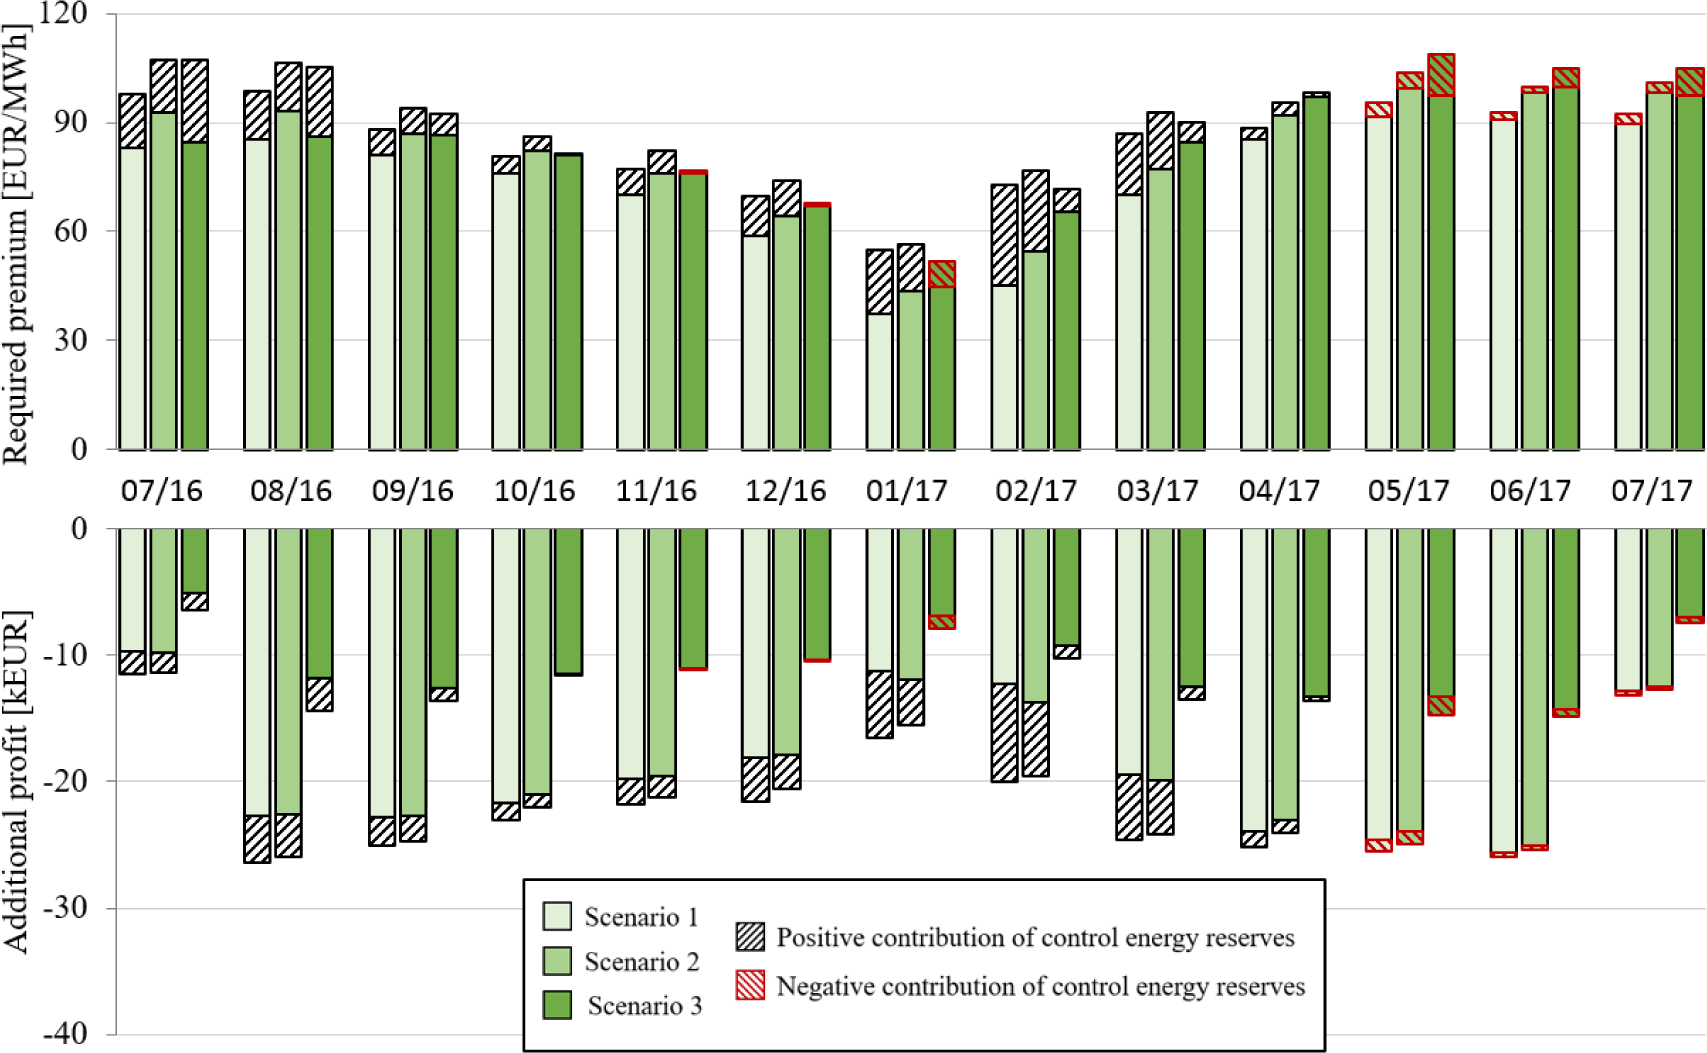
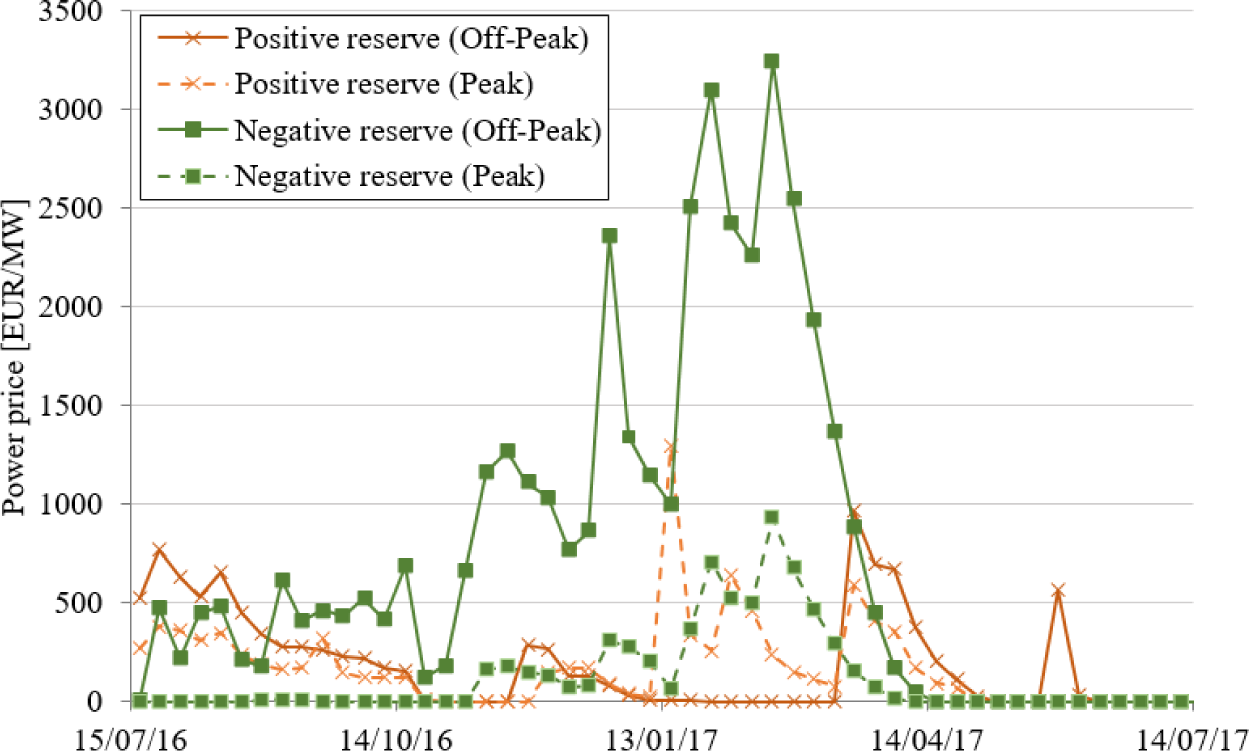
These profits are not sufficient to make the scenarios more profitable than the reference scenario, but they lead to additional revenues. For some of the simulated scenarios and months participation at the control energy market lead to worse results than without participation (indicated by the red coloured dashed bars in Figure 3), especially in the months January, May, June and July of the year 2017. The main reason for this are low power prices at the market for secondary control energy reserves during these periods, as can be seen in Figure 4, where the development of the average approved power price is shown. The power price contributes significantly to the profitability when providing control energy reserves, which corresponds to the findings of Saracevic et al. [27].
Development of the power price at the markets for secondary control energy reserves in the simulated period (adapted after [18])
The upper diagram of Figure 3 shows the amount of premium that is needed to make the simulated scenario as profitable as the reference scenario. This provides a better approach for the economic comparison of the scenarios, as the amount of generated electricity was different for each investigated scenario. The Required Premium (RP) was calculated according to eq. (6) by dividing the absolute value of the AP shown in the lower diagram of Figure 3 by the amount of electricity (ESPOT) traded at the electricity spot market:
(6)
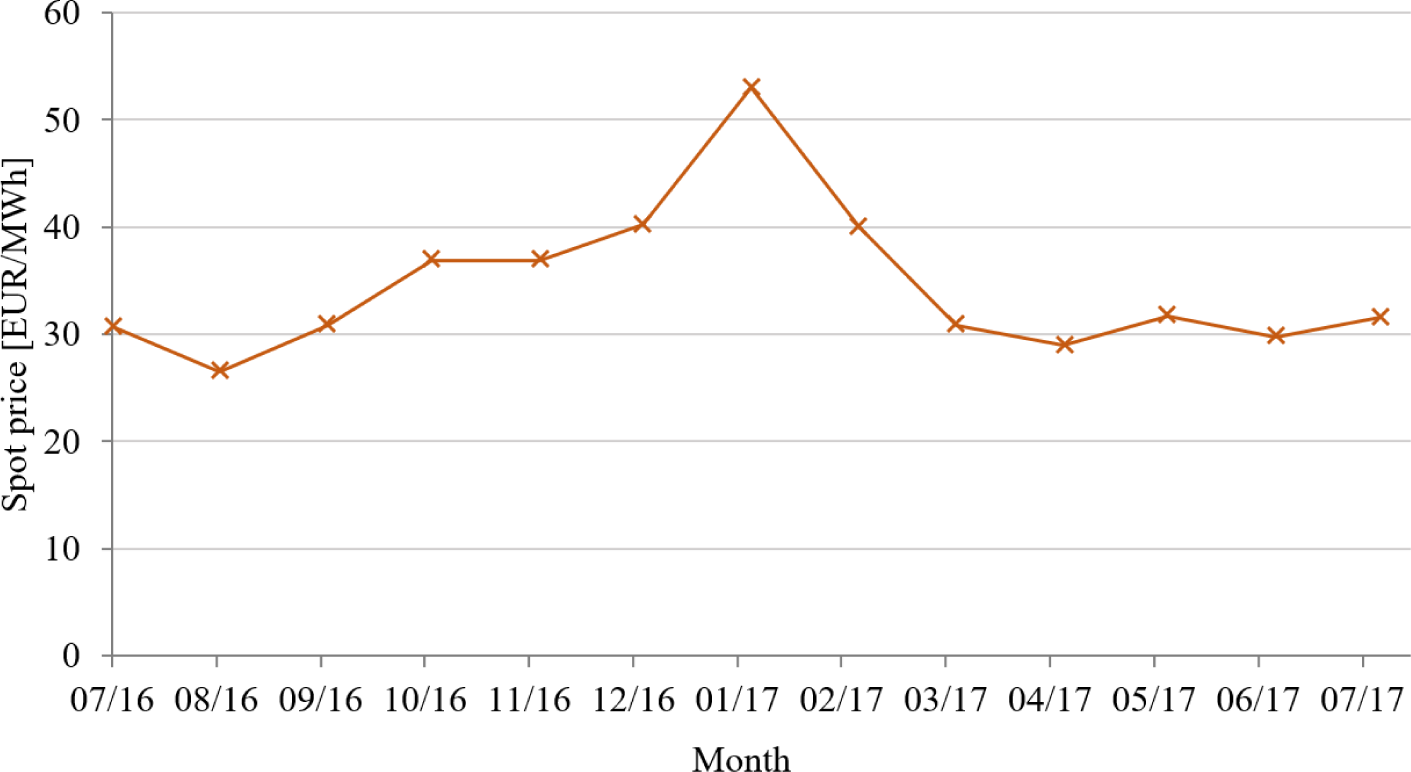
The needed premium lies in the range of 37.3-99.9 EUR/MWh, if participation in the markets for control energy reserves was only assumed in months when revenues could be generated from these markets. Two main observations can be made: the first one is that scenario 2 and 3 with demand-oriented power generation profiles and power generation primarily during peak times do not seem to be economically superior to scenario 1 with a constant power generation profile. Revenues from providing control energy reserves reduce the needed premium for most of the investigated cases. The second observation is that the profitability of the scenarios increased during colder times of the year with the best performance in January 2017. This can be explained by better heat utilization during these periods. In the simulations, it was assumed that the generated heat is primarily used to cover the heat demand of the biogas plant. Heat is mainly needed for input material hygienisation and heating of the fermenters. It was assumed that 80% of the heat that cannot be used at the biogas plant or stored in the heat storage is sold and used for external heat utilization purposes, e.g. for local district heating. The remaining 20% of the heat was considered as losses. Another reason for the better economic results during colder months is the electricity spot market price, which was considerably higher during these months, as can be seen in Figure 5.
Development of the average monthly price at the EPEX Intraday spot market during the simulated period (adapted after [24])
Sufficient biogas storage capacity is of particular importance when generating power flexibly with biogas plants. This is especially the case when control energy reserves are provided, as the biogas plant operator does not know beforehand when control reserves will be activated by the TSO. For this reason, the scenarios were simulated in two ways, with and without providing control energy reserves. The aim was to evaluate if the installed biogas storage capacity is sufficient for providing control energy reserves, while participating at the electricity spot market and continuously producing biomethane.
The results show that the installed gas storage capacity was sufficient for almost all of the investigated scenarios and months. It was possible to compensate fluctuations and times of low biogas production with the installed storage capacity. The only month, where the simulations showed that the capacity was insufficient, was January 2017, as can be seen in Figure 6.
Simulation results for scenario 3 in January 2017 (left diagram: biogas storage level, right diagram: power generation profile)
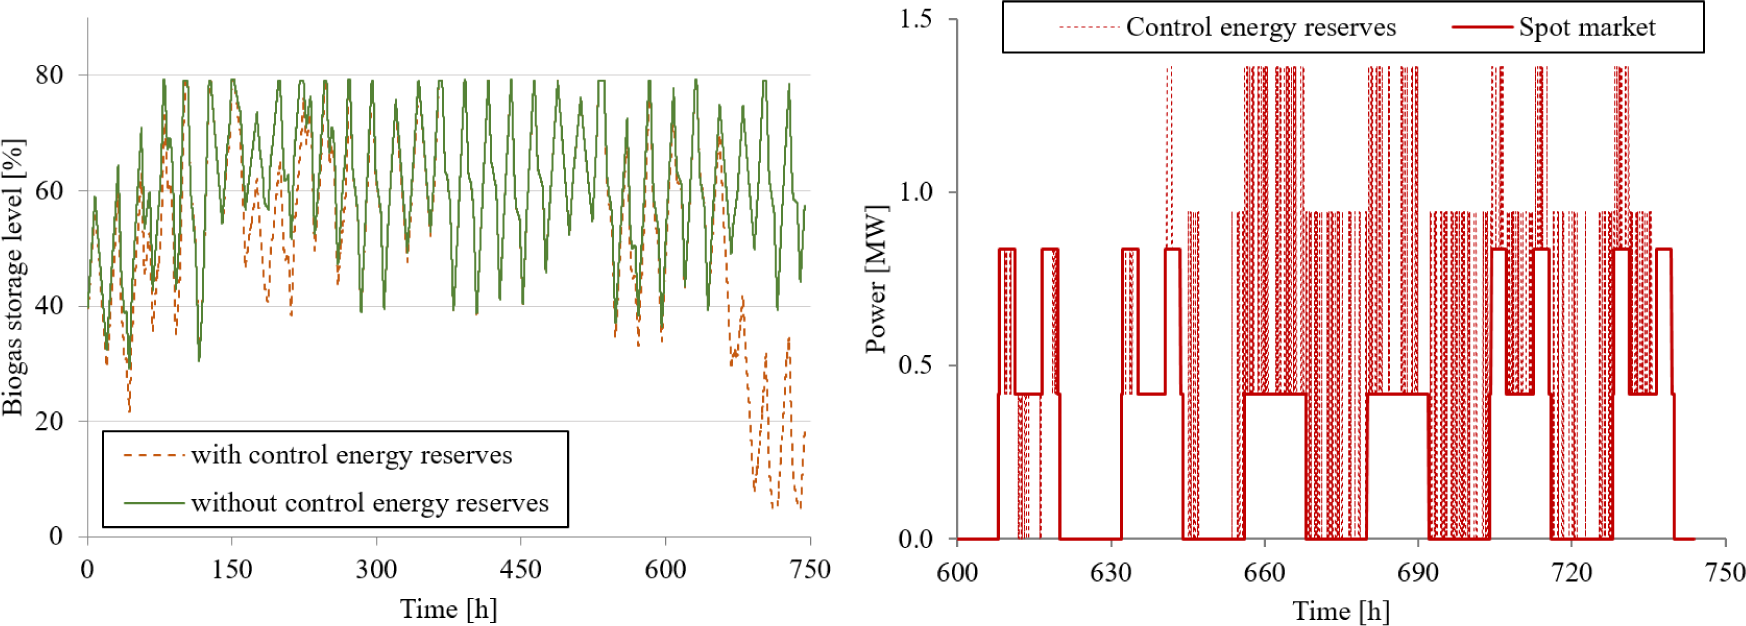
The left diagram shows the biogas storage level during this month for scenario 3 and it can be seen that the biogas storage level reached the minimum of 5% of the maximum storage level at the end of the month. This was the case for all three simulated scenarios with power generation in January 2017. The explanation for this can be seen in the right diagram of Figure 6, where the power generation profile during this period is shown. At the end of the month, positive secondary control energy reserves were activated very frequently. This led to an insufficient biogas supply for biomethane production while simultaneously generating power according to the power generation schedule.
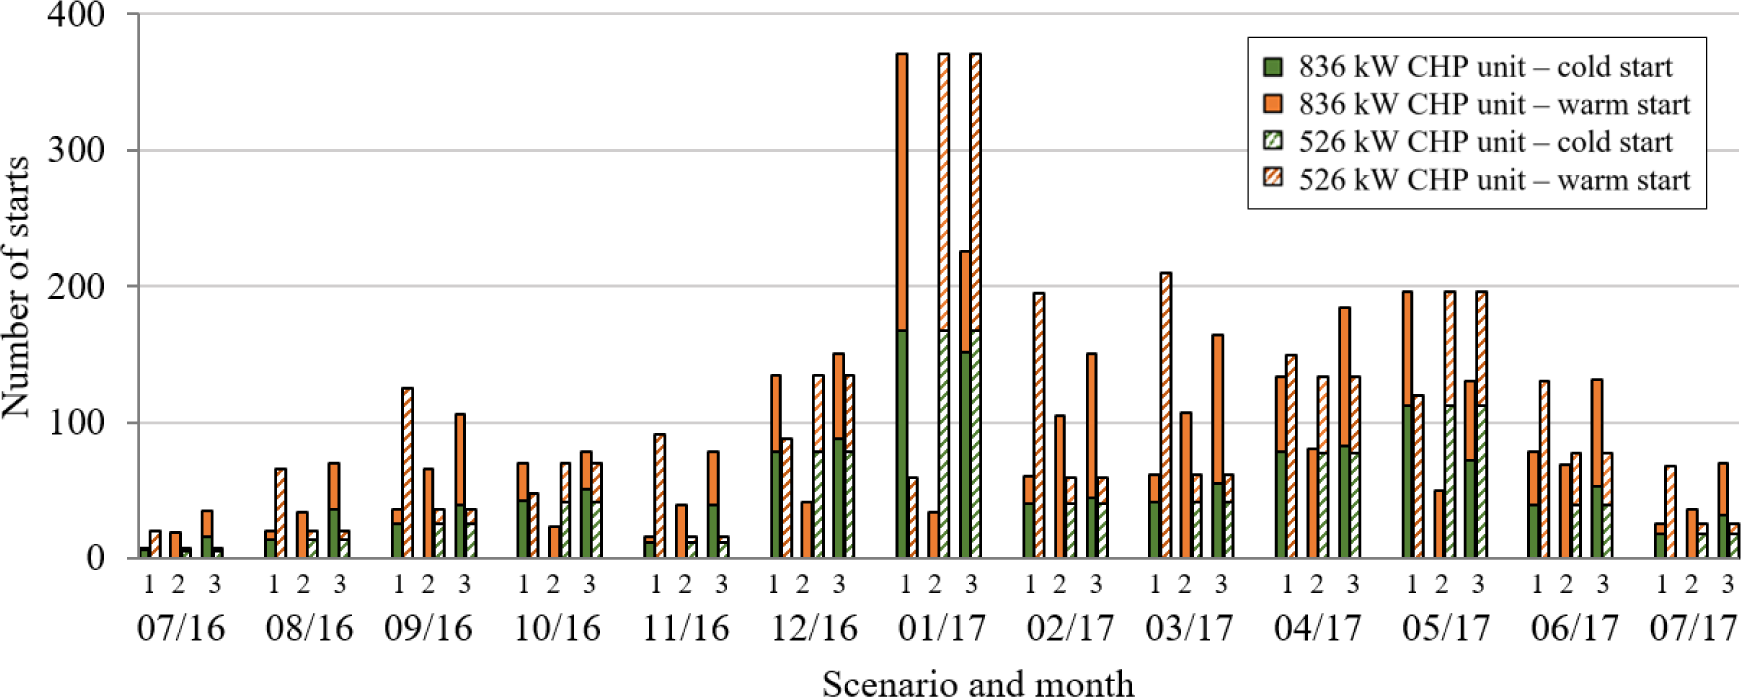
The effects on the CHP units when generating power flexibly were also assessed. The CHP units are exposed to increased mechanical stresses during participation in the spot market and in markets for control energy reserves. Partial-load operation and an increased number of starts lead to excessive wear of the technical components and therefore a decreased lifespan of the engines. This also leads to increased CHP unit maintenance costs. Figure 7 shows the number of starts during the simulated scenarios and months. A start was defined as a cold start when the engine was not operated in the quarter-hour before the start and as a warm start otherwise. Every start of an engine reduces its lifespan. Therefore, start-up costs were considered in the economic evaluation as can be seen in Table 1. Full start-up costs were assumed for a cold start and half costs for a warm start.
Scenario 3 had the highest amount of cold starts among the investigated scenarios, as was expected due to the demand-oriented power generation profile. The number of starts depends mainly on the amount of call-off orders for control energy reserves. January 2017 was the month with the highest amount of activated control energy reserve and therefore the number of starts was also highest for this month. The simulation results showed a total number of CHP unit starts of 2,582, 1,916 and 2,787 per year for scenarios 1, 2 and 3, respectively. This results in economically considerable CHP unit start-up costs ranging between 10-20 kEUR per year (see Table 1). It is of economic interest for biogas plant operators to minimize start-up and maintenance costs of the CHP units. Measures for reduction of the mechanical exposure during partial-load operation and start-up procedures are discussed in the next chapter.
Number of engine starts for simulated scenarios and months
The simulation results showed that participation in the spot market with the investigated biogas plants yielded economically worse results than the investigated reference scenario during the simulated period as electricity spot market prices and spreads between peak and off-peak prices were too low. This corresponds to findings of similar studies [17], [19], where it was concluded that increased fluctuations of the electricity price, subsidies or optimization of the plant design are needed for economic viability of flexible power generation.
In Austria, fixed feed-in tariffs for promotion of base load power generation are granted to biogas plants that fulfil the criteria defined in the green electricity act [28]. Most of the 287 biogas plants [29] that are currently operated in Austria were built in the years 2003-2007 and they signed contracts that guaranteed fixed feed-in tariffs for 13 years [30]. This implies that the contractual periods end in the next years for most of the biogas plants or have already ended. In 2017, an amendment of the green electricity act [31] was introduced that regulates subsequent feed-in tariffs for biogas plants and that introduces first incentives for market integration of biogas plants as newly installed biogas plants have to prove remote controllability of power generation. This might be a first step towards a potential future premium system in Austria.
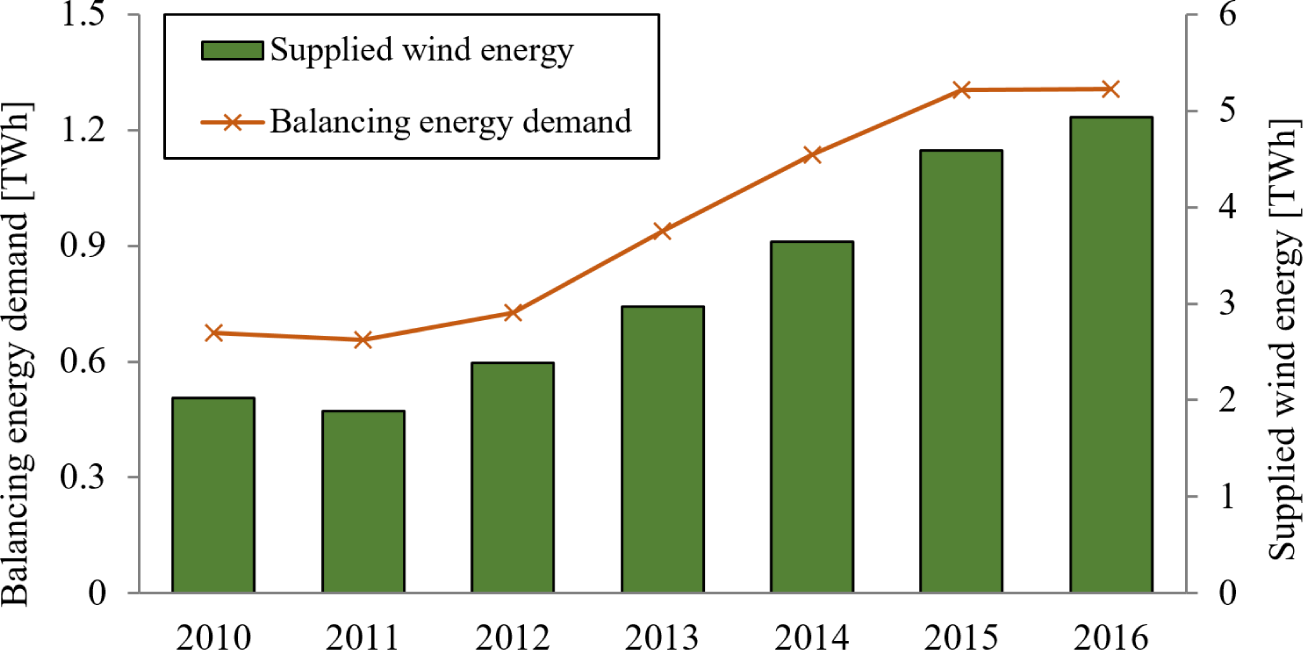
Several countries in Europe have implemented premium systems for biogas plants to promote demand-oriented power generation and participation in electricity markets that focus on balancing power supply and demand. It is expected that the number of countries that promote demand-oriented power generation with biogas plants through feed-in premiums will increase due to the climate targets stipulated by the European Commission [32]. Furthermore, the importance of demand-oriented power generation and the balancing energy demand are expected to increase with advancing integration of renewable energy sources [33]. Figure 8 shows the development of the balancing energy demand in Austria from 2010 to 2016. The demand increased almost proportionally to the expansion of wind power plants in the observed period and it is expected that it will further rise in future. Therefore, additional power plants, which operate on renewable energy sources and provide balancing energy, will be needed and here biogas plants can play an important role.
Development of supplied wind energy and balancing energy demand in Austria from 2010 to 2016 (adapted after [29])
The needed premium to make the three simulated scenarios with flexible power generation as profitable as the reference scenario, which was assumed to be at the limit of profitability, ranged from 37.3-99.9 EUR/MWh. These values are rather low if compared to premiums calculated in similar studies. A required premium of 158.1-217.3 EUR/MWh for newly built biogas plants was calculated in the study of Saracevic et al. [14]. The difference between the feed-in tariff for electricity from biogas plants in Austria and the average electricity price at the EPEX spot intraday market during the simulated period was 155.0 EUR/MWh (175.0 EUR/MWh for biogas plants with a particularly high heat utilization). The premiums calculated in this work are considerably lower because no investments are needed at the biogas plant for flexible power generation, as CHP units are already installed at the plant and the installed biogas storage capacity proved to be sufficient for almost all of the simulated cases.
The circumstance that scenarios 2 and 3 with a demand-oriented power generation profile did not show better economic results than scenario 1 with a constant profile, can be explained by low price fluctuations during the day at the intraday market. The spread between peak and off-peak prices at the intraday market shows a declining trend in the last years making demand-oriented power generation economically less attractive. Additional revenues that are obtained by generating electricity mainly in peak times are not sufficient to exceed the additional costs that accompany flexible power generation, e.g. start-up or maintenance costs of the CHP units. Nevertheless, some studies predict that fluctuations at electricity markets will increase in the coming years due to increasing integration of renewables in the energy system [34]-[36]. Additionally, it proved to be possible to generate additional revenues by participating in markets for secondary control energy reserves in most of the simulated months.
The installed biogas storage capacity was sufficient to provide control energy reserves while continuously producing biomethane and generating power according to the power generation schedule for almost all simulated cases. Only at the end of January 2017, when positive control energy reserves were activated very frequently and the biogas storage level reached the minimum, biogas supply proved to be insufficient. Adaptions of the plant operation are needed in times like these to ensure biogas supply for power generation. These could include a short-termed increase of the biogas production by feeding of easily degradable substrates. The feasibility of demand-oriented feeding management has already been proven in several studies [37], [38]. Alternatively, the biomethane production capacity could be reduced. Extreme situations could even lead to the necessity of shutting the biogas upgrading units down, although this could lead to difficulties with biomethane customers. There is also the possibility of not participating in the markets for positive control energy reserves if biogas supply cannot be guaranteed.
It is important to ensure that gas lines and the biogas storage are sufficiently dimensioned for increased biogas flow rates during flexible power generation. Higher biogas storage outflow rates can lead to sudden pressure drops in the biogas storage, which leads to problems for the storage stability. Comparison to manufacturer data showed that the gas lines and the biogas storage of the investigated biogas plant are adequately dimensioned for the increased flow rates.
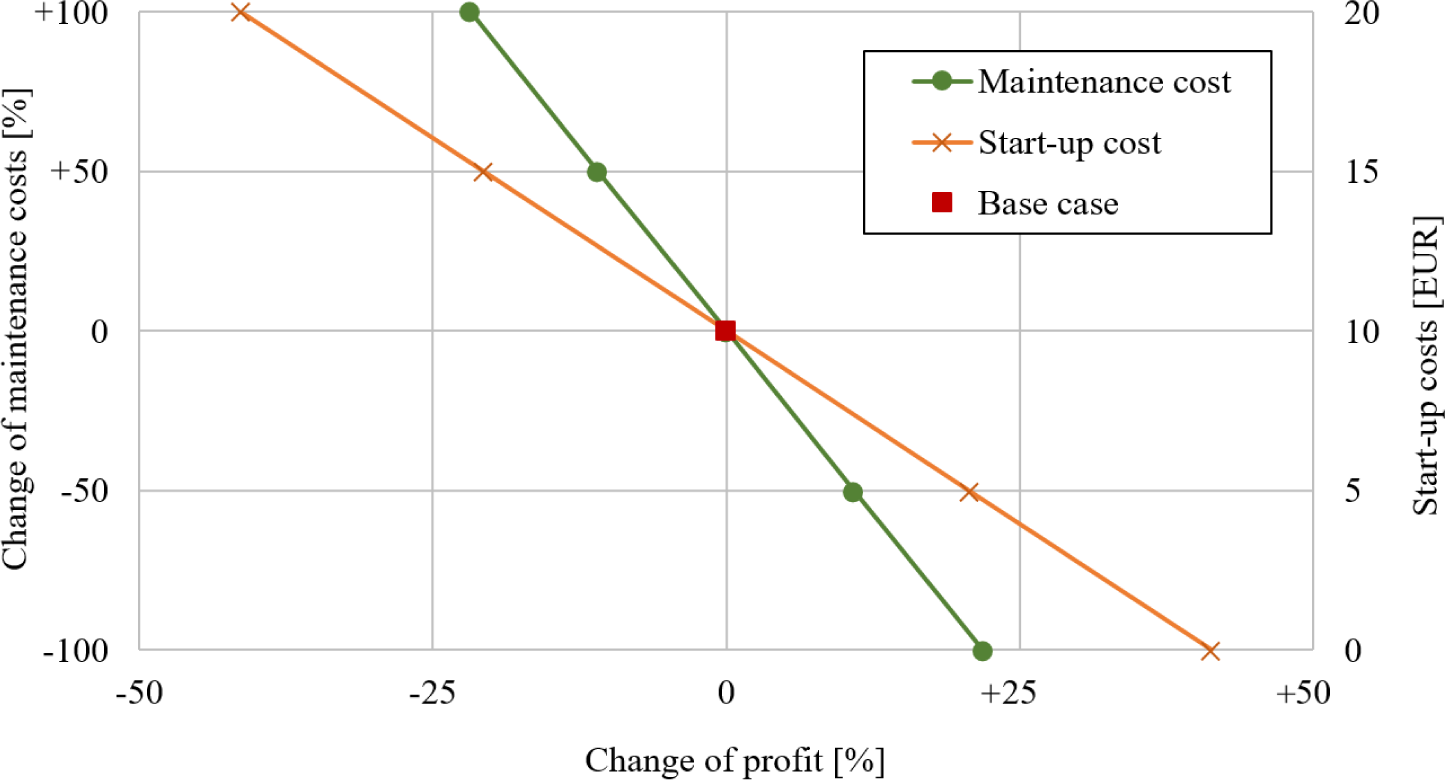
Flexible power generation leads to higher mechanical exposure of the CHP units due to partial-load operation of the engines and an increased number of starts. Figure 9 exemplarily shows the results of a sensitivity analysis regarding maintenance and start-up costs of the CHP units for scenario 3 in January 2017. It can be seen that these costs have a considerable influence on the profitability of the simulated scenarios and therefore it is of high interest to reduce them. Measures to reduce mechanical stresses during the start-up procedure include pre-heating and pre-greasing of the engines as well as the use of appropriate starting systems [9]. The mechanical exposure during a warm start is considerably lower than during a cold start, thus pre-heating is recommended to reduce start-up costs and increase the lifespan of the CHP unit when generating power flexibly.
Sensitivity analysis regarding CHP unit operation costs for scenario 3 (January 2017)
Three scenarios for flexible power generation while continuously producing biomethane with an Austrian biogas plant were simulated ex-post and evaluated regarding economic and technical feasibility. The scenarios did not prove to be more profitable than the reference scenario that assumed only biomethane production as the electricity price on the intraday spot market was not sufficient to compete with the price for biomethane or existing feed-in tariffs. An appropriate supporting scheme, like a feed-in premium system, is needed to make participation in electricity markets economically viable. The needed premium for the scenarios investigated in this work was 37.3-99.9 EUR/MWh.
Scenarios with a demand-oriented power generation profile did not show better economic results than scenarios with constant power generation. This is mainly caused by low price fluctuations during the day at the spot market. Additional revenues were obtained by participating in the markets for secondary control energy reserves during most of the simulated months. However, low power prices can also lead to unprofitable results.
The results show that the change of operation to flexible power generation does not require major technical adaptions, as the installed biogas storage capacity and gas lines at the biogas plant were sufficient for almost all simulated cases. The biogas storage capacity was insufficient only during one period when positive secondary control energy reserves were activated very frequently. Adaptions of the biogas or biomethane production strategy are necessary during times like these to ensure biogas supply for power generation. The results of a sensitivity analysis showed that CHP unit start-up and maintenance costs considerably affect the profitability of the scenarios and therefore they should be minimized.
This work was done in course of the project Bio(FLEX)Net supported by the Austrian Research Promotion Agency (FFG).
- ,
Renewable Energy in Europe 2018 – Recent Growth and Knock-on Effects, Report No. 20 , 2018 - ,
Stability Enhancement of a Power System Containing High-Penetration Intermittent Renewable Generation ,Journal of Sustainable Development of Energy, Water and Environment Systems , Vol. 3 (2),pp 151-162 , 2015, https://doi.org/https://doi.org/10.13044/j.sdewes.2015.03.0012 - ,
A Novel Role for Bioenergy: A Flexible, Demand-Oriented Power Supply ,Energy , Vol. 61 ,pp 18-26 , 2013, https://doi.org/https://doi.org/10.1016/j.energy.2012.12.053 - ,
Flexible Use of Bioenergy as a Key Element for the Integration of Renewable Energies into the Energy System (in German) ,Umwelt Wirtschafts Forum , Vol. 22 (1),pp 71-78 , 2014 - ,
, Faustzahlen Biogas , 2013 - ,
An Overview of Feed-In Tariffs, Premiums and Tenders to Promote Electricity from Biogas in the EU-28 ,Renewable and Sustainable Energy Reviews , Vol. 73 ,pp 1366-1379 , 2017, https://doi.org/https://doi.org/10.1016/j.rser.2017.01.132 - ,
Nature Conservation and Nuclear Safety (BMU), Act on Granting Priority to Renewable Energy Sources (Renewable Energy Sources Act – EEG) , 2011 - ,
Current Developments in Production and Utilization of Biogas and Biomethane in Germany ,Chemie Ingenieur Technik , Vol. 90 (1-2),pp 17-35 , 2018, https://doi.org/https://doi.org/10.1111/woba.5493 - ,
Technical Requirements for Biogas Plants for Flexible Power Generation (in German) , 2013 - ,
Flexible Power Generation from Biogas ,Smart Bioenergy , 2015, https://doi.org/https://doi.org/10.1007/978-3-319-16193-8_5 - ,
Expanding the Flexibility of Biogas Plants – Substrate Management, Schedule Synthesis and Economic Assessment ,Agricultural Engineering , Vol. 71 (6),pp 233-251 , 2016, https://doi.org/https://doi.org/10.15150/lt.2016.3146 - ,
Cost Analysis of Concepts for a Demand Oriented Biogas Supply for Flexible Power Generation ,Bioresource Technology , Vol. 170 ,pp 211-220 , 2014, https://doi.org/https://doi.org/10.1016/j.biortech.2014.07.085 - ,
Flexible Power Generation Scenarios for Biogas Plants Operated in Germany: Impacts on Economic Viability and GHG Emissions ,International Journal of Energy Research , Vol. 41 (1),pp 63-80 , 2017, https://doi.org/https://doi.org/10.1002/er.3592 - ,
Economic and Global Warming Potential Assessment of Flexible Power Generation with Biogas Plants ,Sustainability , Vol. 11 (9),pp 2530-2553 , 2019, https://doi.org/https://doi.org/10.3390/su11092530 - ,
Impacts of Demand-Driven Energy Production Concept on the Heat Utilization Efficiency at Biogas Plants: Heat Waste and Flexible Heat Production ,Process Integration and Optimization for Sustainability , Vol. 2 (1),pp 1-16 , 2018, https://doi.org/https://doi.org/10.1007/s41660-017-0024-z - ,
Contributions of Flexible Power Generation from Biomass to a Secure and Cost-Effective Electricity Supply—A Review of Potentials, Incentives and Obstacles in Germany ,Sustainability and Society , Vol. 8 (18),pp 1-21 , 2018, https://doi.org/https://doi.org/10.1186/s13705-018-0157-0 - ,
Demand-Orientated Power Production from Biogas: Modeling and Simulations under Swedish Conditions ,Energy & Fuels , Vol. 29 (7),pp 4066-4075 , 2015, https://doi.org/https://doi.org/10.1021/ef502778u - ,
The Anaerobic Digestion Model No. 1 (ADM1) ,Water Science & Technology , Vol. 45 (10),pp 65-73 , 2002, https://doi.org/https://doi.org/10.2166/wst.2002.0292 - ,
Virtual Power Plant Biogas Schweiz ,Final Report , 2014 - ,
A Model-Based Analysis of the Future Capacity Expansion for German Biogas Plants Under Different Legal Frameworks ,Renewable and Sustainable Energy Reviews , Vol. 96 ,pp 119-131 , 2018, https://doi.org/https://doi.org/10.1016/j.rser.2018.07.041 - ,
Estimating the Revenue Potential of Flexible Biogas Plants in the Power Sector ,Energy Policy , Vol. 128 ,pp 402-410 , 2019, https://doi.org/https://doi.org/10.1016/j.enpol.2019.01.007 - ,
The use of Dynamic Mathematical Models for improving the Designs of upgraded Wastewater Treatment Plants ,Journal of Sustainable Development of Energy, Water and Environment Systems , Vol. 5 (1),pp 15-31 , 2017, https://doi.org/https://doi.org/10.13044/j.sdewes.d5.0130 - ,
Dynamic Simulation of a Biogas Plant Providing Control Energy Reserves ,Chemical Engineering Transactions , Vol. 61 ,pp 931-936 , 2017, https://doi.org/https://doi.org/10.3303/CET1761153 - ,
Historical Market Data of the EPEX Spot Market , - ,
, - ,
Balancing Statistics in APG Control Area , - ,
Techno-Economic Assessment of Providing Control Energy Reserves with a Biogas Plant ,Frontiers of Chemical Science and Engineering , Vol. 12 (4),pp 763-771 , 2018, https://doi.org/https://doi.org/10.1007/s11705-018-1776-x - ,
Green Electricity Act and the Amendement of the Electricity Economy and Organisation Act (ElWOG) and the Energy Promotion Act 1979 (in German), BGBl. I Nr. 149/2002 , 2002 - ,
, 2018 - ,
Biogas – Part of Austria’s Future Energy Supply or Political Experiment? ,Renewable and Sustainable Energy Reviews , Vol. 79 ,pp 525-532 , 2017, https://doi.org/https://doi.org/10.1016/j.rser.2017.05.106 - ,
Amendement to the Green Electricity Act 2012, The Electricity Management and Organisation Act 2010, The Gas Economy Act 2011, The CHP Points Act and the Energy Control Act as Well as The Federal Act, Which Provides Additional Funds from Special Assets Managed by Energy-Control Austria, Bgbl. I No. 75/2011 I.D.F. Bgbl. I No. 108/2017 , 2017 - ,
2030 Climate & Energy Framework , - ,
, Balancing Renewable Electricity , 2012, https://doi.org/https://doi.org/10.1007/978-3-642-25157-3 - ,
Lead Study Electricity Market ‒ Work Package Optimisation of the Electricity Market Design , - ,
Biogas Plants and Surplus Generation: Cost Driver or Reducer in the Future German Electricity System? ,Energy Policy , Vol. 109 ,pp 324-336 , 2017, https://doi.org/https://doi.org/10.1016/j.enpol.2017.07.016 - ,
Value of Power Plant Flexibility in Power Systems with High Shares of Variable Renewables ‒ A Scenario Outlook For Germany ,Energy , Vol. 137 ,pp 823-833 , 2017, https://doi.org/https://doi.org/10.1016/j.energy.2017.04.138 - ,
Flexible Biogas Production for Demand-Driven Energy Supply – Feeding Strategies and Types of Substrates ,Bioresource Technology , Vol. 178 ,pp 262-269 , 2015, https://doi.org/https://doi.org/10.1016/j.biortech.2014.08.123 - ,
Review of Concepts for a Demand-Driven Biogas Supply for Flexible Power Generation ,Renewable and Sustainable Energy Reviews , Vol. 29 ,pp 383-393 , 2014, https://doi.org/https://doi.org/10.1016/j.rser.2013.08.085


