The overuse of fossil fuel has caused many environmental and health problems. The combustion of fossil fuel produces carbon dioxide that is a major cause of global warming. It also produces toxic materials that can cause serious diseases for human beings. Besides its negative impact, the limited reserves and the expected depletion of fossil fuel have forced researchers, governments and policy makers to look for alternative clean and sustainable energy resources [1]. A primary alternative source for sustainable energy is the sunlight. It can be used to generate renewable and clean electric energy by Photovoltaic (PV) energy systems [2].
PV systems have low energy conversion efficiency [3]. Their initial implementation costs are relatively high as well. Accordingly, it is imperative to work towards obtaining the maximum output power in all weather conditions to improve their efficiency [3] and ensure their economic feasibility. The nonlinear characteristics of the PV system show a unique operating point at which the output power is at its maximum. The output power varies with insolation and cell temperature [4]. Hence, it is difficult to obtain the maximum power and maximum efficiency at all times. The challenge here is to get the equilibrium operating point to coincide with the maximum power point of the PV source to match the PV generator with the load [5]. Several Maximum Power Point Tracking (MPPT) methods have been proposed in literature such as the Perturb and Observe (P&O) [3] and Incremental Conductance (IC). These are easy to implement and hence are widely used. However, the disadvantages of these methods are the uncertainty due to their sensitivity to sudden changes in climatic conditions [3], [6]. They also suffer from the fluctuations around the operating point [7], [8].
Various methods were proposed in literature to improve the results achieved by the P&O algorithm. One important direction followed to improve MPPT was based on the use of fuzzy logic. Improved transient and steady state MPPT was achieved in Chen et al. [9] by using auto-scaling variable step functions as inputs for fuzzy-logic based controller. In Alajmi et al. [10] fuzzy logic was used in conjunction with hill climbing method to expedite the convergence time to the maximum operating point under varying weather conditions. An adaptive indirect fuzzy-based MPPT scheme was proposed in Nabipour et al. [11] to offer synchronous online tuning capability for the antecedent-consequent-based fuzzy membership functions. A neuro-fuzzy indirect wavelet-based adaptive MPPT that showed high efficiency in power generation and fast response was proposed in Hassan et al. [12].
Another direction researchers followed to improve MPPT was by utilizing bio-inspired computational optimization methods such as swarm optimization [13] and ant colony optimization [14]. Glowworm swarm optimization algorithm was used in Hou et al. [13] to improve the MPPT speed and accuracy as compared to the conventional P&O method. The used of ant colony optimization in Titri et al. [14] enabled tracking the global maximum power point under partial shading conditions.
A third direction is the use of Artificial Neural Networks (ANNs) [15] which are well known machine learning algorithms to estimate the reference voltage at which the PV panel operates at its maximum power. A review of various simulation and hardware implementation of ANN for MPPT was given in Messalti et al. [16]. Other variants of ANN based MPPT methods were discussed in Ramos-Hernanz et al. [17] and Kofinas et al. [18]. The use of ANN estimators for sliding mode control of PV systems was discussed in Ramos-Hernanz et al. [17] whereas a hybrid learning ANN based MPPT controller was proposed in Kofinas et al. [18] for use in control under partially shaded conditions. The ANN based methods showed fast response and good accuracy in estimating the maximum power point. However, it is well known in machine learning literature that artificial neural networks converge at local minima [19]. Support Vector Machines (SVM) on the other hand, are known to converge at global minima, which makes them better alternatives to get closer estimates of the maximum power point.
A SVM is a machine learning algorithm that attracted the attention in many fields of applications. It is a nonlinear system that takes the input data to a higher space using the kernel-trick [20] to make it linear. It can be used for classification purposes and is then referred to as Support Vector Classification (SVC). SVC is a learning framework availing a high-dimensional unfamiliar space [21]. It aims to classify data into two distinctive sets. SVM can also be used for regression and is then referred to as Support Vector Regression (SVR). The primary idea of SVR is to map the data into a higher dimensional feature space using nonlinear mapping and perform regression in that space [22]. The data used should be of low range so that the precision and allocation could be made better during regression. A usually used procedure to ensure that is to normalize the data within the range 0 to 1 so that the regression error can be minimized. Some advantages of SVM compared to ANN are that it has higher calculating speed, no data gets trapped into local minimum and it has better convergence results [23]. A full mathematical description of SVR can be found Takruri et al. [24].
In the context of renewable energy, SVM has been used for many applications [25]. These applications include modelling solar air heater systems [26], forecasting monthly solar radiation [27], forecasting PV power output based on weather conditions [28], predicting next day insolation [29] and forecasting short-term solar irradiance [30]. SVM algorithms have also been used for predicting short term wind power generation [31] and predicting wind speed [32] and direction [33]. Moreover, they showed remarkable performance in forecasting urban energy consumption [22].
This paper proposes a new method for estimating the optimal operation point of the PV panel for variable temperature and irradiance conditions using SVMs. This point will be used as a reference for any stable controller and will ensure maximum power transfer from the panel. The dataset used is a one-year PV input-output measurement obtained from a PV panel deployment in Spain. The SVM-learned model can be used for predicting the reference voltage (Vref) that will ensure that the PV panel will produce optimal output power for given temperature and irradiation levels.
In this work, SVR is used to learn a model function that can be used for predicting Vref that corresponds to the PV panel optimal output power for given temperature and irradiation levels. This is implemented in two phases, namely, the training phase and the running phase. During the training phase (see Figure 1), data collected from PV system in the past (training data set) are used for function modelling. During the running phase (testing phase) depicted in Figure 2, the trained model is used to predict the reference voltage value . The predicted value is later compared with actual value and the mean square error is calculated. The predicted results are considered accurate [34] if the calculated error is small. The Root Mean Square Error (RMSE) is found by the following formula:
(1)
where n denotes the number of data points, Vref denotes the reference voltage and denotes the predicted reference voltage. Compared to others work in terms of prediction of optimal solar PV output, our model gives an accurate output reference voltage by taking the temperature and irradiation values as an input to the SVR generated model. The predicted voltage will be used as a reference to the controller that will push the system to work at its optimal point on the characteristic curve and as a result, the efficiency will be improved.
Block diagram of the training phase

Block diagram of the testing phase

The PV panel used for this work is a Mitsubishi TD185MF5 panel. It has 50 polycrystalline cells connected in series configuration. The PV panel has the following specifications (Table 1).
Mitsubishi TD185MF5 characteristic
| Cell type | Polycrystalline silicon |
|---|---|
| Maximum power [W] | 185 |
| Open circuit voltage (Vocc) [V] | 30.60 |
| Short circuit current (Isc) [A] | 8.13 |
| Voltage at max. power (Vmpp) [V] | 24.40 |
| Current at max. power (Impp) [A] | 7.58 |
| Normal operating cell temp [°C] | 47.5 |
The nonlinear characteristics curve of the PV panel is described by eq. (2) which is obtained from the PV equivalent circuit:
(2)
where Is is the reserve saturation current, Ns is the number of cells connected in series, Iph is the current produced by the light, Rs and Rsh are the resistances in series and parallel, q is the electron charge, a is the ideality factor modified and k is the Boltzmann’s constant [34].
Figure 3 shows the measured power-voltage curves of the PV panel for different irradiation levels ranging from 700 to 1,225 W/m2 and a fixed temperature of T = 50 °C. The figure also shows that the maximum power for all the irradiation values is obtained when the voltage across the PV panel is around 18 V. Based on that, it can be said that while the voltage across the panel remains constant (as seen in the pink line in the figure), the maximum power point is proportional to the irradiation levels.
Power-voltage for different irradiations and fixed temperature T = 50 °C
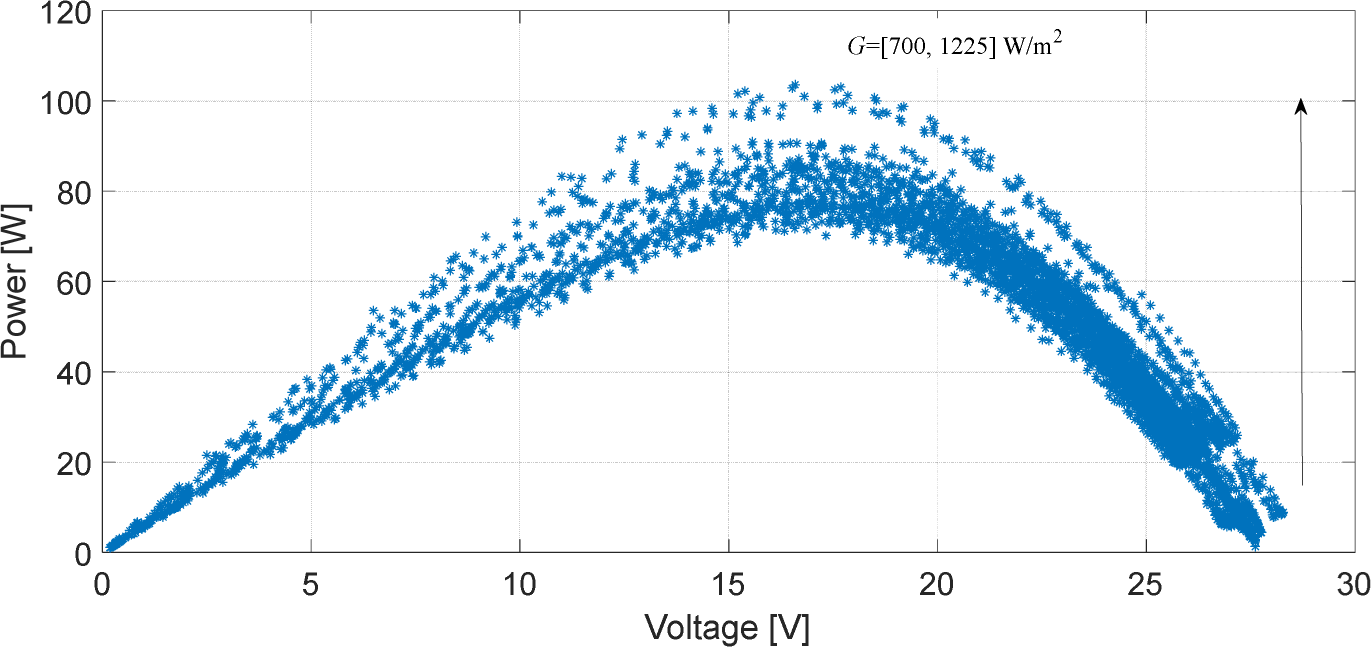
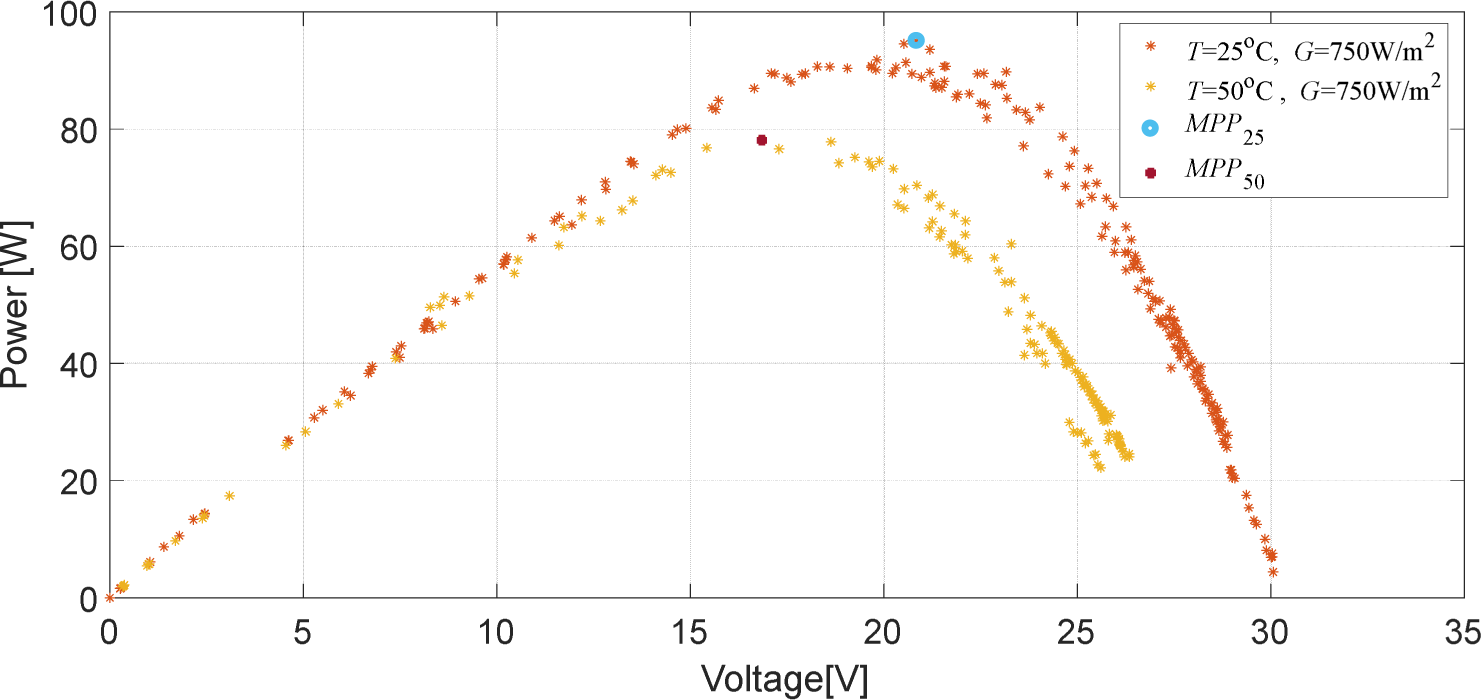
Figure 4 and Figure 5 show respectively the measured power-voltage and current-voltage curves for the PV panel for a constant irradiation level of 750 W/m2 and two different temperature values namely, 25 °C and 50 °C. It can be seen from the figures that an increase in temperature leads to a decrease in the generated power as opposed to irradiation increase effect. The voltage corresponding to the maximum power decreases with the increase of temperature and is sensitive to the change in the value of the PV current.
Power-voltage for variable temperature and fixed irradiation
Current-voltage for variable temperature and fixed irradiation
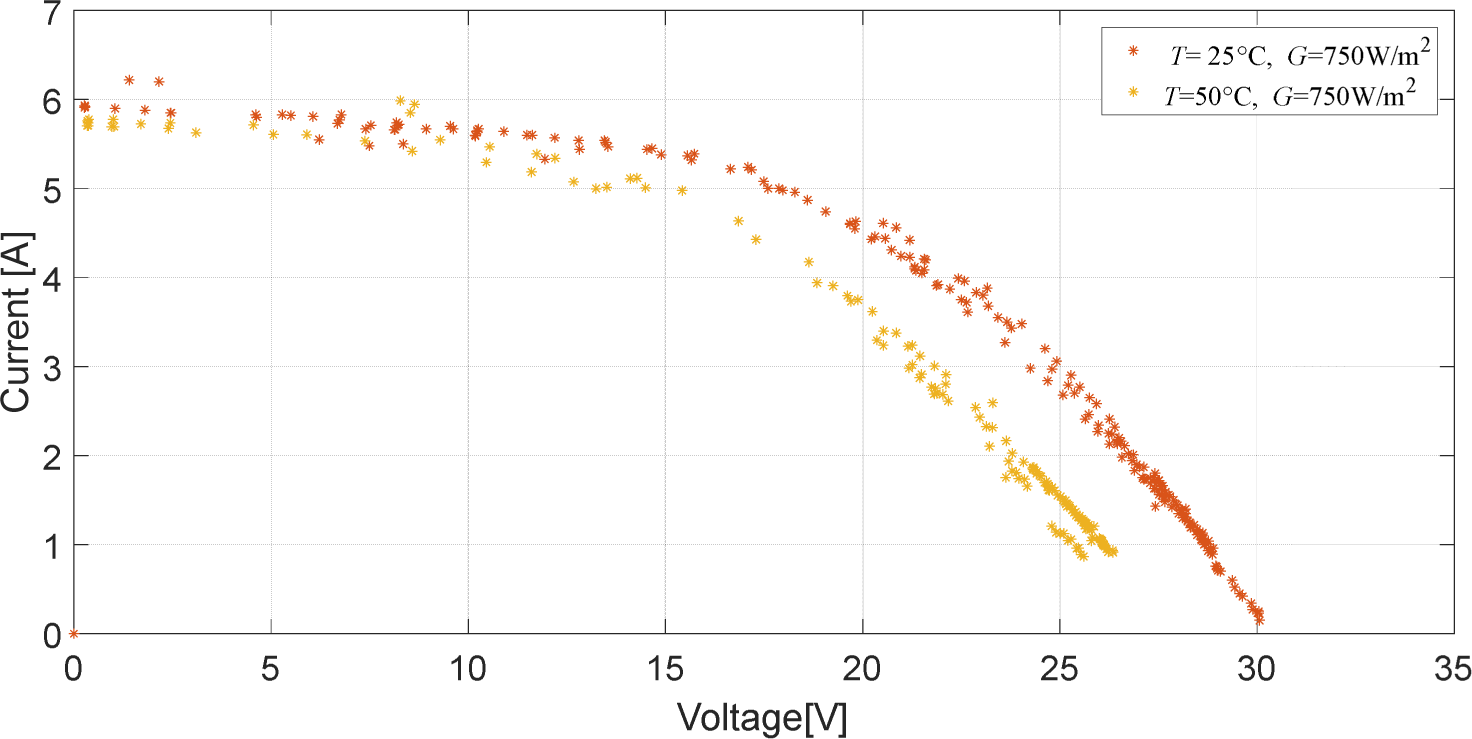
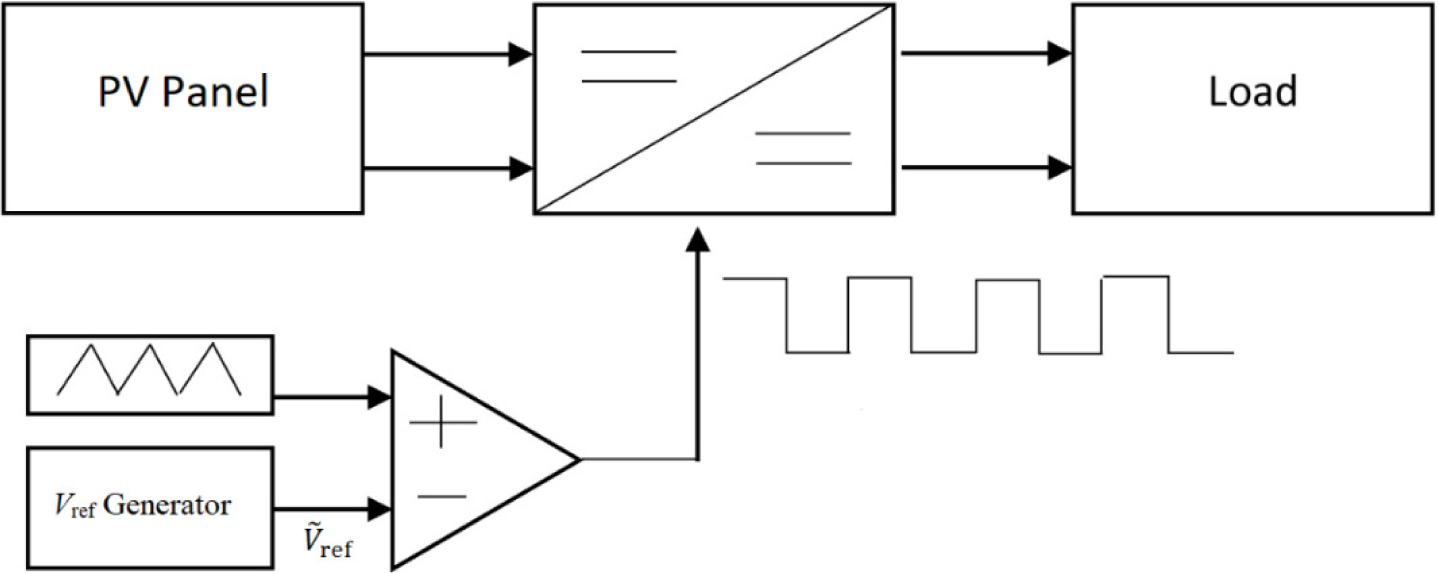
Figure 6 depicts the block diagram of the overall power control system. It consists of a PV panel whose output is connected to a Direct Current (DC)-DC converter. The output of the DC-DC converter is connected to a variable load. The second input of the DC-DC converter comes from the compensator circuit. The compensator takes two inputs, a saw tooth signal and the output of the reference voltage generator , which was previously modelled by the SVR algorithm during the training phase. The entire setup uses Pulse Width Modulation (PWM) in the process to push the converter to work at the right value of voltage to extract maximum power from the PV panel.
Power control system
The aim of this section is to evaluate the ability of the proposed SVR based method as an accurate reference voltage estimator. The dataset used here, which is obtained from a real PV setup in Spain, includes temperature, irradiation, output current, voltage and power for a period of one year.
Data acquisition was conducted using a Daystar DS-1000 PV I-V Curve tracer. Mitsubishi TD185MF5 panel was connected to the IV curve tracer and the software associated with the tracer measured the current and voltage values. Temperature and irradiation sensors were connected to the panel through the IV curve tracer. Using the current and voltage values, power was calculated. The collected data were cleaned and divided into a training set and a testing set. 75% of the data points were used for training and the remaining 25% were used for testing. Referring back to Figure 1 which describes the training phase, it can be seen that SVR is used as a supervised learning method with irradiation (G) and temperature (T) as inputs and Vref as a target. The training phase results in finding a function that models the relationship of G, T with Vref. In the testing phase described in Figure 2, the function constructed in the training phase is used to estimate the reference voltage for new inputs G and T. The SVR setup in this work uses Radial Basis Function (RBF) as the Kernel function and implements the algorithm using MatLab. 10-fold cross validation [35] over 75% of the data is used to pick the best kernel parameters, namely, C and γ.
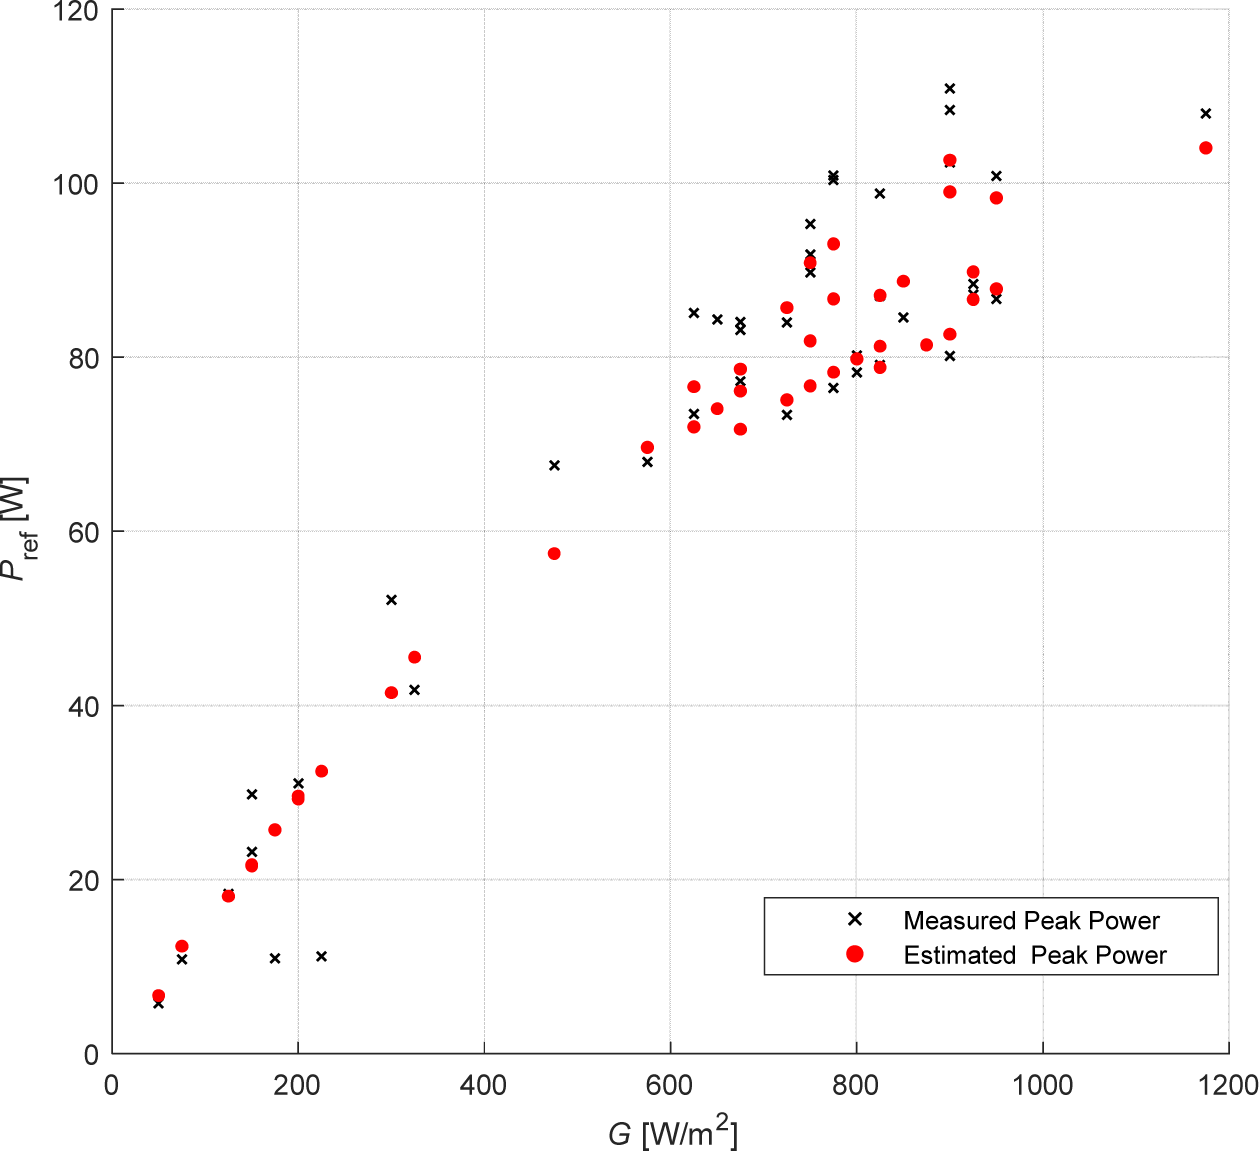
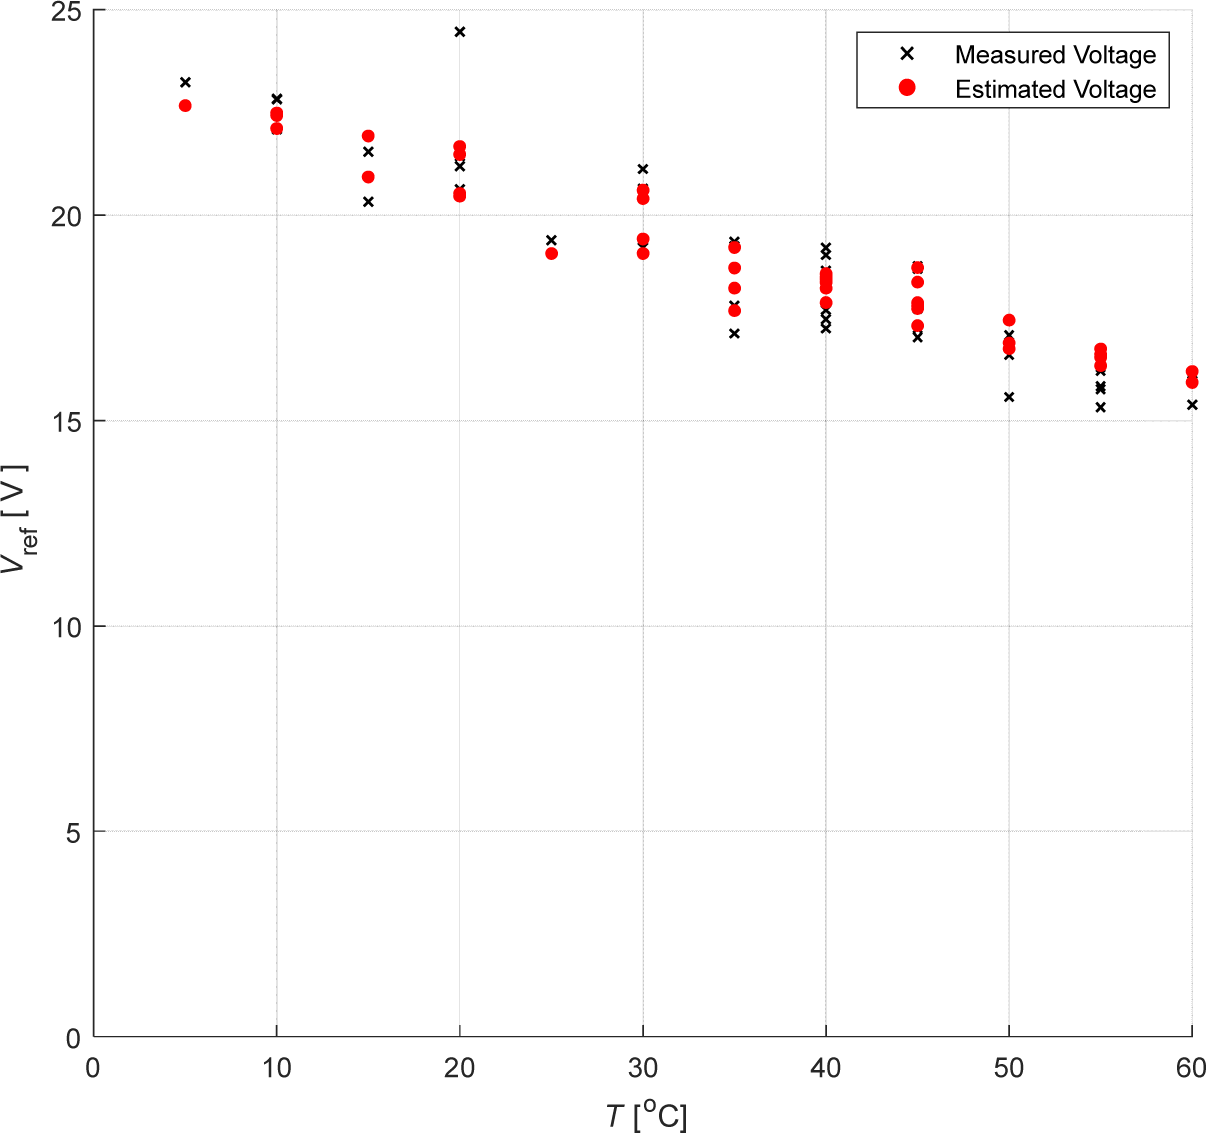
The results of using SVR to model Vref that corresponds to the PV panel maximum output power for different temperature and radiation conditions are shown in Figures 7 and Figure 8. It can be seen from Figure 7 that the maximum power values estimated for a certain irradiation level (marked in red) are very close to the observed (measured) values marked in black.
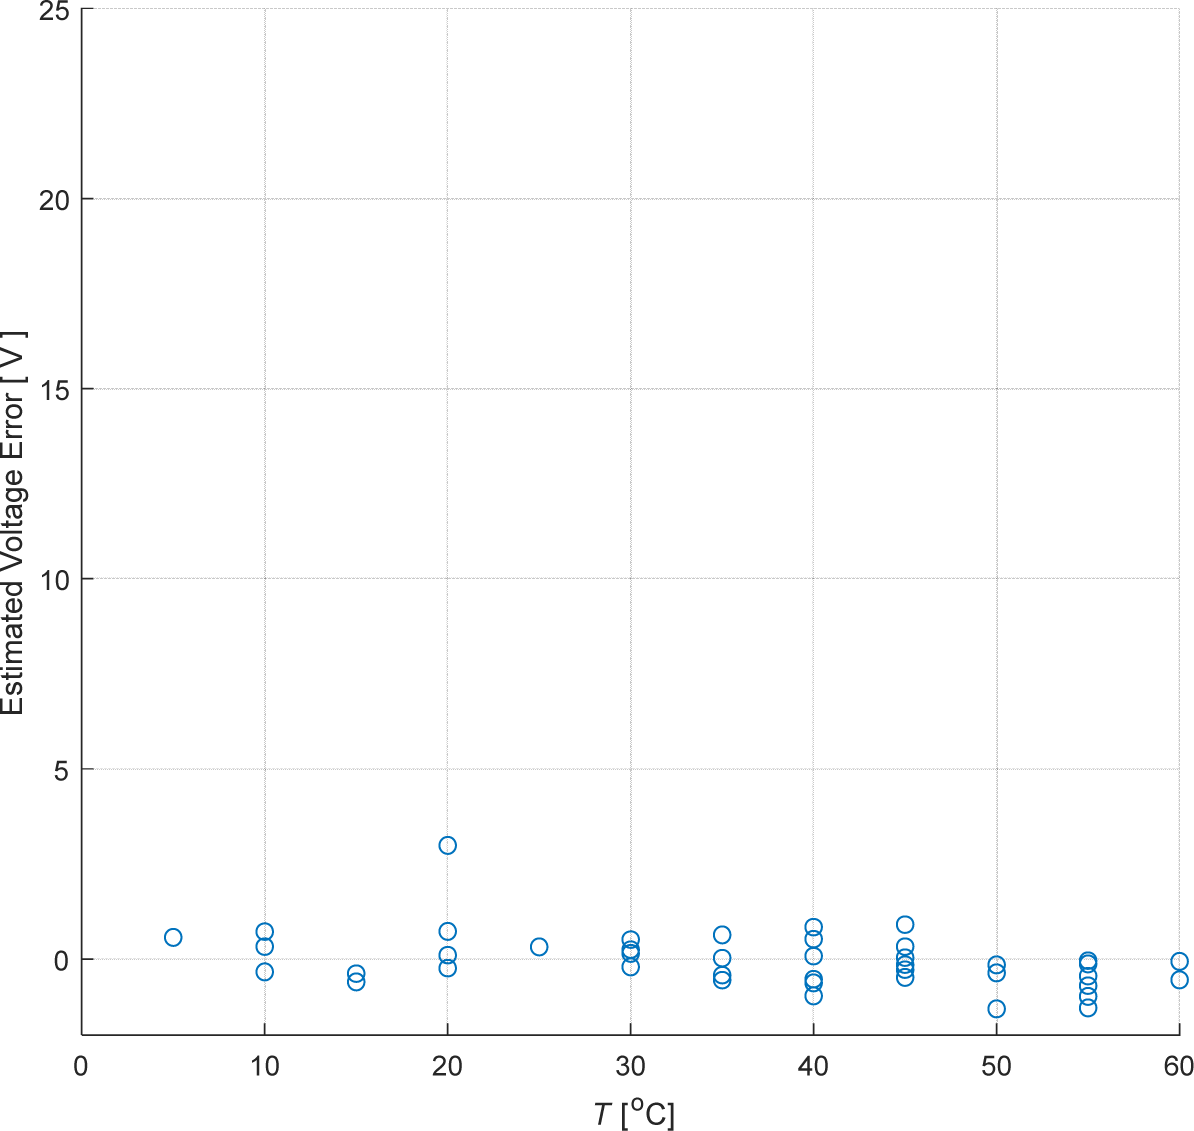
Figure 8 shows that the estimated Vref is very close to the actual one. The error between the estimated reference voltage and the actual measured reference voltage is shown in Figure 9. The RMSE between the actual and estimated Vref in this experiment is 0.71 V. This highlights the impressive ability of SVR to approximate the actual data. Thus, it can serve as a good reference for the DC-DC converter to maintain maximum power output at all times. It is worth noting that one of the measured voltage values (in Figure 8) at 20 °C is considerably higher than the other measurements causing high RMSE. The reason for having such an odd measurement is a sensor overshoot caused by rapid change in light conditions which in turn distorted the measured signal.
Estimated and measured maximum power points for different irradiation levels
Estimated and measured Vref for different temperature levels
Error in estimating Vref for different temperature levels
Referring to Figure 3 that shows the variation in the measured PV characteristic curve with irradiation levels and comparing it with Figure 7, it can be clearly seen that generated power in both figures is directly proportional to irradiation level. Both the measured and the SVR estimated power values plotted in Figure 7 match the power values shown in Figure 3. On the other hand, comparing Figure 8 with Figure 4 that displays the variation in the measured PV characteristic curve with temperature, it can be clearly seen that the reference voltage Vref in both figures is inversely proportional to temperature. Both the measured and the SVR estimated reference voltage values plotted in Figure 8 match the reference voltage values shown in Figure 4.
As discussed earlier, Vref corresponds to the optimal operating point in the PV characteristic curve which ensures maximum power generation out of the PV panel and improved system efficiency. The results plotted in Figure 7 and Figure 8 show that SVR is able to closely estimate Vref and the generated power. Hence, SVR can be used as an effective and reliable Vref generator in the power generation system depicted in Figure 6 above. This will ensure maximum power generation out of the PV panel for a given temperature and irradiation values and will ensure stable DC output level out of the DC-DC converter as well. It should be noted here that other variables could affect the amount of power generated from the PV panel such as humidity, dust and fog. Including these variables in the SVR model is expected to give more accurate results.
This paper proposed an effective method for improving the efficiency of power generation from PV panels by modelling the PV characteristics using SVM in the regression mode. The SVM is implemented in two phases, the training phase that models the relationship of temperature and irradiance with the reference voltage, and the testing phase that uses the model produced in the training phase to estimate the reference voltage for new temperature and irradiance levels. The proposed model resulted in accurate estimation of the reference voltage values that correspond to the maximum power generated by the PV panel for a given temperature and irradiation values. Hence, SVR can be used as an effective and reliable reference voltage generator for any PV based power generation system. This will ensure optimal power generation out of the PV panel. In addition, the system can be used to forecast PV systems output on a large scale based on the weather forecast data. Consequently, it can be used as a planning tool for efficient utilization of renewable energy resources in urban settings.
In future, more factors that could affect the power generation efficiency of PV panels such as humidity, dust and fog among others can be included in the SVM model. Considering these variables is expected to give more accurate results.
- ,
Review of Fossil Fuels and Future Energy Technologies ,Futures , Vol. 69 ,pp 31-49 , 2015, https://doi.org/https://doi.org/10.1016/j.futures.2015.03.003 - ,
Storage Systems for Integrating Wind and Solar Energy in Spain ,Proceedings of the 2013 International Conference on Renewable Energy Research and Applications (ICRERA) , 2013, https://doi.org/https://doi.org/10.1109/ICRERA.2013.6749781 - ,
Efficiency Optimization of a DSP-based Standalone PV System Using a Stable Single Input Fuzzy Logic Controller ,Renewable and Sustainable Energy Reviews , Vol. 49 ,pp 907-920 , 2015, https://doi.org/https://doi.org/10.1016/j.rser.2015.04.123 - ,
A New Maximum Power Point Method Based on a Sliding Mode Approach for Solar Energy Harvesting ,Applied Energy , Vol. 185 (Part 2),pp 1185-1198 , 2017, https://doi.org/https://doi.org/10.1016/j.apenergy.2016.03.055 - ,
Evaluation of the Main MPPT Techniques for Photovoltaic Applications ,IEEE Transactions on Industrial Electronics , Vol. 60 (3),pp 1156-1167 , 2013, https://doi.org/https://doi.org/10.1109/TIE.2012.2198036 - ,
Neural-network-based Maximum-power-point Tracking of Coupled-inductor Interleaved-boost-converter-supplied PV System Using Fuzzy Controller ,IEEE Transactions on Industrial Electronics , Vol. 50 (4),pp 749-758 , 2003, https://doi.org/https://doi.org/10.1109/TIE.2003.814762 - ,
A Novel Hybrid Maximum Power Point Tracking Technique Using Perturb & Observe Algorithm and Learning Automata for Solar PV System ,Energy , Vol. 112 ,pp 1096-1106 , 2016, https://doi.org/https://doi.org/10.1016/j.energy.2016.07.024 - ,
A Low-cost Maximum Power Point Tracking System Based on Neural Network Inverse Model Controller ,Electronics , Vol. 7 (1),pp 1-17 , 2018, https://doi.org/https://doi.org/10.3390/electronics7010004 - ,
A Fuzzy-logic Based Auto-scaling Variable Step-size MPPT Method for PV Systems ,Solar Energy , Vol. 126 ,pp 53-63 , 2016, https://doi.org/https://doi.org/10.1016/j.solener.2016.01.007 - ,
Fuzzy-Logic-Control Approach of a Modified Hill-Climbing Method for Maximum Power Point in Microgrid Standalone Photovoltaic System ,IEEE Transaction on Power Electronics , Vol. 26 (4),pp 1022-1030 , 2011, https://doi.org/https://doi.org/10.1109/TPEL.2010.2090903 - ,
A New MPPT Scheme Based on a Novel Fuzzy Approach ,Renewable Sustainable Energy Reviews , Vol. 74 ,pp 1147-1169 , 2017, https://doi.org/https://doi.org/10.1016/j.rser.2017.02.054 - ,
Neuro-Fuzzy Wavelet Based Adaptive MPPT Algorithm for Photovoltaic Systems ,Energies , Vol. 10 (3),pp 1-16 , 2017, https://doi.org/https://doi.org/10.3390/en10030394 - ,
A Novel Maximum Power Point Tracking Algorithm Based on Glowworm Swarm Optimization for Photovoltaic Systems ,International Journal of Photoenergy , Vol. 2016 ,pp 9 , 2016, https://doi.org/https://doi.org/10.1155/2016/4910862 - ,
A New MPPT Controller Based on the Ant Colony Optimization Algorithm for Photovoltaic Systems Under Partial Shading Conditions ,Applied Soft Computing , Vol. 58 ,pp 465-479 , 2017, https://doi.org/https://doi.org/10.1016/j.asoc.2017.05.017 - ,
Maximum Power Point Tracking with Artificial Neural Network ,International Journal of Emerging Science and Engineering , Vol. 2 (3),pp 38-42 , 2014 - ,
A New Variable Step Size Neural Networks MPPT Controller: Review, Simulation and Hardware Implementation ,Renewable Sustainable Energy Reviews , Vol. 68 (Part 1),pp 221-233 , 2017, https://doi.org/https://doi.org/10.1016/j.rser.2016.09.131 - ,
Sliding Mode Real-Time Control of Photovoltaic Systems Using Neural Estimators ,International Journal of Photoenergy , Vol. 2016 ,pp 1-16 , 2016, https://doi.org/https://doi.org/10.1155/2016/5214061 - ,
An Intelligent MPPT Controller Based on Direct Neural Control for Partially Shaded PV System ,Energy and Buildings , Vol. 90 ,pp 51-64 , 2015, https://doi.org/https://doi.org/10.1016/j.enbuild.2014.12.055 - ,
Advantages and Disadvantages of Using Artificial Neural Networks versus Logistic Regression for Predicting Medical Outcomes ,Journal of Clinical Epidemiology , Vol. 49 (11),pp 1225-1231 , 1996, https://doi.org/https://doi.org/10.1016/S0895-4356(96)00002-9 - ,
, Statistical Learning Theory , 1998 - ,
Solar Energy Applications and Development in Nigeria: Drivers and Barriers ,Renewable and Sustainable Energy Reviews , Vol. 32 ,pp 294-301 , 2014, https://doi.org/https://doi.org/10.1016/j.rser.2014.01.014 - ,
Support Vector Regression Based Electricity Peak Load Forecasting ,Proceedings of the 2018 11th International Symposium on Mechatronics and its Applications (ISMA) ,pp 1-5 , 2018, https://doi.org/https://doi.org/10.1109/ISMA.2018.8330143 - ,
Potential of Support Vector Regression for Solar Radiation Prediction in Nigeria ,Natural Hazards , Vol. 77 (2),pp 1055-1068 , 2015, https://doi.org/https://doi.org/10.1007/s11069-015-1641-x - ,
Spatio-Temporal Modelling Based Drift Aware Wireless Sensor Networks ,IET Wireless Sensor Systems , Vol. 1 (2),pp 110-122 , 2011, https://doi.org/https://doi.org/10.1049/iet-wss.2010.0091 - ,
Application of Support Vector Machine Models for Forecasting Solar and Wind Energy Resources: A Review ,Journal of Cleaner Production , Vol. 199 ,pp 272-285 , 2018, https://doi.org/https://doi.org/10.1016/j.jclepro.2018.07.164 - ,
Modelling of a New Solar Air Heaterthrough Least-squares Support Vector Machines ,Expert Systems with Applications , Vol. 36 (7),pp 10673-10682 , 2009, https://doi.org/https://doi.org/10.1016/j.eswa.2009.02.045 - ,
Estimation of Monthly Solar Radiation from Measured Temperatures Using Support Vector Machines ‒ A Case Study ,Renewable Energy , Vol. 36 (1),pp 413-420 , 2011, https://doi.org/https://doi.org/10.1016/j.renene.2010.06.024 - ,
Forecasting Power Output of Photovoltaic Systems Based on Weather Classification and Support Vector Machines ,IEEE Transactions on Industry Applications , Vol. 48 (3),pp 1064-1069 , 2012, https://doi.org/https://doi.org/10.1109/TIA.2012.2190816 - ,
A Least Squares Support Vector Machine Model for Prediction of the Next Day Solar Insolation for Effective Use of PV Systems ,Measurement , Vol. 50 ,pp 255-262 , 2014, https://doi.org/https://doi.org/10.1016/j.measurement.2014.01.010 - ,
Bi-model Short-term Solar Irradiance Prediction Using Support Vector Regressors ,Energy , Vol. 70 ,pp 121-127 , 2014, https://doi.org/https://doi.org/10.1016/j.energy.2014.03.096 - ,
Short-term Wind Speed Forecasting Using Wavelet Transform and Support Vector Machines Optimized by Genetic Algorithm ,Renewable Energy , Vol. 62 ,pp 592-597 , 2014, https://doi.org/https://doi.org/10.1016/j.renene.2013.08.011 - ,
Support Vector Machines for Wind Speed Prediction ,Renewable Energy , Vol. 29 (6),pp 939-947 , 2004, https://doi.org/https://doi.org/10.1016/j.renene.2003.11.009 - ,
Wind Direction Forecasting with Artificial Neural Networks and Support Vector Machines ,Ocean Engineering , Vol. 97 (15),pp 65-73 , 2015, https://doi.org/https://doi.org/10.1016/j.oceaneng.2014.12.026 - ,
Advanced Incremental Conductance MPPT Algorithm with a Variable Step Size ,Proceedings of the 2006 12th International Power Electronics and Motion Control Conference , 2006, https://doi.org/https://doi.org/10.1109/EPEPEMC.2006.283227 - ,
Study of Cross-validation and Bootstrap for Accuracy Estimation and Model Selection ,Proceedings of the International Joint Conference on Artificial Intelligence , 1995


