Putting the Paris Agreement from 2015 at the spotlight has provoked an “energy transition” in many countries. To be able to keep the global temperature rise below 2 °C, the recent analyses [1] have indicated that “the global energy system must undergo a profound transformation, from one largely based on fossil fuels to one that enhances efficiency and is based on renewable energy.” Driven by the ambitious national targets and the rapid technological progress, most of the countries are turning to renewable energy in their national energy development plans. In the policy development process, the decision makers are relying on techno-economic analyses as a help to set the national targets for renewable energy uptake. Therefore, the modelling of different future scenarios of power sector development has become important planning tool and the representation of the Variable Renewable Energy (VRE) sources in long-term models has become crucial for power sector transition.
The long-term energy planning models (or in other words, long-term generation expansion models) are optimisation models that calculate capacity expansion paths on a planning time horizon of about 20-40 years and are used to derive long-term investment plans for the energy or power sector. In many studies and scientific papers, the optimal generation mix has been determined using the least-cost principle over longer planning horizon. However, the long-term generation expansion planning is considered as a multi-dimensional problem that requires an in-depth investigation of various aspects (economic, environmental, regulatory, etc.) and consideration of synergies with other complementary sectors [2]. This has led to modification of the traditional cost-based approaches and development of new ones that incorporate at least several of the required aspects. A recent review study has identified several important perspectives of generation expansion planning problem, among which the liberalization of electricity industry has been separated as the one that brought most of the changes in the planning models by altering the objective function, constraints and even the planning period [3]. The study also points out that the future research should primarily focus on more precise modeling of uncertainties of Renewable Energy Sources (RES)-based production, in particular wind and solar technologies, given the recent rapid growth of their share in electricity production. A review of 37 computer tools used for analysing integration of RES into energy systems have been made by Connolly et al. [4]. According to this paper, it is evident that there is no such tool covering all issues related to the integration of RES. However, the detailed review made in the paper provides the necessary information to guide the decision-makers to an appropriate energy tool in order to make the necessary analysis.
The recent study from IRENA [5] states that if presenting policy makers with a scenario for long-term electricity generation expansion which is driven by VRE deployment, the scenario should explicitly address how to meet needs for firm capacity, flexibility and transmission capacity. Most relevant to long-term investment in the power system is the firm capacity, which is important in order to provide generation adequacy in a system with a high share of VRE. Therefore, it is crucial to represent the temporal matching of VRE availability and demand profile more accurately in the long-term energy planning tools.
One innovative approach is used in Pereira et al. [6] where the unit commitment problem is integrated in the optimization process of the model used for generation expansion planning of the Portuguese energy system with wind, hydro and thermal power plants. The different scenario results showed that the hourly and seasonal variability of RES and the demand are directly affecting the load factor and the utilization ratio of the thermal power plants. Therefore, this approach provides more reliable results in terms of costs and structure of the optimal generation mix in case of long-term development planning of a system that incorporates thermal power plants and high share of RES. However, in the specific case the computing time required for the integrated model is between 10 and 18 hours, while a simple optimization model tested on the same system [7] needs less than a minute. Hence, a combined use of both models is proposed [6] ‒ the simple one to select a set of possible optimal solutions and the integrated model to refine the results.
In order to reduce calculation time, the long-term energy planning models have a simplified time resolution and in most cases do not take into account the technical and economic constraints of the individual power plants operation (even though this impacts the results [8]). Therefore, it is proposed to improve the time resolution of the models by applying different approaches of defining the time-periods in order to accurately reflect the RES variability. In addition, even greater accuracy can be achieved if the time resolution of the model is based on a set of representative days, although this requires a greater number of time-periods. The simplified time resolution in long-term planning models meant that a year, typically, is represented by 1-12 time-slices, i.e., time-periods. In addition, these models operate based on the technology type, rather than individually considering the operational constraints of each power plant. So far, this level of detail has been used in unit commitment models [8]. Although this generalization in the long-term planning models was considered to have no significant impact on the results, the recent analysis shows that in a power system with a high share of variable RES this traditional approach could underestimate the expansion decisions [9] and lead to a sub-optimal capacity mix with significantly higher operating costs [10]. The possible solution is to establish soft-links between the optimization models and unit commitment model (either one-way [11] or two-way links [12]), but this will increase the calculation time even more.
When the calculation time of the optimal solution is limited, one approach is to improve the calibration of the time-slices in the model in order to capture key patterns of the daily and seasonal variations of the VRE and demand [13]. This is done for example in the LIMES model for Eastern Germany [14] or in the TIMES model for Greek energy system [15], where a year is divided into 16 time slices (4 seasons and 4 intra-day blocks) based on the analysis of datasets for demand, wind power consumption and solar power consumption. The other approach is to introduce a constraint for the contribution of VRE to the firm capacity (i.e., its capacity credit), which in long-term generation expansion models is normally an exogenous parameter. Examples for this approach can be found for Ireland using the OSeMOSYS model [16], for UK using the MARKAL elastic demand model [17], or for US using the ReEDS model [18], where a different constraint on the capacity credit was specified in each of these models.
In addition to the firm capacity of the power system, the flexibility and transmission capacity also have a high relevance in long-term investments. In Johnson et al. [19], the global integrated model MESSAGE has been updated to explicitly model the trade-offs between variable renewable energy deployment and its impacts on the electricity system, including the implications for electricity curtailment, backup capacity, and system flexibility. In some cases a “coupling” approach has been applied by using the economic dispatch decisions from production cost models as constraints in the long-term generation expansion models (e.g., soft-links have been used in Tigas et al. [15] between the TIMES models and a probabilistic simulation model PropSlim, and in Pina et al. [20] between TIMES model and Energy Plan model).
The availability of VRE resources can also be constrained by their location, i.e., sites with good VRE sources may be located far from centers of demand or from the existing transmission lines. On the other hand, technical constraints, such as congestion and overloading of the existing transmission lines, may cause a curtailment of the VRE potential at the specific location. Therefore, new capacity may need to be planned to transmit power from VRE resources and the investment costs should be taken into account. The representation of the grid investment needs related to VRE expansion can be simplified, for example by assessing them separately and then adding to the VRE investment cost in a generic manner.
The focus of this paper is on the transmission network capacity for acceptance of variable renewable energy. The hypothesis is that the simplified electric power transmissions system in the long-term planning modeling tools does not reflect properly the capacity for integration of the variable renewable energy. An integrated approach will be applied with aim to incorporate the grid expansion needs and costs [based on Direct Current (DC) load flow analysis], necessary for increased renewable electricity penetration. The already developed MARKAL-Macedonia model will be used as a case study. After several iterations and feedback loops between the MARKAL-Macedonia and the network model, the expected outcome is to achieve a new cost-effective solution for higher deployment of variable energy on a larger scale.
The utilization of RES in Macedonian power system has been analysed either as an available potential for reduction of Greenhouse Gas (GHG) emissions or as a part of the energy system development pathways. The analyses for GHG emission reduction include a comparison of various RES technologies from environmental and economic aspect (using GACMO tool [21]), but also evaluate the environmental impact of different levels of RES penetration in the power system (using in EnergyPLAN tool in Ćosić et al. [22], [23]). In addition, through the impact assessment of the renewable energy and energy efficiency policies [24], several development pathways of energy system have been set up using the MARKAL model. Also, in order to investigate to which extent and in which way the absorption capacity of the a power system for RES electricity can be improved, scenarios for power system expansion were analysed with EnergyPLAN model [25]. However, neither of these analyses has considered the capacity of the power transmission network in detail.
The methodology applied in the paper is based on application of two models:
Long-term generation expansion planning model – MARKAL, that defines the optimal future capacity mix over period of 20 years;
Network model – for static network analysis (i.e., load-flow analysis).
MARKAL is widely used long-term planning tool that encompasses the entire energy system, from resource extraction to end use demands [26]. It is used to identify the most cost-effective pattern of resource use and technology deployment over selected period (usually 15-40 years) by employing least-cost optimization.
The key input data used in the model include:
Energy balance and hourly load data for the base year;
Current and future fuel prices;
The costs and characteristics of the existing and new technologies on the supply and on the demand side;
Key drivers such as Gross Domestic Product (GDP) and population growth (used for projections of useful energy demand).
MARKAL calculates energy balances at all levels of the energy system: primary sources, secondary fuels, final energy and energy needs of the end technologies. The purpose of the model is to provide energy for end use technologies at minimal total costs, while investing in new equipment and making operating decisions (for example, which production technologies to engage) and primary energy supply decisions, by country. The choice of generation equipment (type and fuel) incorporates analysis of both the characteristics of alternative generation technologies and the costs (economic parameters)of primary energy supply.
MARKAL analyses show not only what is to be constructed (and what is not), but also when and for how much. Based on the engineering and economic representations of energy supply (like mines), conversion plants (such as power plants, heat and power facilities, etc.) and end-use devices (like air conditioners, furnaces, light bulbs, etc.) in each country, the least cost energy supply and demand balance that can satisfy the physical and policy requirements can be explored.
The models like MARKAL have long planning horizon of 15 to 40 years (and more in some cases) in order to capture the long lifetimes of the infrastructure and power plants. But typically, these models incorporate two different temporal resolutions. The first is used to describe the development of capital stock and investment decisions using time steps of up to five years (for MARKAL it is usually three years). The second temporal resolution takes into account the intra-annual variability of the supply and demand, and is mainly driven by the electricity and low-temperature heat consumption. In order to capture the variability of demand, in MARKAL the 8,760 hours that make up a year are broken down into time blocks or “time slices” that capture seasonal and daily variations, based on the hourly load profile of the electricity consumption. Seasonal variations are usually represented by three seasons (summer, winter and intermediate) and daily variations are represented with three blocks (day, night and peak), thus totaling to nine time slices. However, different modelling teams can take different approaches in the way they define the time slices. In MARKAL time-slices are recognized only for technologies producing electricity (seasonal and diurnal) or low-temperature heat (seasonal), both of which may not be easily stored and thus require a finer time disaggregation than other energy carriers.
As discussed before, the long-term models are used to define investment paths and to inform long-term strategic decision making over the development of a national energy system, alongside long-term policy goals. Therefore, the MARKAL model provides a good framework for the evaluation of mid-to-long-term policies and programs that can affect the evolution of the energy system, by quantifying the costs and technologies choices that result from the imposition of such policies and programs.
Network analysis are typically implemented to evaluate a network at a particular “operational point” i.e., a given point in time ‒ for a given capacity mix, for a given network infrastructure and its topography, and for a given dispatch scenario. The aim of this analysis is to evaluate technical bottlenecks in a system to maintain the required levels of reliability.
The load-flow analysis is performed using static grid models, in order to assess the needs for enhancing the grid, mainly to avoid network congestion. A simple version of load-flow analysis is Direct Current Load Flow (DCLF), which looks only at active power flows and neglects reactive power flows. This method is non-iterative and convergent, primarily used when repetitive and fast load flow estimations are required.
In DCLF, nonlinear model of the Alternate Current (AC) system is simplified to a linear form through these assumptions:
Line resistances (active power losses) are negligible, i.e., R << X;
Voltage angle differences are assumed to be small, i.e., sinθi≈θi and cosθi≈1;
Magnitudes of bus voltages are Ui = 1 p.u. (flat voltage profile);
Tap settings are ignored.
Thus, the variables of DCLF are voltage angles and active power injections, the last are known in advance. Therefore, for each bus i in the system the following equation applies:
(1)
where Bij is the imaginary part of the admittance matrix Yij and is reciprocal of the reactance of the line. As a result, active power flow through transmission line between buses k and l, can be calculated as:
(2)
In this paper, an integrated approach will be applied with aim to incorporate the grid expansion needs and costs (based on DC load flow analysis), necessary for increased renewable electricity penetration.
The already developed MARKAL-Macedonia model will be used as a case study. The model uses a rather simplified representation of the transmission network in the MARKAL model, i.e., the whole network is represented by one technology with defined capacity and costs.
The analysis in this paper will try to assess the transmission network capacity for acceptance of the variable renewable energy acceptance at specific location using a DCLF model, based on the optimal output for generation capacity mix from the MARKAL-Macedonia model.
The MARKAL-Macedonia model has been developed for almost a decade and it has been continuously improved in the processes of its application. The model was used for development of the National Energy Strategy [27], for the climate change mitigation analyses as a part of the reporting documents to UNFCCC (like National Communications [28] and Biennial Update Reports [29], [30]), and also for determination of the Intended Nationally Determined Contributions (INDC’s) [31]. The model was also used for analysing the implementation of different policies and programs that promote energy efficiency and renewable energy [24], for assessing the impact of various low-carbon policies [32], [33], for analysing the impact of changes in the fuel mix for electricity production [34] and the impact of climate changes on the energy demand [35].
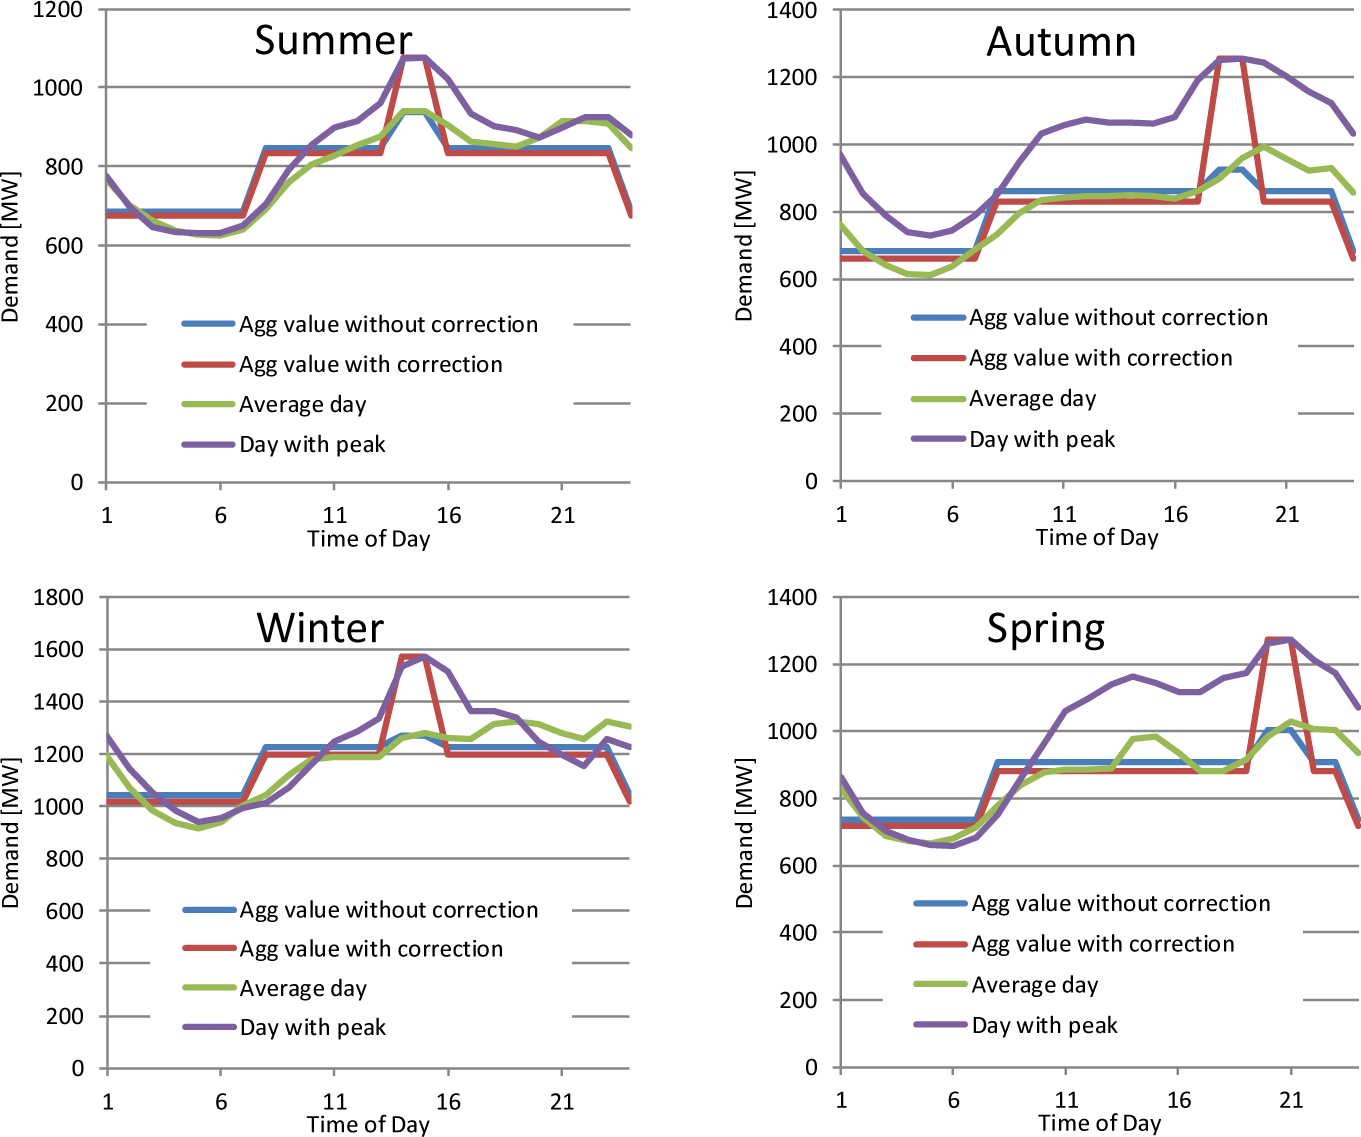
For the purpose of the analysis of this paper, the model version developed for the INDC’s determination is used. This model has a comprehensive database of technologies (including RES) on both power generation side and demand side. As it was noted before, the temporal resolution of the model is important to better capture the variability of demand and renewable sources. Therefore, for this analysis an improvement of the model was made, by changing the seasonal resolution of the model from three seasons (summer, winter and intermediate) to four (spring, summer, autumn and winter). The representation of the daily variations remains the same. Thus, the model now incorporates 12 time slices instead of the initial nine. Based on the electricity load profile for the base year, taking into account the load curves for an average day and for the day with a peak, for each of the seasons, the load profile for each season was adjusted in the model (see Figure 1).
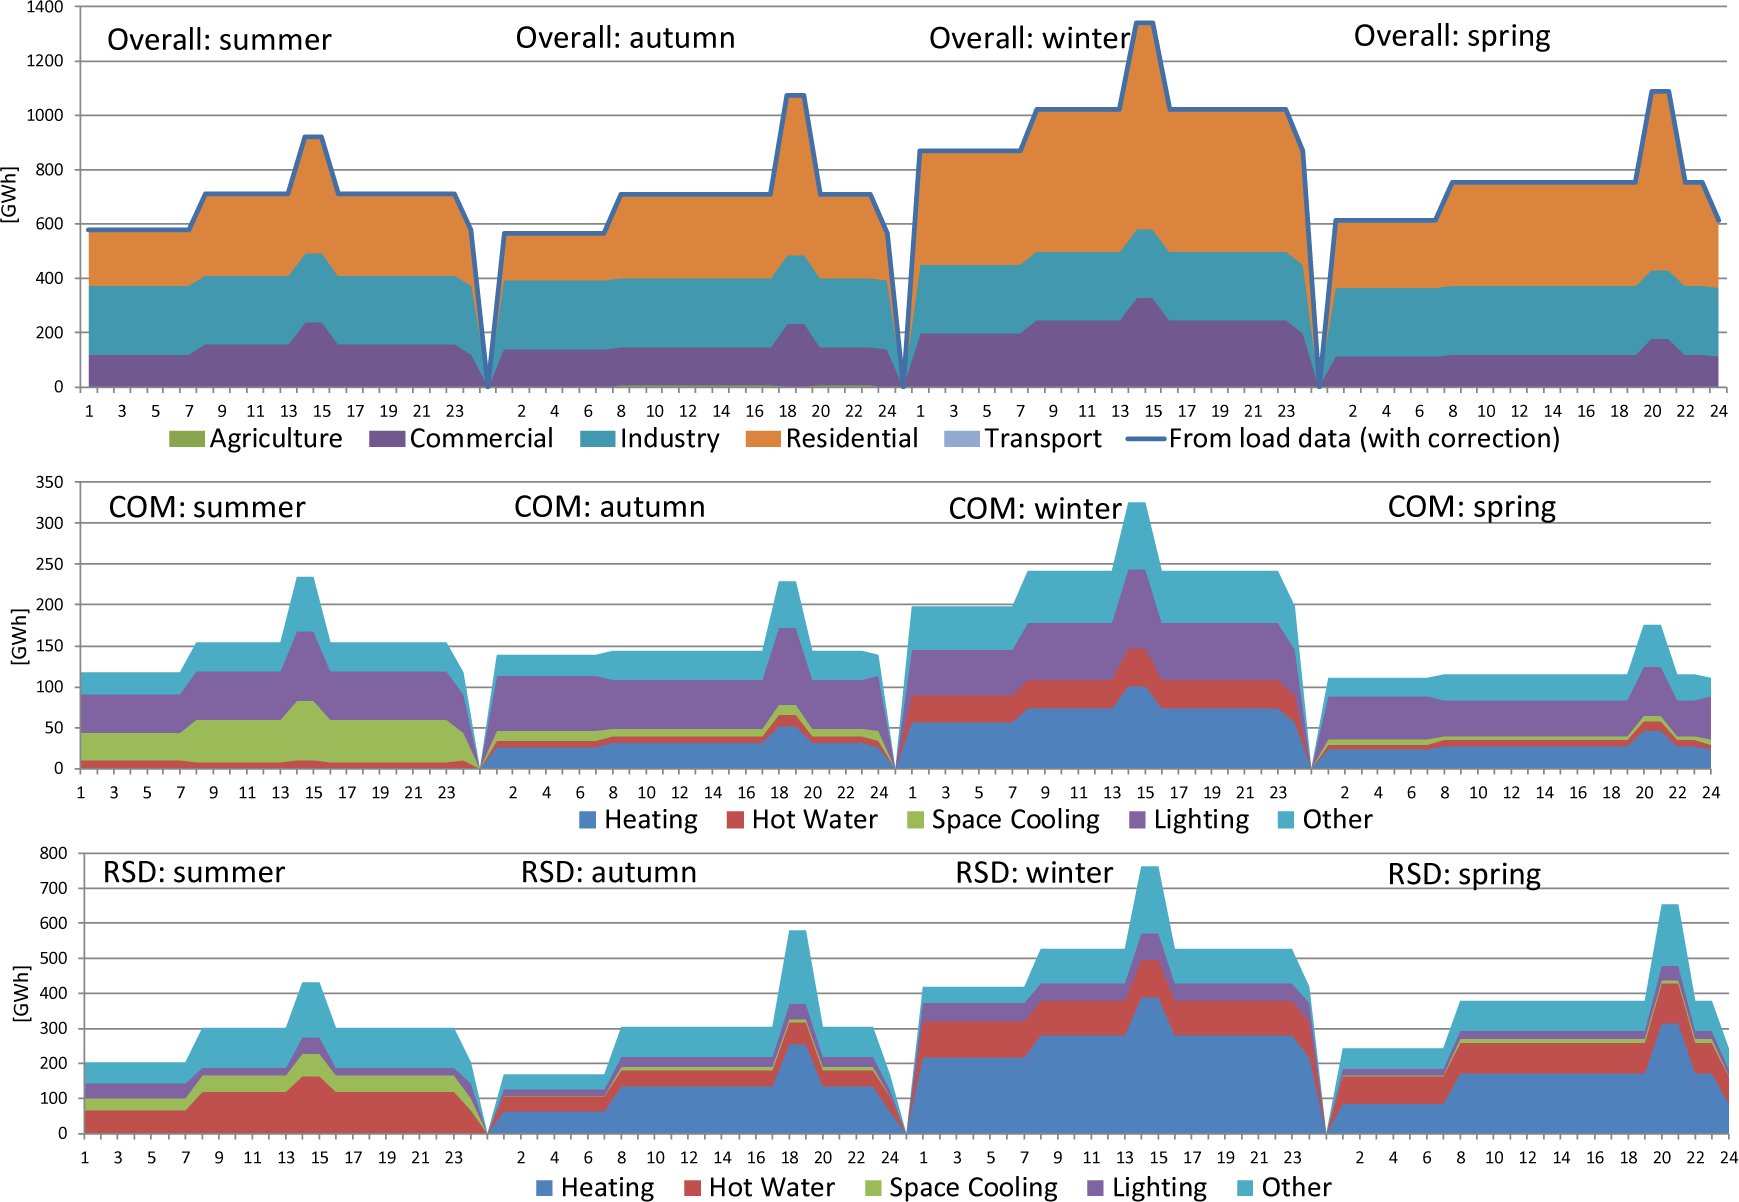
Furthermore, a more detailed calibration of the load profile was made, first by sectors used in the model, then by useful energy demand for both sectors (commercial and residential) in which the seasonal and daily variations of the demand are most evident (see Figure 2).
In addition to these changes on the demand side data, changes were also made in the availability factors on the supply side to reflect the new temporal resolution in the model. Namely, the previous seasonal availability factors for RES were redistributed to the new 12 time-slices.
Seasonal load profile
Seasonal load calibration by sectors
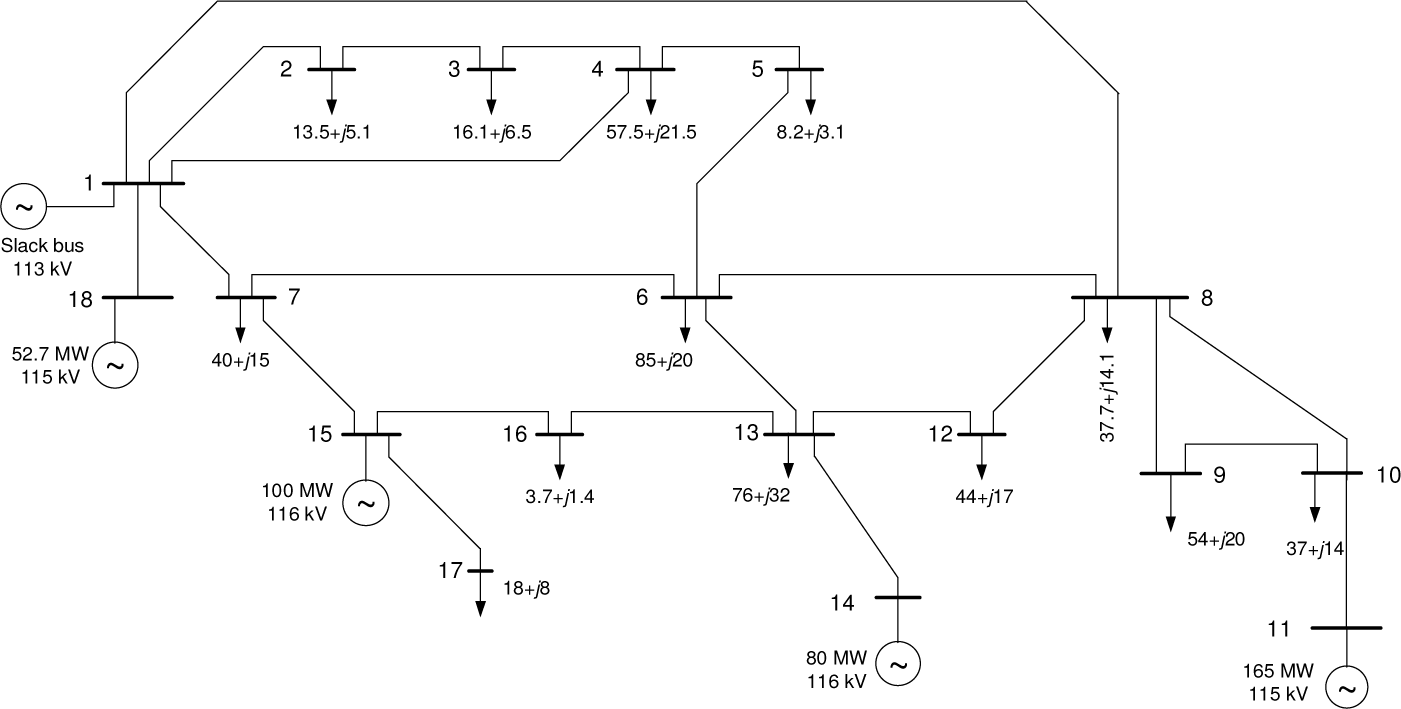
Based on the methodology described before, a simple code was developed in MATLAB, using Mathpower tool, in order to test this approach. As a first step, a part of the transmission network at a specific location was selected to perform the DCLF analyses as a test of the DCLF model (Figure 3).
Selected part of the transmission network
The initial network parameters used for the analyses are given in the following tables (Table 1 and Table 2).
Loads (L) and generation (G) parameters
| Node number | Type | Un [kV] | PL [MW] | QL [MVAr] | PG [MW] | PGmin [MW] | PGmax [MW] |
|---|---|---|---|---|---|---|---|
| 1 | 3 | 110 | - | - | 100.0 | - | 150.0 |
| 2 | 1 | 110 | 13.5 | 5.1 | - | - | - |
| 3 | 1 | 110 | 16.1 | 6.5 | - | - | - |
| 4 | 1 | 110 | 57.5 | 21.5 | - | - | - |
| 5 | 1 | 110 | 8.2 | 3.1 | - | - | - |
| 6 | 1 | 110 | 85.0 | 20.0 | - | - | - |
| 7 | 1 | 110 | 40.0 | 15.0 | - | - | - |
| 8 | 1 | 110 | 37.7 | 14.1 | - | - | - |
| 9 | 1 | 110 | 54.0 | 20.0 | - | - | - |
| 10 | 1 | 110 | 37.0 | 14.0 | - | - | - |
| 11 | 2 | 110 | - | - | 165.0 | 100.0 | 180.0 |
| 12 | 1 | 110 | 44.0 | 17.0 | - | - | - |
| 13 | 1 | 110 | 76.0 | 32.0 | - | - | - |
| 14 | 2 | 110 | - | - | 80.0 | - | 85.0 |
| 15 | 2 | 110 | - | - | 100.0 | 80.0 | 120.0 |
| 16 | 1 | 110 | 3.7 | 1.4 | - | - | - |
| 17 | 1 | 110 | 18.0 | 8.0 | - | - | - |
| 18 | 2 | 110 | - | - | 52.7 | - | 80.0 |
Parameters of the branches
| Branch number | From node | To node | L [km] | X [p.u.] | PLmax [MW] |
|---|---|---|---|---|---|
| 1 | 1 | 2 | 13.5 | 0.045632 | 116.9 |
| 2 | 2 | 3 | 15.0 | 0.050702 | 116.9 |
| 3 | 3 | 4 | 2.5 | 0.008450 | 116.9 |
| 4 | 4 | 5 | 20.5 | 0.069293 | 116.9 |
| 5 | 5 | 6 | 8.0 | 0.027041 | 116.9 |
| 6 | 1 | 4 | 31.8 | 0.107489 | 116.9 |
| 7 | 1 | 7 | 8.0 | 0.027041 | 116.9 |
| 8 | 7 | 6 | 36.3 | 0.122700 | 116.9 |
| 9 | 7 | 15 | 37.0 | 0.125066 | 116.9 |
| 10 | 15 | 17 | 15.0 | 0.050702 | 116.9 |
| 11 | 15 | 16 | 17.5 | 0.059153 | 116.9 |
| 12 | 16 | 13 | 47.6 | 0.160896 | 116.9 |
| 13 | 6 | 13 | 41.5 | 0.140277 | 116.9 |
| 14 | 6 | 8 | 44.5 | 0.150417 | 116.9 |
| 15 | 8 | 12 | 11.1 | 0.037520 | 116.9 |
| 16 | 12 | 13 | 20.8 | 0.070307 | 116.9 |
| 17 | 13 | 14 | 30.0 | 0.101405 | 116.9 |
| 18 | 8 | 9 | 1.9 | 0.006422 | 116.9 |
| 19 | 8 | 10 | 4.9 | 0.016563 | 116.9 |
| 20 | 9 | 10 | 4.0 | 0.013521 | 116.9 |
| 21 | 11 | 10 | 4.0 | 0.006083 | 293.6 |
| 22 | 18 | 1 | 28.0 | 0.094645 | 116.9 |
| 23 | 1 | 8 | 65.2 | 0.056579 | 293.6 |
Considering these input data for the transmission network, the results for the power flows given in Table 3 are obtained, from which it can be seen that there are no overloaded branches.
Power flows results based on initial network data
| From node | To node | P [MW] | % of Pmax |
|---|---|---|---|
| 1 | 2 | 61.5 | 52.6 |
| 2 | 3 | 48.0 | 41.1 |
| 3 | 4 | 31.9 | 27.3 |
| 4 | 5 | 25.6 | 21.9 |
| 5 | 6 | 17.4 | 14.9 |
| 1 | 4 | 51.2 | 43.8 |
| 1 | 7 | 49.5 | 42.3 |
| 7 | 6 | 52.3 | 44.7 |
| 7 | 15 | -42.8 | 36.6 |
| 15 | 17 | 18.0 | 15.4 |
| 15 | 16 | 39.2 | 33.5 |
| 16 | 13 | 35.5 | 30.4 |
| 6 | 13 | -26.7 | 22.8 |
| 6 | 8 | -26.6 | 22.8 |
| 8 | 12 | 31.2 | 26.7 |
| 12 | 13 | -12.8 | 11.0 |
| 13 | 14 | -80.0 | 68.5 |
| 8 | 9 | -13.6 | 11.6 |
| 8 | 10 | -60.4 | 51.7 |
| 9 | 10 | -67.6 | 57.8 |
| 11 | 10 | 165.0 | 56.2 |
| 18 | 1 | 52.7 | 45.1 |
| 1 | 8 | 21.5 | 7.3 |
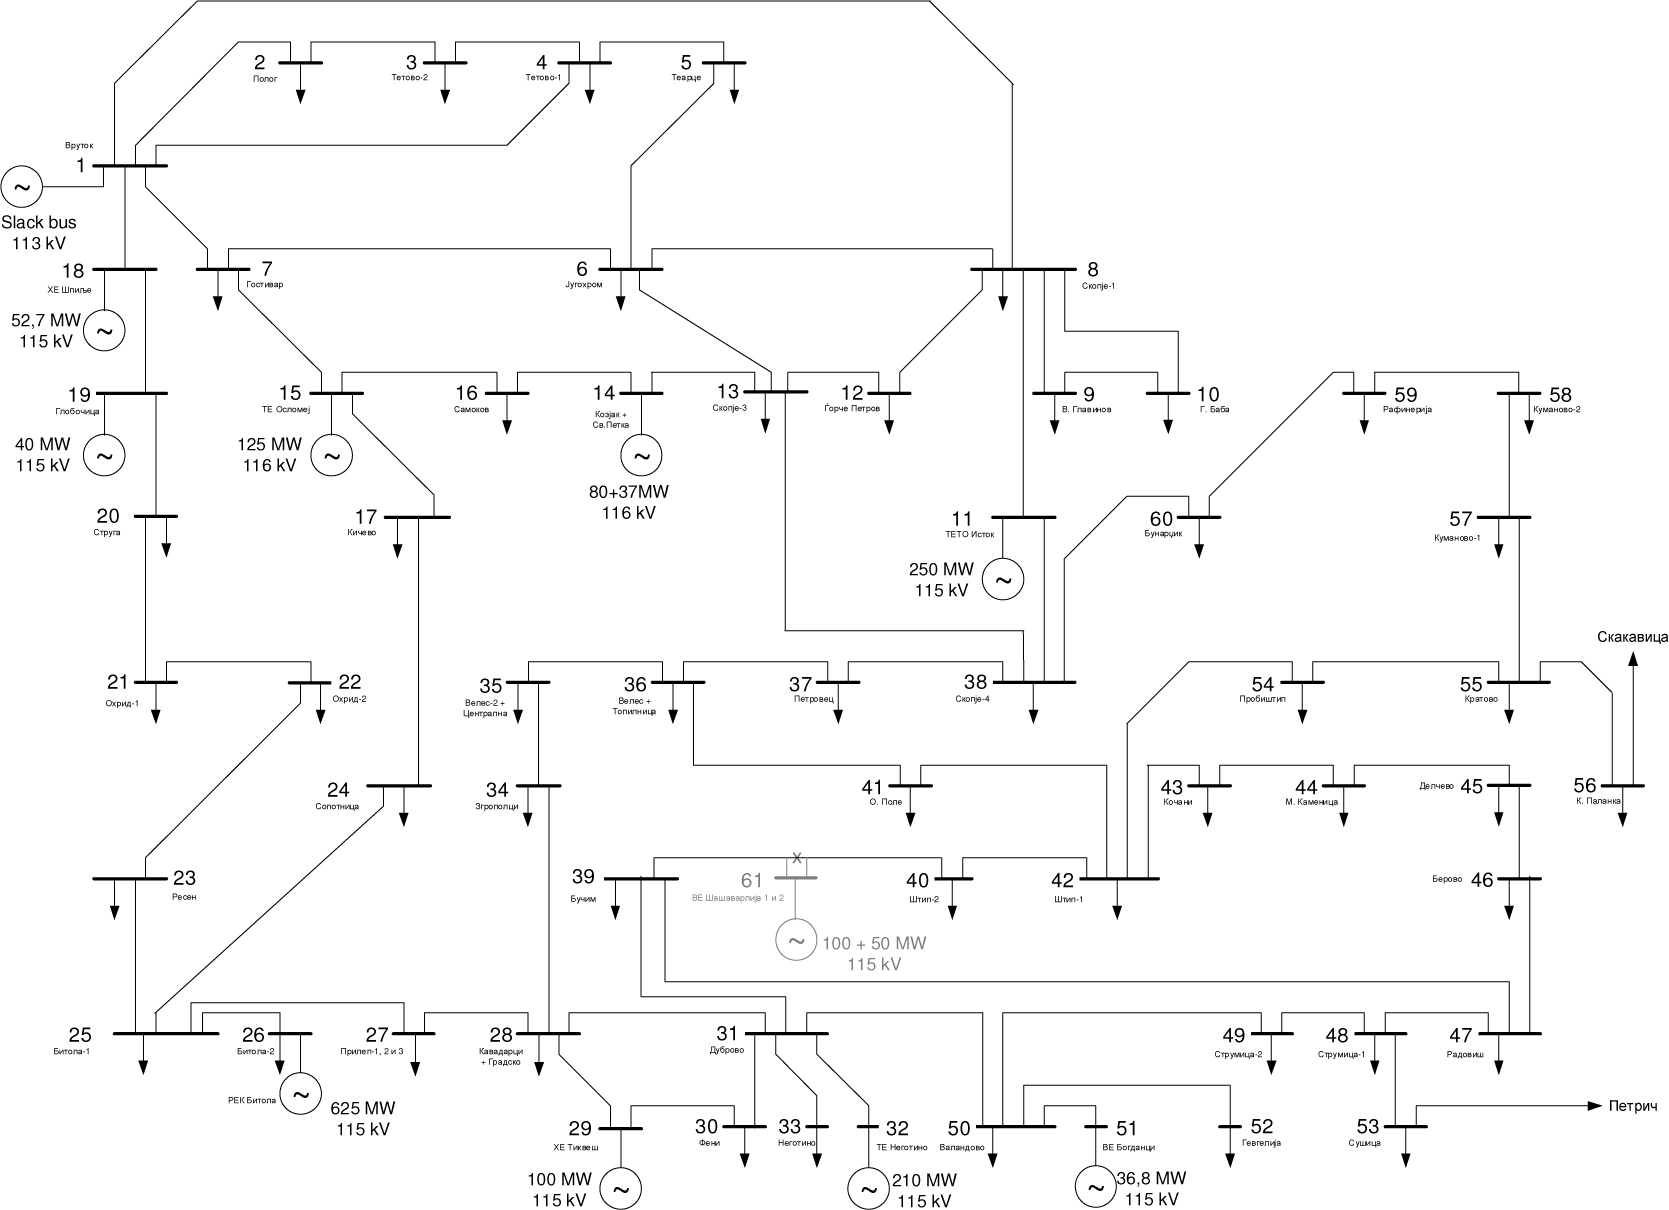
As a next step, in order to be compatible with the MARKAL-Macedonia model, the DCLF analysis was performed for the entire transmission network. Having in mind that in case of Macedonia the larger power plants on RES are connected to the 110 kV transmission network, only this part of the network (consisting of 105 nodes and 146 branches) was taken into account. A simplified scheme of the analysed network is presented in Figure 4. Due to the extensive network data, the presented results from the DCLF analyses will be limited to the critical (overloaded) branches.
Simplified scheme of the 110 kV transmission network
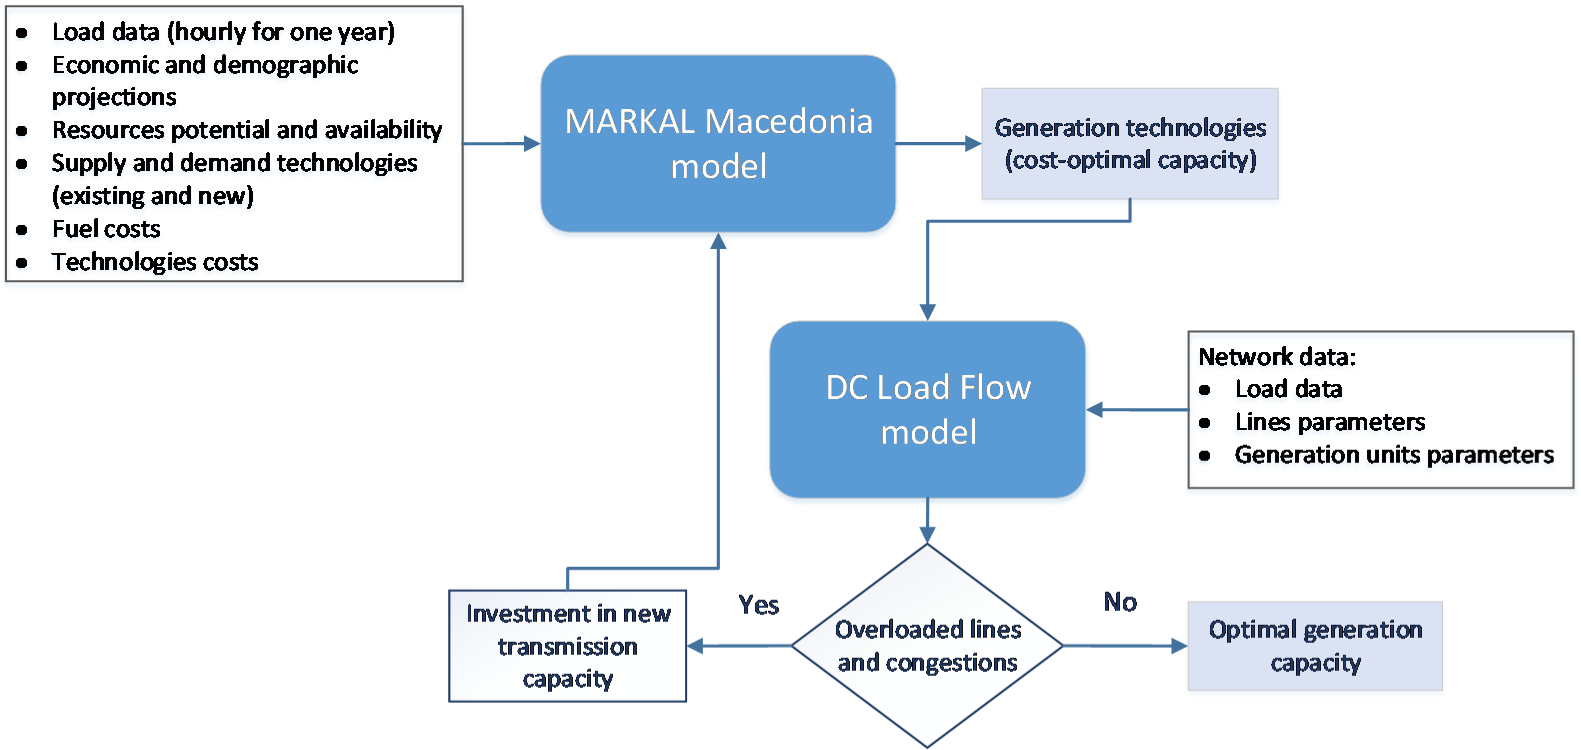
To perform the analysis, a soft-link was created between MARKAL model and DC load flow model, as shown in Figure 5, i.e., the results from MARKAL model for the generation capacity of the units at the considered location are used as an input to the load flow model.
Two scenarios were run in the MARKAL model:
Business- as- Usual (BAU) scenario, which takes into account only the currently installed generation units;
Renewable (RNW) scenario, where new renewable technologies were made available for selection in the model.
Overall modelling approach
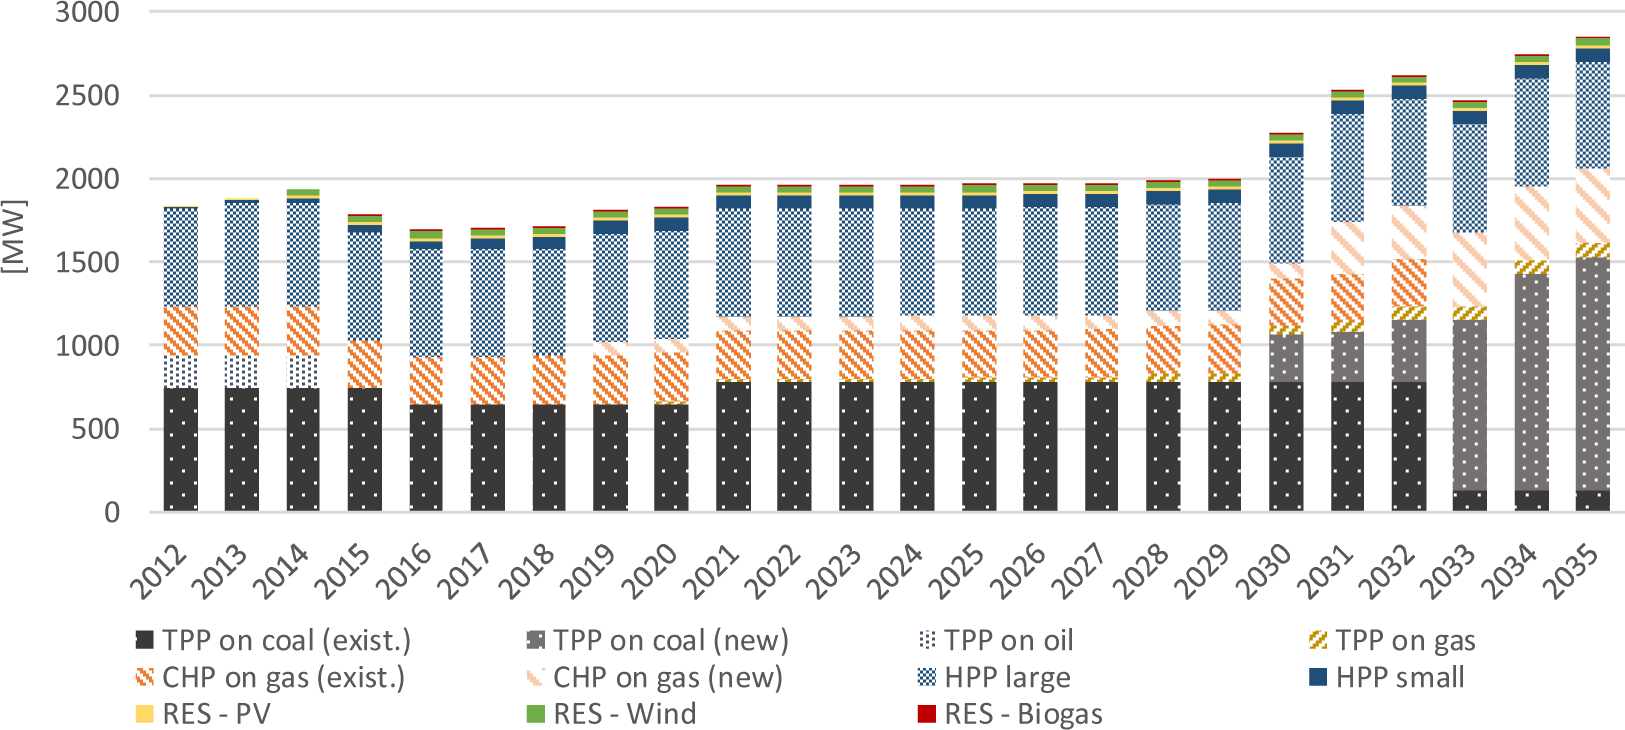
From the vast output results that the MARKAL model is providing, in this paper the focus will be on the technologies for electricity generation and their installed capacity.
The results from the BAU scenario, presented in Figure 6, show that the existing fossil fuels plants (coal and gas) will continue to work and they will be replaced with new ones after 2030, with even higher installed capacity. Considering the RES, the large Hydro Power Plants (HPP) will continue to dominate with their installed capacity, but there is also a gradual breakthrough of the remaining renewable sources, such as small hydropower plants, photovoltaic power plants, wind power plants and biogas plants.
Installed capacity for electricity generation (in MW) under the BAU scenario
The changes in the installed capacity of the power plants in the RNW relative to the reference scenario are shown in Figure 7, where it can be noticed that the wind power plants become a more cost-effective option. Their total installed capacity is increasing gradually, which result in total installed capacity of 410 MW by the end of the analysed period. First the capacity of the existing wind power plant will increase from 36.8 MW to 50 MW (by 2019), then new wind power plants will be included ‒ 50 MW in the period 2020-2024, another 50 MW after 2025, additional 130 MW between 2030-2039 and 130 MW in 2040.
Changes in the installed electricity generation capacity in the Renewable scenario relative to BAU
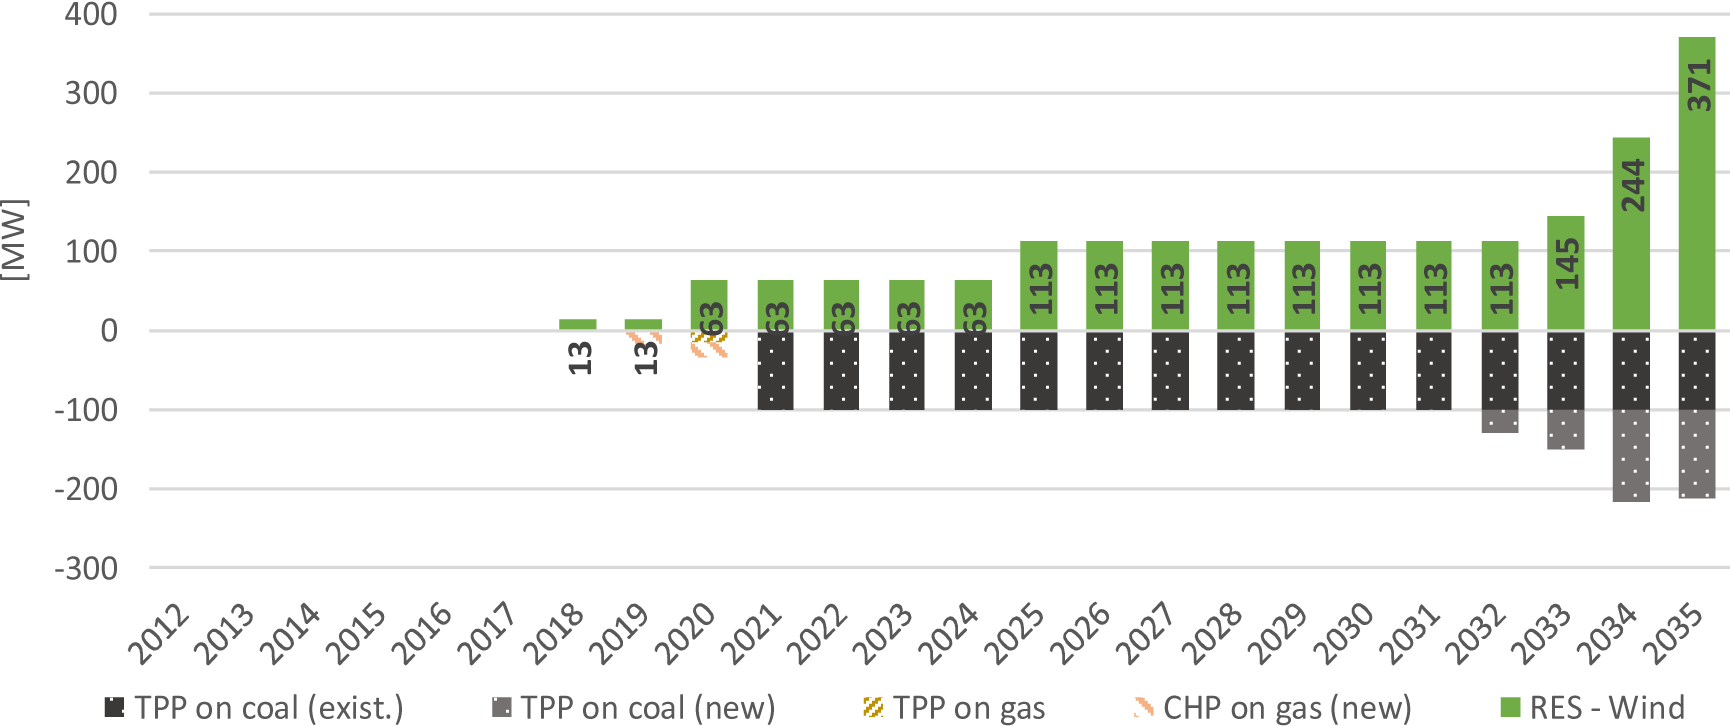
In this scenario, the investment for revitalization for one of the existing Thermal Power Plants (TPP) with installed capacity of 125 MW is not considered as a cost-optimal option, as well as the investment in some of the new thermal power plants. For the other power plants, it can be considered that their installed capacity will remain the same as in the BAU scenario.
According to the results from the least-cost optimization model, the power plant (generator) in node 15 is not operating, but new renewable capacity is built. When testing the approach on a part of the transmission network (shown in Figure 3), three different cases are analysed taking into consideration the results for installed capacity of the power plants:
Case 1, based on the BAU scenario ‒ introduction of 36.8 MW of wind power plants is tested;
Case 2, based on the RNW scenario (results for 2020) ‒ introduction of 50 MW wind power plant is tested;
Case 3, based on the RNW scenario (results for 2025) ‒ introduction of 100 MW wind power plant is tested.
The tests are performed for each consumer node of the selected part of the network.
The results from the DC load flow analysis (Table 4) show that in both cases based on RNW scenario, when a wind power plant is connected in nodes 2, 3 and 4, the line from node 1 to node 7 is overloaded. This means that new investment will be required to enhance the transmission network.
After demonstrating that DC power flow model works on a part of a network, in the next step the model was tested for the whole transmission network.
Power flow rate (as % from PLmax), results of the test on the part of the network
| Scenario, Case | Node | Branch 1-7 |
|---|---|---|
| BAU Case 1 (36.8 MW) | 2 | 40.2 |
| 3 | 37.7 | |
| 4 | 37.3 | |
| RNW Case 2 (50 MW) | 2 | 105.3 |
| 3 | 102.1 | |
| 4 | 101.6 | |
| RNW Case 3 (100 MW) | 2 | 121.1 |
| 3 | 114.7 | |
| 4 | 113.6 |
Four cases were considered for the power flow analyses on the 110 kV transmission network, based on the output for the RNW scenario. Therefore, the four cases are selected in relation to the characteristic years in which the installed capacity for electricity generation from RES (more precisely, wind power plants) is increasing. Having in mind that several locations with wind potential are already identified, several combinations of connection points for wind power plant was made (summarized in Table 5).
Selected location for wind power plants integration
| [MW] | Case 1 | Case 2 | Case 3 | Case 4 | |||
|---|---|---|---|---|---|---|---|
| Node | RNW 2020 | RNW 2025 | RNW 2030-2035 | After 2035 | |||
| 3.1 | 3.2 | 3.3 | 3.4 | ||||
| 51. Bogdanci | 50 | 50 | 100 | 50 | 50 | 50 | 100 |
| 61. Sasavarlija 1 | 50 | 100 | 100 | 100 | 100 | 50 | 100 |
| 61. Sasavarlija 2 | 0 | 50 | 50 | ||||
| 52. Gevgelija | 20 | 40 | 40 | ||||
| 7. Gostivar | 30 | 30 | |||||
| 41. Bogoslovec | 30 | 30 | 20 | 30 | |||
| 62. Krusevo | 0 | 80 | 160 | 20 | |||
| 46. Berovo | 0 | 20 | 20 | ||||
| 14. Kozjak | 0 | 20 | 20 | 20 | |||
| Total | 100 | 150 | 280 | 280 | 280 | 280 | 410 |
According to the DCPF results for the considered cases, it is found that in general, the load of the transmission lines in the network is within the allowed limits. Table 6 gives an overview in which lines the load exceeds the maximal allowed value, for each of the considered cases.
Overloaded lines, results from DCLF on the whole network
| Line between nodes | ΔP/Pmax [%] | |
|---|---|---|
| Case 1 | 25. Bitola 1 – 24. Sopotnica | 5.1 |
| Case 2 | 25. Bitola 1 – 26. Bitola 2 | 4.5 |
| 25. Bitola 1 – 24. Sopotnica | 13.9 | |
| 26. Bitola2 – 27. Prilep 1 | 0.3 | |
| Case 3.1 | 50. Valandovo – 51. WPP Bogdanci | 7.5 |
| Case 3.2 | - | - |
| Case 3.3 | 39. Bucim – 61. WPP Sasavarlija | 22.0 |
| Case 3.4 | - | - |
| Case 4 | 39. Bucim – 61. WPP Sasavarlija | 22.0 |
| 50. Valandovo – 51. WPP Bogdanci | 7.5 |
Based on these results, as the most critical lines would be:
Between nodes 39 and 61, where new wind power plant is planned to be build);
Between nodes 50 and 51 (if the capacity of the existing wind power plant doubles);
Between nodes 25 and 24 (where due to the decommissioning of one of the existing coal power plants the generation capacity in this part of the network is insufficient).
Therefore, certain investment for reinforcing of these transmission lines should be made, in order to be able to achieve the optimal distribution of the electricity generation capacities derived from the MARKAL model.
The integrated approach was first tested on the selected part of the network. In this case, one possible solution to increase the transmission capacity of the line 1-7 is to invest in new transmission line with the same parameters as the existing. If it is assumed that a construction of a new high voltage transmission line (voltage rate of 110 kV) will cost approximately 80,000 EUR/km, and considering the length of the overloaded line 1-7 (around 40 km), then additional investment costs of 3.2 M EUR in transmission network will need to be taken into account in MARKAL-Macedonia model. By re-running the MARKAL-Macedonia model including this investment, the new output of the model shows no changes in the installed generation capacities, but the investment in the transmission network will increase by 71% (from previous 83 M EUR to 141 M EUR) and the total cost for the overall energy system will increase by 0.2%. Then, the next iteration of the DC load flow model will include new additional line between nodes 1 and 7, and in the Case 3 when a wind power plant of 100 MW is connected in node 4, the results show that the load in this part of the network will not exceed the maximal limit, i.e., the power flow in each of the lines between nodes 1 and 7 will be 64.7% of the maximal permitted load.
The application of integrated approach on the entire network will include improvement of the transmission network by investing in two new transmission lines (between nodes 50-51 and 39-61) to connect the new wind power plants, and replacement of the existing line (between nodes 24-25) with new one with higher cross-section of conductors. The total length of these power lines is 52.5 km and assuming the same costs for construction of a new 110 kV transmission line at around 80,000 EUR/km, then for the reinforcement of the network 4.2 M EUR will be required. Incorporating this investment in the MARKAL-Macedonia model and re-iterating the run for the RNW scenario, will result with same optimal distribution of the generation capacities (except that some of the TPP will be introduced earlier in the system), and increased investment in the transmission network for 95% (from previous 83 M EUR to 161 M EUR). The total cost for the overall energy system will increase by 0.3%.
The second iteration of the DC load flow model using the improved parameters of the network and running the most critical cases, like Case 2 and Case 4 (from Table 5) will result with optimal power flow in all the lines. In Case 2, previously overloaded line between nodes 24-25 now has 85% of the maximal load allowed, while in Case 4 the construction of the new lines will decrease the power flow in lines 50-51 and 39-61 to 54% and 61% of the maximal permitted, respectively.
This means that the cycle of iterative execution of both models will end, i.e., the installed capacity for electricity production resulting from the MARKAL model can be considered as an optimal solution from the aspect of the total costs of the energy system, including the investments in the transmission network. Given that the electricity system considered in this paper is relatively small, the optimal solution for the electricity generation capacities is obtained in a few iterations, utilizing all available options for power system development at the lowest possible cost.
The research conducted in this paper, by applying an integrated approach, has shown that the solution derived from MARKAL-Macedonia model for the installed capacity of VRE sources and the optimal time for their inclusion in the system, will require additional investment for expansion or improvement of the transmission network. By linking the results of MARKAL-Macedonia to the DC-model for the Macedonian transmission network, it was shown that the inclusion of the RES capacity at certain locations in the power system can lead to an overload of the transmission lines near those locations.
This confirms the hypothesis that the simplified representation of the transmission network in the long-term energy modeling tools does not reflect properly the capacity for integration of the variable renewable energy capacity.
The following conclusions can be summarized:
The planning of the energy transition towards a higher share of RES requires a more integrated approach than the one that usually practiced in the long-term planning tools;
Incorporation of the investment needs in transmission capacity in the planning of the generation mix may have a considerable effect on the cost-effectiveness of long-term planning scenarios;
Establishing feedback link between the stages of the planning process can allow for more cost-effective investment.
One specific energy modeling tool cannot address all aspects of a single energy system with high precision, therefore a better observations and a greater planning progress can be achieved by drawing on the advantages of several modeling tools rather than attempting to include all of them in a one comprehensive model.
- , Global Energy Transformation: A Roadmap to 2050, 2018
- ,
State-of-the-art Generation Expansion Planning: A Review ,Appl. Energy , Vol. 230 ,pp 563-589 , 2018, https://doi.org/https://doi.org/10.1016/j.apenergy.2018.08.087 - ,
A Comprehensive Sequential Review Study Through the Generation Expansion Planning ,Renew. Sustain. Energy Rev. , Vol. 67 ,pp 1369-1394 , 2017, https://doi.org/https://doi.org/10.1016/j.rser.2016.09.046 - ,
A Review of Computer Tools for Analysing the Integration of Renewable Energy into Various Energy Systems ,Appl. Energy , Vol. 87 (4),pp 1059-1082 , 2010, https://doi.org/https://doi.org/10.1016/j.apenergy.2009.09.026 - , Planning for the Renewable Future: Long-Term Modelling and Tools to Expand Variable Renewable Power in Energing Economies, 2017
- ,
Generation Expansion Planning with High Share of Renewables of Variable Output ,Appl. Energy , Vol. 190 ,pp 1275-1288 , 2017, https://doi.org/https://doi.org/10.1016/j.apenergy.2017.01.025 - ,
Optimization Modeling to Support Renewables Integration in Power Systems ,Renew. Sustain. Energy Rev. , Vol. 55 ,pp 316-325 , 2016, https://doi.org/https://doi.org/10.1016/j.rser.2015.10.116 - ,
Impact of the Level of Temporal and Operational Detail in Energy-system Planning Models ,Appl. Energy , Vol. 162 ,pp 631-643 , 2016, https://doi.org/https://doi.org/10.1016/j.apenergy.2015.10.100 - ,
Do Unit Commitment Constraints Affect Generation Expansion Planning? A Scalable Stochastic Model ,Energy Syst. ,pp 1-36 , 2018 - , Impact of Unit Commitment Constraints on Generation Expansion Planning with Renewables, Proceedings of the 2011 IEEE Power and Energy Society General Meeting, 2011
- ,
Soft-linking of a Power Systems Model to an Energy Systems Model ,Energy , Vol. 42 (1),pp 303-312 , 2012, https://doi.org/https://doi.org/10.1016/j.energy.2012.03.052 - ,
Operational Flexibility and Economics of Power Plants in Future Low-carbon Power Systems ,Appl. Energy , Vol. 156 ,pp 107-128 , 2015, https://doi.org/https://doi.org/10.1016/j.apenergy.2015.06.065 - ,
On Representation of Temporal Variability in Electricity Capacity Planning Models ,Energy Econ. , Vol. 59 ,pp 261-274 , 2016, https://doi.org/https://doi.org/10.1016/j.eneco.2016.08.001 - ,
Fluctuating Renewables in a Long-term Climate Change Mitigation Strategy ,Energy , Vol. 36 (11),pp 6674-6685 , 2011, https://doi.org/https://doi.org/10.1016/j.energy.2011.08.021 - ,
Wide Scale Penetration of Renewable Electricity in the Greek Energy System in View of the European Decarbonization Targets for 2050 ,Renew. Sustain. Energy Rev. , Vol. 42 ,pp 158-169 , 2015, https://doi.org/https://doi.org/10.1016/j.rser.2014.10.007 - ,
Incorporating Flexibility Requirements into Long-term Energy System Models – A Case Study on High Levels of Renewable Electricity Penetration in Ireland ,Appl. Energy , Vol. 135 ,pp 600-615 , 2014, https://doi.org/https://doi.org/10.1016/j.apenergy.2014.08.072 - , Pathways to a Low Carbon Economy: Energy Systems Modelling, Working Paper, 2009
- , Representation of Solar Capacity Value in the ReEDS Capacity Expansion Model Representation of Solar Capacity Value in the ReEDS Capacity Expansion Model, Proceedings of the 40th IEEE Photovoltaic Specialists Conference, 2014
- ,
A Reduced-form Approach for Representing the Impacts of Wind and Solar PV Deployment on the Structure and Operation of the Electricity System ,Energy Econ. , Vol. 64 ,pp 651-664 , 2017, https://doi.org/https://doi.org/10.1016/j.eneco.2016.07.010 - ,
High-resolution Modeling Framework for Planning Electricity Systems with High Penetration of Renewables ,Appl. Energy , Vol. 112 ,pp 215-223 , 2013, https://doi.org/https://doi.org/10.1016/j.apenergy.2013.05.074 - ,
The Potentional of Renewable Energy Sources for Greenhouse Gases Emissions Reduction in Macedonia ,Therm. Sci. , Vol. 16 (3),pp 717-728 , 2012, https://doi.org/https://doi.org/10.2298/TSCI120202128D - ,
Environmental and Economic Aspects of Higher RES Penetration into Macedonian Power System ,Appl. Therm. Eng. , Vol. 43 ,pp 158-162 , 2012, https://doi.org/https://doi.org/10.1016/j.applthermaleng.2011.10.042 - ,
The Potential of GHG Emissions Reduction in Macedonia by Renewable Electricity ,Chem. Eng. Trans. , Vol. 25 ,pp 57-62 , 2011, https://doi.org/https://doi.org/10.3303/CET1125010 - ,
Assessment of the Impact of Renewable Energy and Energy Efficiency Policies on the Macedonian Energy Sector Development ,J. Renew. Sustain. Energy , Vol. 5 (4),pp 041814 , 2013, https://doi.org/https://doi.org/10.1063/1.4813401 - ,
Increasing the Renewable Energy Sources Absorption Capacity of the Macedonian Energy System ,J. Renew. Sustain. Energy , Vol. 5 (4),pp 041805 , 2013 - ,
Documentation for the MARKAL Family of Models, Energy Technology Systems Analysis Programme ,pp 1-389 , 2004 - , Strategy for Energy Development of the Republic of Macedonia up to 2035, 2015
- , Third National Communication on Climate Change, 2013
- , First Biennial Update Report on Climate Change, 2014
- , Second Biennial Update Report on Climate Change, 2017
- , Intended Nationally Determined Contributions, 2015
- ,
Towards Post-2020 Climate Change Regime: Analyses of Various Mitigation Scenarios and Contributions for Macedonia ,Energy , Vol. 94 ,pp 124-137 , 2016, https://doi.org/https://doi.org/10.1016/j.energy.2015.10.085 - ,
Low Emissions Development Pathways of the Macedonian Energy Sector ,Renew. Sustain. Energy Rev. , Vol. 53 ,pp 1202-1211 , 2016, https://doi.org/https://doi.org/10.1016/j.rser.2015.09.044 - ,
Exploring the Impact of Reduced Hydro Capacity and Lignite Resources on the Macedonian Power Sector Development ,Therm. Sci. , Vol. 18 (3),pp 721-730 , 2014, https://doi.org/https://doi.org/10.2298/TSCI1403721T - ,
Evaluation of Climate Change Impacts on Energy Demand ,Energy , Vol. 48 (1),pp 88-95 , 2012, https://doi.org/https://doi.org/10.1016/j.energy.2012.06.053


