


The sugar-alcohol industry stands out as one of Brazil’s most important productive sectors, currently accounting for 25% of the world’s sugar [1] and 20% of its ethanol production [2]. The sector is undergoing modernization and growth due to changes in the national economic scenario. This movement seeks to expand positions in the international scenario, without, however, failing to supply domestic demands.
The consolidation of ‘flex-fuel’ (gasoline-ethanol) technology in Otto-cycle engines for the internal market and the creation of mechanisms aiming at commercializing surplus electrical power are considered the main drivers concerning the opening of new business fronts for Brazilian ethanol abroad [3].
Considering this context, companies operating in this field must always raise their level of competitiveness, increasing income and/or decreasing expenses. In order to do so, they strive to adopt practices aimed at improving agricultural productivity and industrial performance, and at reusing the waste discharged by industrial plants, i.e., vinasse, filter cake, and ashes, and in the field, as in the case of lignocellulosic material like bagasse and sugarcane straw [4].
Until some years ago, the use of bagasse generated during sugarcane milling was restricted to meeting the energy demands (steam and electricity) of the plants themselves [5]. However, the expansion of the Brazilian electrical sector, favoring the trading of surplus energy and providing interesting financing opportunities, has created conditions for industrial plants to invest in high potential cogeneration systems, capable of operating at up to 100 bar pressures [6]. This progress raised the rate of electricity export for energy providers, reduced the dominance of hydropower plants over the national grid and, thus, also decreased discontinued supply problems that this hegemony brings about during the dry season [7].
Moreover, when State Law 11.241/2002, determining straw burning phasing out and implementing mechanized harvesting in the state of Sao Paulo, the main sugarcane producer in Brazil, came effectively into force in 2017, large biomass volumes became liabilities in this production chain. The convergence of such circumstances, technological and in terms of available raw material, ended up enabling the reuse of this material as a complementary fuel for Rankine cogeneration cycles, raising the offer of electricity in the network [8].
Reusing straw may be interpreted as an adjustment of already existing conditions. In this context, the establishment of technical and economic factors, i.e., the availability of straw for energy use, rates and type of system for biomass recovery, physical features, optimized transport distances, and reuse technology, remain a great challenge for the sector [9]. Cardoso et al. [10] concluded that straw recovery through baling system results in higher costs for unit of recovered material compared to those associated with systems in which biomass is collected and transported with the sugarcane. Conversely, Franco et al. [11] observed that baling systems are suitable for high straw recovery rates and greater transport distances, due to the reduction of bulk load density for integral harvesting systems. Seabra [12] points out that the substitution of cogeneration units that operate at 22 bar for higher pressure systems (65, 90 or even 120 bar) significantly raise the amount of electricity in power units. Gil et al. [13] share this point of view, especially in situations where a new concept of turbogeneration is adopted, replacing back-pressure turbines for the extraction turbines.
Kiatkitipong et al. [14] estimate that Rankine cycles capable of producing superheated steam at 525 °C and 105 bar from all available bagasse and 50% of the straw generated in the field could provide up to 158 kWh/tc of surplus electricity. Olivério and Ferreira [15] warned, however, that straw additions over this level may cause hazardous effects to the boiler, such as corrosion, given the presence of chlorides, and incrustation, due to accumulated silica.
In addition to operational aspects, environmental factors are also relevant for straw reuse [16]. Experts agree that the consumption of agricultural assets in energy generation aids in addressing major challenges faced by the energy sector: high Greenhouse Gas (GHG) emissions from the use of fossil fuels [17], and the finite nature of fossil resources [18].
Studies performed by Signor et al. [19] Carvalho et al. [20] and Menandro et al. [21] assessed effects on agricultural soil, stemming from different straw removal rates. Signor et al. [19] examined the relationship between type of soil, characteristics and degree of straw coverage (overlay), with consequent GHG emission rates. The authors concluded that, in this case, GHG releases are not affected by coverage rate. Signor et al. [19] warned, however, of productivity losses during sugarcane harvests due to erosion, which may stem from surface straw removal. Carvalho et al. [20] forward the main impacts associated with straw removal from the soil for bioenergy production. The researchers verified that the use of straw as a cover agent has important and positive soil effects, such as water storage, nutrient recycling and accumulation of carbon, in addition to controlling soil erosion and curbing plague infestation.
For its part, Menandro et al. [21] noted that Dinitrogen monoxide (N2O) emissions would be intensified when straw use is associated with N-fertilizers applications and vinasse. Following in the same line, Yin et al. [22] highlighted the importance of keeping straw in the field to meet, even partially, the sugarcane needs in terms of N-P-K, and to reduce air emissions and other environmental burdens associated with the manufacture, transport and application of inorganic fertilizers that provide these macronutrients.
Environmental impacts associated with the use of sugarcane biomass for bioelectricity generation have also been systematically analyzed, based on the Life Cycle Assessment (LCA) approach. By applying LCA from ‘cradle-to-grave’ to measure the environmental performance of electrical cogeneration from bagasse, Gil et al. [13] noted that particulate matter emissions derived from the combustion of bagasse are the most significant impact precursors in terms of Human Health and Photochemical Ozone Formation associated with cogeneration processes carried out in the Cuban sugar industry. Silva et al. [23] reached the same conclusions by exploring a similar system in which the bioelectricity is produced from the average conditions practiced in Brazil. The authors also add that, in the Brazilian case, the particulates from the biomass burning are even more intense than those provided by sugarcane, ashes, filter cake and vinasse transport, for systems that harvest sugarcane in mechanized form.
Following another path, Guerra et al. [24] assessed environmental effects for boiler exit steam pressures from 20 to 100 bar, for systems operated with cane biomass and taking into account different energy recovery alternatives (regenerative and reheating cycles). The authors also examined impacts provided by scaling up units driven by bagasse and straw to enhance power exports [25]. In both cases, the LCA-based diagnosis stated that the combined use of straw and bagasse reduces impacts related to Climate Change (CC) and particulate matter potential, but increases system inputs regarding water and fossil depletion, despite the thermal integration technology applied in cogeneration.
Strategies aiming the reuse of waste from the sugarcane industry for the production of bioelectricity were developed by Barrera et al. [26] and Longati et al. [27]. Barrera et al. [26] assessed scenarios for obtaining methane from the anaerobic digestion of vinasse for the production of electricity, once again in Cuban sugarcane refineries. LCA was applied to quantify the impacts associated with this process. The best environmental results were obtained using crude vinasse as raw-material, and with the electricity being produced in spark ignition engines. The study performed by Longati et al. [27] adopted LCA in order to verify impacts of biogas production from vinasse and its use in a different biorefinery. The findings obtained in this case showed that the use of biogas as a complementary fuel in the boiler slightly decreases the environmental impacts compared to processes in which only bagasse is used for this purpose.
Although these alternatives for vinasse reuse are promising, in the current Brazilian agricultural context this residue of ethanol processing should continue to be reused in sugarcane crops, due to: its high content of nutrients (especially potassium) which, in theory, save on expenditure associated with chemical fertilizers, and the low costs of implementing and operating fertigation practices [28]. Furthermore, the use of straw in electricity cogeneration has become an economically attractive possibility for Brazilian farmers, at least for short-term management.
In that sense, and even though the environmental impact derived from the use of straw in cogeneration has been explored under distinct perspectives, no records of analysis in which such effects are related to the use conditions of this biomass by the same systems in the literature are available. The present study aims to contribute, if only in part, to fill this gap by investigating the effect of process parameter variations on the environmental and energy performance of electricity cogeneration from bagasse and sugarcane straw burning in Brazil.
Attributional, ‘cradle-to-gate’ LCA was applied to a manufacturing facility, in which cogeneration is attached to an autonomous, anhydrous ethanol-producing distillery. The findings from this initiative are expected to help determine trends concerning system responses under different operational situations and contribute to future development in bioelectricity production, especially in the framework of its participation in the Brazilian energy matrix.
The method established to perform this study encompasses five steps:
Identification of the most influential parameters in the technical-environmental performance of the cogeneration plant and developing the analysis scenarios;
Characterization of an electricity cogeneration process powered by sugarcane biomass (bagasse and straw) attached to an autonomous anhydrous ethanol distillery, in terms of average technology, operational conditions, resource consumption and emissions;
Design of mathematical models able to represent each scenario, from the data and information collected in the previous step;
Application of the LCA methodology to establish an environmental and energy performance diagnosis for each scenario;
Carry out a critical analysis of the obtained results.
A survey of technical literature [4], [5], [11], [20], [24], [25] indicated straw addition rate (A), straw moisture (µ), and pressure of boiler-generated superheated steam (p) as the most influential parameters in the thermodynamic performance of cogeneration systems operating in sugar and alcohol distilleries. The variation range p was defined based on technical (as a domain of cogeneration technology at high pressures) and economic-strategic (future perspectives for the bioelectricity market) criteria, specific for the São Paulo sugar and alcohol sector. Reports by Guerra et al. [24] and Moore et al. [29] were used for this purpose.
The upper limit of A was set at 50%w/w of the straw generated in the field because of two factors: additions over this level might compromise the physical integrity of the boiler due to fouling and corrosion, and avoid damage to the soil. According to Kiatkitipong et al. [14], the fouling arises from the silicates existing in the straw, whereas corrosion may be caused from chlorides that are also part of its composition. Specialists in sugarcane cultivation suggest that at least half of the sugar straw should remain in the field to protect the arable land from actions such as erosion, wear and compaction, which can affect crop yield [30]. The lower end of the range (A = 10%) refers to the minimum amount of biomass capable of being transported without economic losses along the average displacement distance between the crop and the industrial plant in the state of São Paulo (32 km) [25].
The application of µ = 50% was an attempt to study the thermodynamic behavior of the Rankine cycle in situations in which straw moisture equaled the standard value of the bagasse parameter (µb = 50%). The other situations, at μ < 50%, were tested with the aim of verifying energy and environmental effects where straw was dried prior to use. In these cases, water evaporation from the biomass was assumed as occurring naturally without any auxiliary consumption energy source.
Table 1 exhibits the values (and ranges) for each parameter selected for the study. The analysis scenarios were established by the combination of the system operating conditions. The independent character of the variables led to 125 possibilities. However, a prior analysis of the energy-environmental performance of that collection regrouped the alternatives, giving rise to the twelve scenarios indicated in Table 2.
Process parameters for energy and environmental analyses
| p [bar] | A [%] | µ [%] |
|---|---|---|
| 20 | 10 | 15 |
| 45 | 20 | 25 |
| 67 | 30 | 35 |
| 80 | 40 | 40 |
| 100 | 50 | 50 |
Scenarios established for the present study
| Scenario | Process parameters | ||
|---|---|---|---|
| µi [%] | Ai [%] | pi [bar] | |
| S1 | 10 | 10 | 20 → 100 |
| S2 | 10 | 50 | 20 → 100 |
| S3 | 50 | 10 | 20 → 100 |
| S4 | 50 | 50 | 20 → 100 |
| S5 | 10 | 10 → 50 | 20 |
| S6 | 10 | 10 → 50 | 100 |
| S7 | 50 | 10 → 50 | 20 |
| S8 | 50 | 10 → 50 | 100 |
| S9 | 10 → 50 | 10 | 20 |
| S10 | 10 → 50 | 10 | 100 |
| S11 | 10 → 50 | 50 | 20 |
| S12 | 10 → 50 | 50 | 100 |
In this new conception, each scenario considers maximum and/or minimum values of two of the analyzed parameters, at the same time as the third variable was explored to the full extent of its variation levels. This approach allowed for the more precise identification of the effect of each parameter on the final result, since the others parameters are always considered in limit situations.
Regarding the thermodynamic behavior it was admitted, for any of the scenarios under analysis, that the cogeneration unit operates according to Rankine cycle with reheating, producing superheated steam, which expands in an extraction-condensing turbine. The system consumes all the bagasse obtained from sugarcane milling activities, in addition to straw, which is baled in the field and taken to the plant.
A Rankine cycle consists of main equipment (boiler, turbine, condenser, and electric generation) and auxiliary equipment (deaerator, pumps, desuperheater, pipes and steam trap). Modeling of this equipment was assisted by the Engineering Equation Solver (EES)® software, which takes into account the principles of mass and energy conservation and is based on the 1st and 2nd Laws of Thermodynamics and provides solutions for an extensive set of linear equations with a high degree of precision.
The mass and energy balances for a steady-state system are expressed by eq. (1) and eq. (2), respectively:
(1)
(2)
where variables and are the mass flow rates of the working fluid entering and leaving the system, and are the energy rates that also cross the boundaries from control volume, expresses the heat rate provided to the system, and refers to the work transferring rate.
The entropy balance concerning a steady-state system is indicated in eq. (3):
(3)
where is the entropy generation rate and Tj is the temperature of the control volume, Si and Se are the specific entropy rates of input and output flows circulating throughout the boundaries of the system.
Energy balances corresponding to the auxiliary equipment did not consider the energy losses originated in these units, since previous analyses on Rankine cycles with reheating and straw reuse indicate that these parameters remained below 1.2% [24].
Parameters used for modeling the scenarios
| Parameters | Value | ||
|---|---|---|---|
| Rankine cycle | Thermal efficiency in boiler [%] [24] Isentropic efficiency in turbine [%] [24] Efficiency in the electric generator [%] [24] Isentropic efficiency in pump [%] [24] Temperature in deaerator [°C] [24] |
ηb = f (scenario) ηt = f (scenario) 95 85 110 |
|
| Utilities | Steam consumption [kg/tc] [31] Steam pressure [bar] [31] Electricity in distillery [kWh/tc] [31] Electricity for straw milling [kWh/tc] [9] |
400 2.5 (saturated) 30 Esm = f (scenario) |
|
| Biomass | Bagasse | Production [kg/tc, dry basis] [32] Moisture [%w/w] [32] LHV [kJ/kg, wet basis] [32] |
140 50 7,565 |
| Straw | Production [kg/tc, dry basis] [9] Straw moisture [%w/w] [9] LHV [kJ/kg] [9] |
140 Sm = f (scenario) LHV = f (Sm) |
|
Consumption and emission estimates have been performed for anhydrous ethanol production (99.5%w/w) in autonomous distilleries with milling capacities of 2.5 Mt sugarcane per crop [33]. Table 3 depicts others technical indexes for that process, which were adopted for designing the models applied herein
Energy performance is depicted by the eq. (4):
(4)
where Eexp is the total of electricity exported, and RB is the intrinsic energy of the biomass (both bagasse and straw) consumed in the cogeneration. The specific amount of RB is calculated for each scenario from eq. (5):
(5)
where mb concerns the mass of bagasse delivered into the boiler, PCIb represents the LHV for this biomass for a moisture content µb = 50% (Table 2), ms,i is the amount of straw corresponding to the total sugarcane to be converted into anhydrous ethanol in the distillery, and PCIs,i is the LHV of straw, whose values were calculated for each scenario by eq. (6) [34]:
(6)
where PCSi is the high heat value of straw and makes up 4,060 cal g−1 in the circumstances to be verified in the study [5], [%] is the moisture of the straw for each scenario, and H [%] is the hydrogen content in the elemental composition of the straw to be burned. For the analyzed situation, [34] suggests assuming H = 6.4% PCIs,i, and ms,i values for the range of straw moisture variation applied in the study are given in Table 4.
Parameters associated with straw and used for RB estimation
| [%] | PCIs,i [MJ/kg] | ms,i [t] |
|---|---|---|
| 10 | 13.9 | 27.5 |
| 15 | 13.2 | 29.2 |
| 25 | 11.9 | 33.0 |
| 35 | 10.9 | 38.1 |
| 50 | 9.53 | 49.6 |
This study follows the guidelines and requirements described in ISO 14040 [35] and 14044 standards [36]. The product system encompasses the stages described in Figure 1. The agricultural model considers the application of chemical fertilizers – ammonia, urea, ammonium nitrate, Monoammonium Phosphate (MAP), Single Superphosphate (SSP) and potassium chloride, to supply macronutrient needs (N, P and K). The use of limestone to correct soil acidity and agrochemicals to control plagues and crop diseases is also carried out in this same system. Moreover, the dosage of industrial by-products (vinasse, filter cake, and ashes) complements sugarcane nutritional requirements. The use of machinery is also considered, with consequent diesel consumption, in soil preparation, sowing, treatment and harvesting. The sugarcane harvest is fully mechanized, eliminating any action of biomass burning in the field.
Scheme of anhydrous ethanol production linked to bioelectricity cogeneration (superheated steam production at 67 bar)
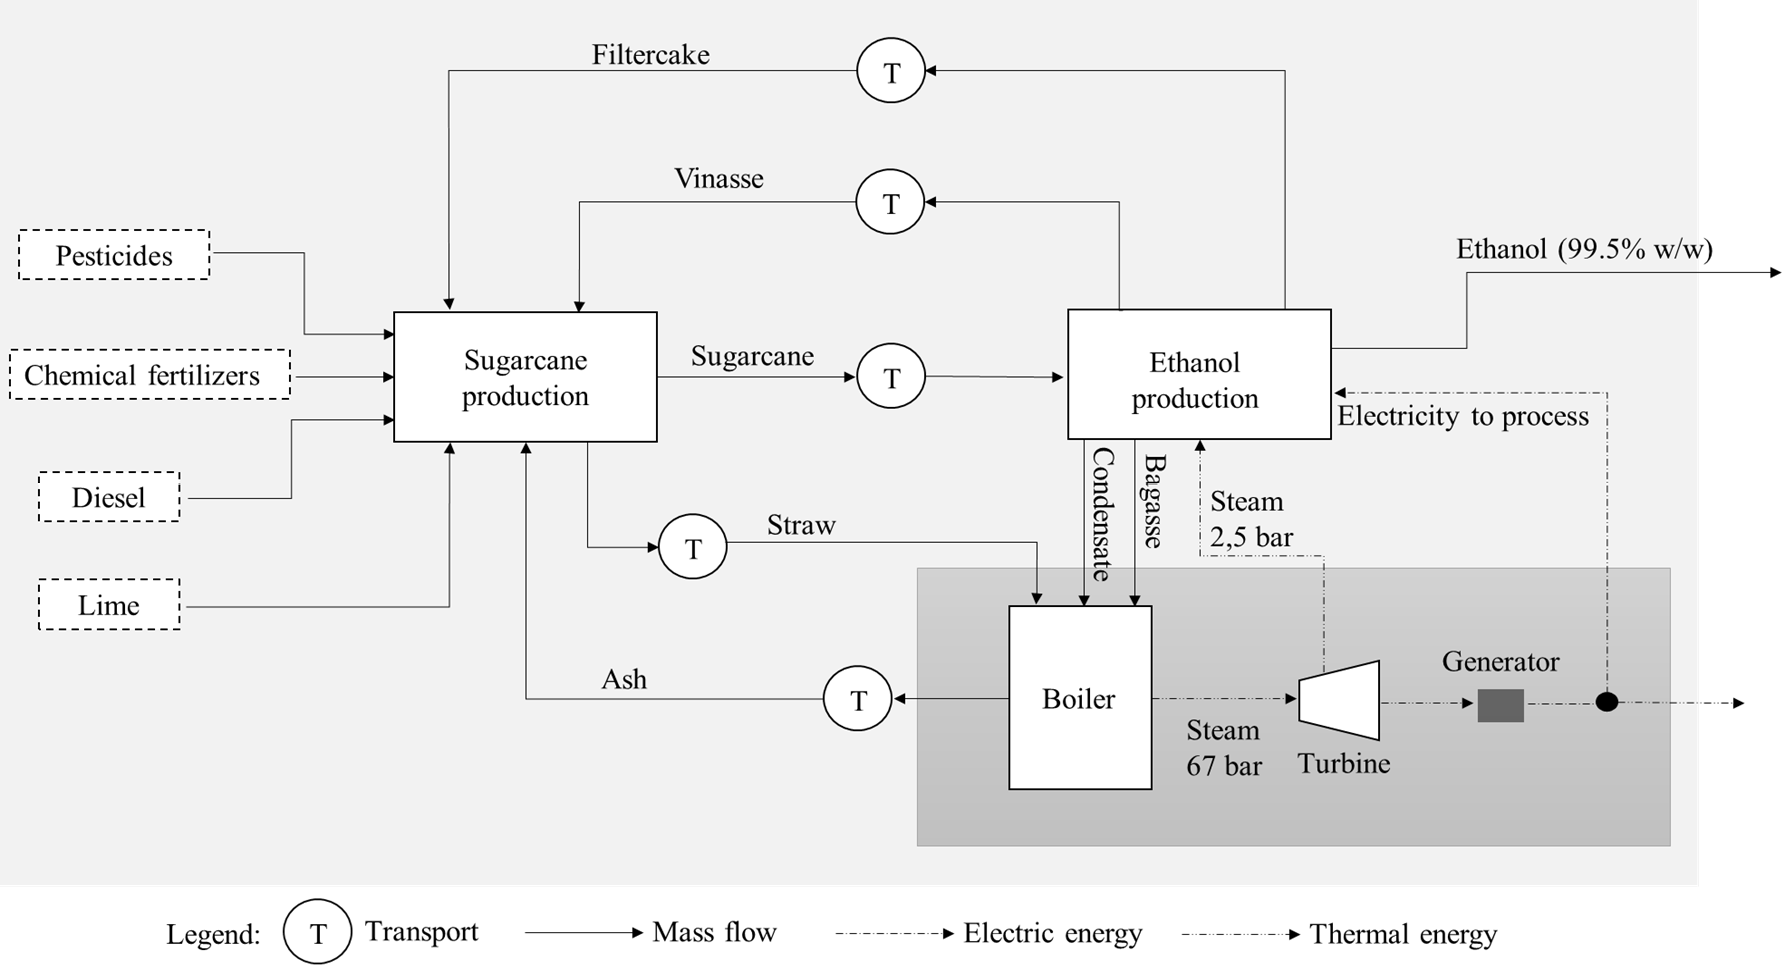
A productivity of 83.3 L C2H6O/tc is obtained by fermenting sugar juice at controlled temperature (26-32 °C) and acidity (4.5 < pH < 5.5). The ethanol generated by this process is distilled, rectified, and dehydrated to reach 99.5%v/v [33].
The environmental analysis was carried out by applying an attributional LCA with a ‘cradle-to-gate’ approach for a Reference Flow (RF) of 10 t anhydrous ethanol (99.5%v/v). The setting of this parameter renders sugarcane consumption and bagasse generation for cogeneration in the distillery invariable, thus eliminating any interference from this biomass source on the results.
Primary data are used to represent industrial processes, whereas agricultural activities were modeled from secondary data. Data collection considered the technological pattern practiced in the state of São Paulo between 2008 and 2016 [12], [15], [24], [25].
All the detected multifunctionality situations were treated by the allocation procedure. The first, which occurs in the agricultural stage between sugarcane and straw, was addressed by mass criterion. This methodological decision conditioned the energy and environmental load estimates for each one of these products to the figures set in the scenario for Ai and µi of straw (Table 1).
The second situation, also addressed by mass criterion, takes place in the distillery, for ethanol (4.9%), returning condensate (26%), vinasse (67%) and cake filter (1.9%). The last of the multifunctionality approaches concerns cogeneration among the exported electricity and the electricity consumed for ethanol synthesis, low-pressure steam and ashes. In this case, an allocation based on the energy criterion was performed. Hence, ashes do not accumulate environmental loads, whereas the allocation factors for the other coproducts were determined based on electricity rates exported and used by the process.
In contrast to what occurred with the energetic dimension, the environmental performances for the assorted operational conditions of the system were assessed directly, by the application of ReCiPe, midpoint (H), v 1.12 method [37]. Those analyses were restricted to the CC impact category. This decision was made because of energy planning reasons. In recent years, the profile of the Brazilian electrical matrix (grid BR) has been changing, with hydropower being replaced by thermoelectricity from non-renewable sources such as natural gas and coal [38]. In this context, the generation of ‘low carbon’ electricity ‒ as in principle must occur with biomass ‒ represents a strategic differential, especially in view of the commitments assumed by the Brazilian government during COP 21, to reduce GHG emissions by 43% by 2030, compared to 2005 [29]. Thus, holding low impacts of CC is a fundamental condition to consolidate the participation of bioelectricity in the grid BR. Under this perspective, the other environmental impacts associated with it, mainly due to the cultivation of sugar cane, become essential elements for the next level of the decision-making process where this issue will converge.
The LCA’s were assisted by SimaPro®, a software commonly used in analyzes of this nature. Secondary data that supported the modeling of agricultural stage were collected from the Ecoinvent Database®, v 3.2 [39]. However, even in this situation, the life cycle inventory ‘sugarcane, at farm/BR U’ was remodeled to reflect one of the most important conditions of the study, which, as mentioned in Section ‘Life cycle modelling’, consider exclusively mechanized harvesting of sugarcane.
Figures 2-4 describe the effects of p, A and µ variations on the energy performance of the system, expressed in terms of (Ie,i), for the analysis conditions. In the S1 → S4 scenarios where Ie,i = f(ln p) for the sake of scale, it has been generally noted that increases in superheated steam output pressure improve system energy performance, despite the moisture content and straw addition rates considered (Figure 2).
As might be assumed beforehand, scenarios considering minimum moisture rates (S1 and S2) projected Ie,i values higher than those in which the amount of water in the biomass was at maximum (S3 and S4). It is also not surprising that S2 accumulates the best energetic performances of the whole series, ranging from 0.111 < Ie,S2 < 0.193 as the pressure increases from 20 → 100 bar. This effect can be explained because the scenario simultaneously evaluates together μmin and Amax values. It should be noted, however, that as the operating pressure of the boiler rises the advantage of S2 over S1 tends to decrease, remaining at around 6.0% from 80 bar. This suggests that the gain by increasing the straw addition rate becomes secondary in cases where the Rankine cycle is subjected to extreme pressures.
Effect of pressure variation (Δp) on the energy performance of the system (Ie,i)
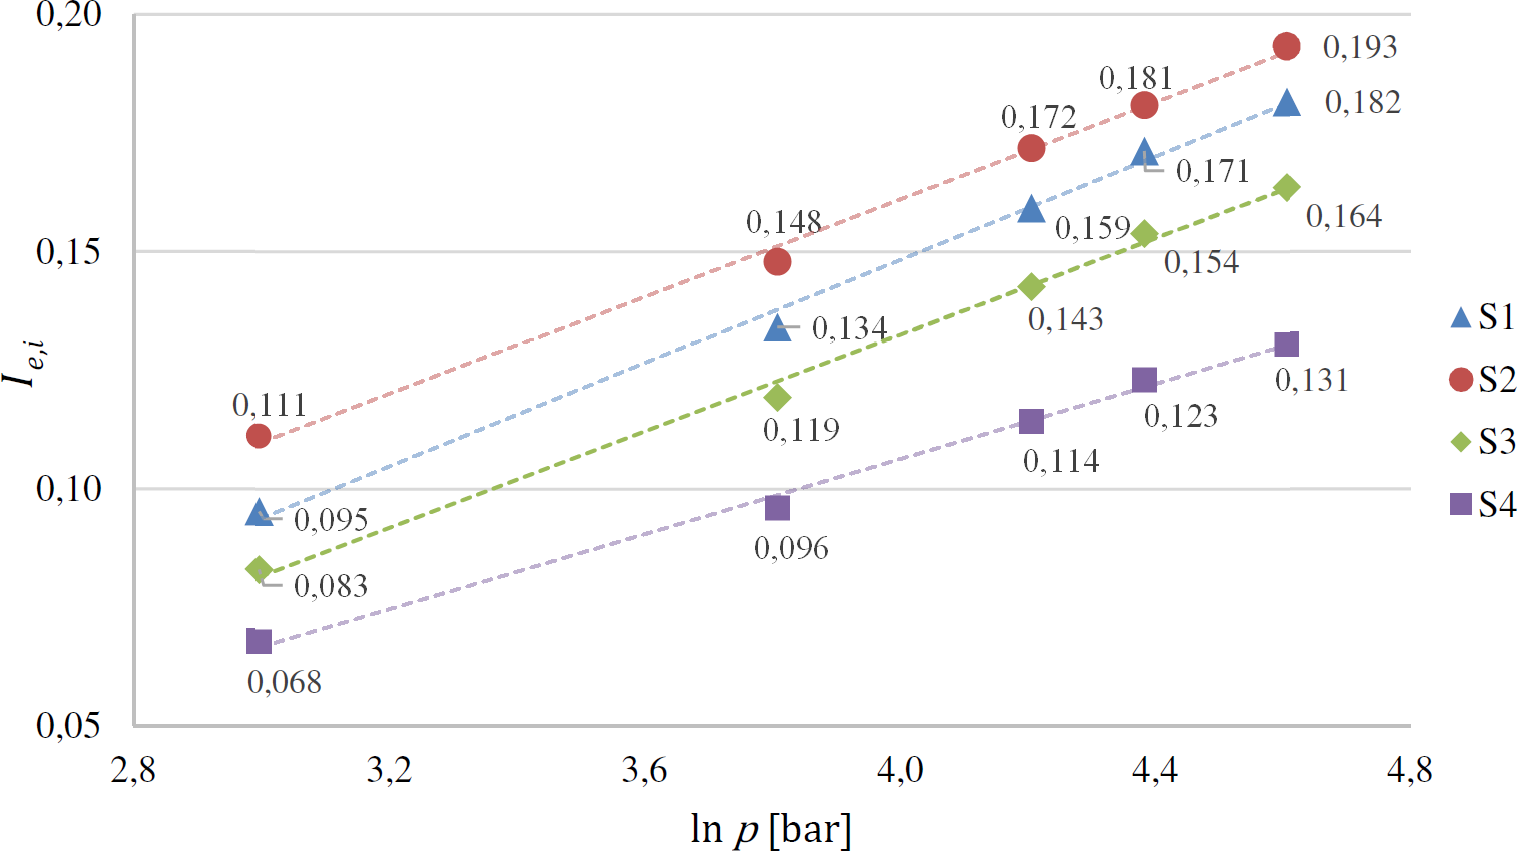
Another way of identifying this same effect is at the pressure level to be reached by a scenario in order to compare Ie to the next value. In situations where straw is at maximum moisture, Ie,S3 at 20 bar will be equated with S4 only when the boiler operates at about 30 bar.
If the same analysis were to be performed between S3 and S1, with the latter operating once again at 20 bar, the dichotomies imposed by μ and A in each situation would lead to superheated steam leaving the boiler in S3 at 26 bar. On the other hand, it has been noted that the Ie,S2 measured at 20 bar is equal to Ie,S1 if pS1 = 28 bar at the boiler outlet. This indicates that, at lower pressure levels, S1 distances itself from S2 enough to reverse the p-reduction trends established previously.
When carrying out a similar check for the upper p limits, however, another trend is observed. S3 should operate at 53 bar so that its energy performance equals that achieved by S4 at 100 bar (). Following the same trend, and . Therefore, at this extreme of the p-scale the better energy performance scenarios must be subjected to increasing pressures so that their Ie are similar to those of their immediate predecessors operating at 100 bar, as the difference between the pressures from consecutive scenarios is always shrinking.
Figure 3 associates Ie,i = g(Ai) obtaining, as in previous cases, linear relations for all evaluated scenarios. S5 and S6 exhibited gains in terms of energy performance with increasing straw addition, motivated by the fact that straw moisture contents in these cases were minimal. S7 and S8, on the other hand, displayed inverse trends, since biomass in those cases presented μmax. If Ie,S6 always exceeded its counterparts in any of the analysis situations, the effects of Ai on such a performance were discrete. This is justified by the fact that the trend line that guides the relationship between Ie,i and Ai presented the lowest angular coefficient [tg(φS6) = 0.0003] within all representations of this set.
A comparison between this value and its corresponding for S5 [tg(φS5) = 0.0004] corroborates the previous conclusion that straw addition does not significantly affect the energy performance of the system, to the extent that this effect becomes secondary at pressures higher than 80 bar.
Effect of straw addition variation (ΔA) on the energy performance of the system (Ie,i)
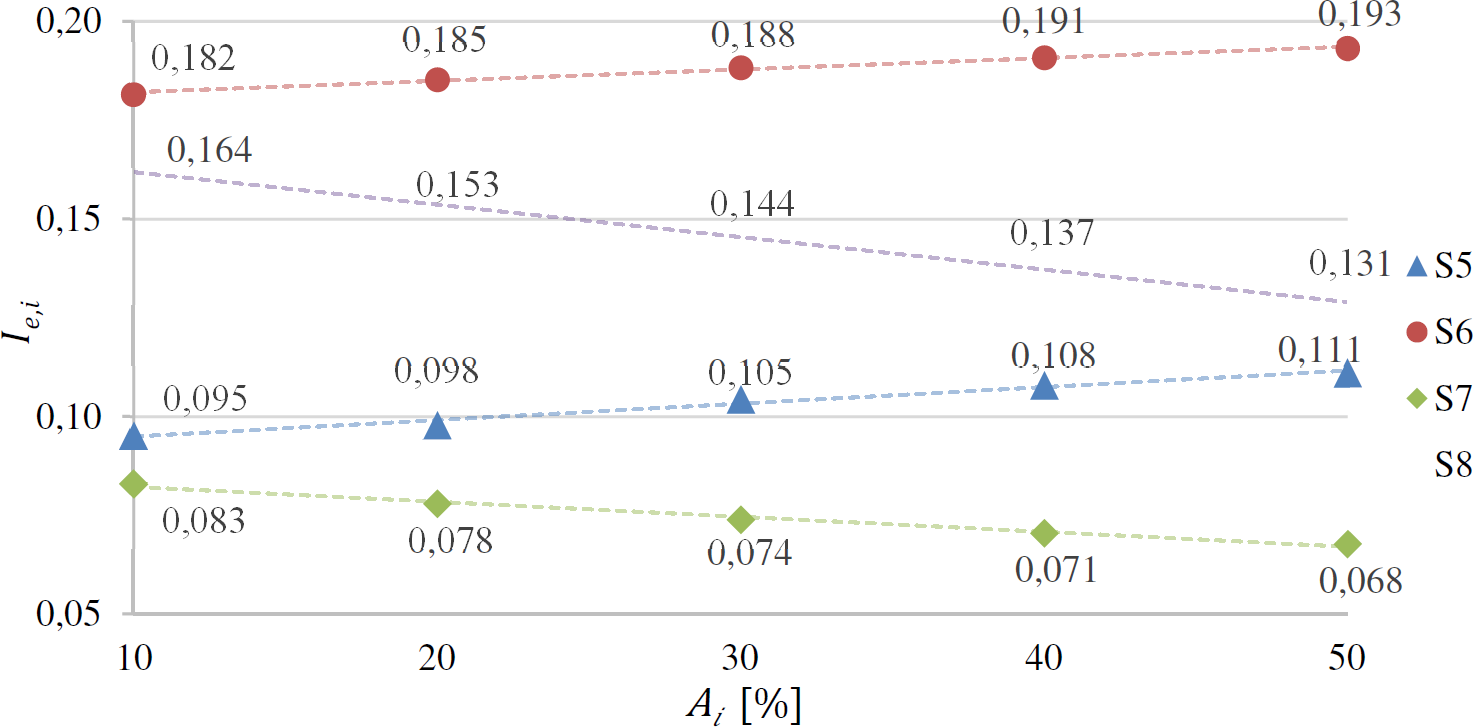
In scenarios were Ai had a negative effect on Ie, the alternative of using high vapor pressures resulted in gains, some significant, in energy performance with Ie,S8 > Ie,S7. In fact, as Ie,S8 was always higher than Ie,S5 for any Ai value, it can be concluded that pressure oscillations influence the energy efficiency of the system more than the moisture introduced by the straw. According to Figure 4, the relationship Ie,i = h(μi) also presents linear profiles for all evaluated scenarios. However, it is worth noting that the ordering of energy performance-based scenarios is conditioned by μi, to the point that two preference inversions are observed as moisture evolves from minimum to maximum values.
Effect of straw moisture variation (Δµ) on the energy performance of the system (Ie,i)
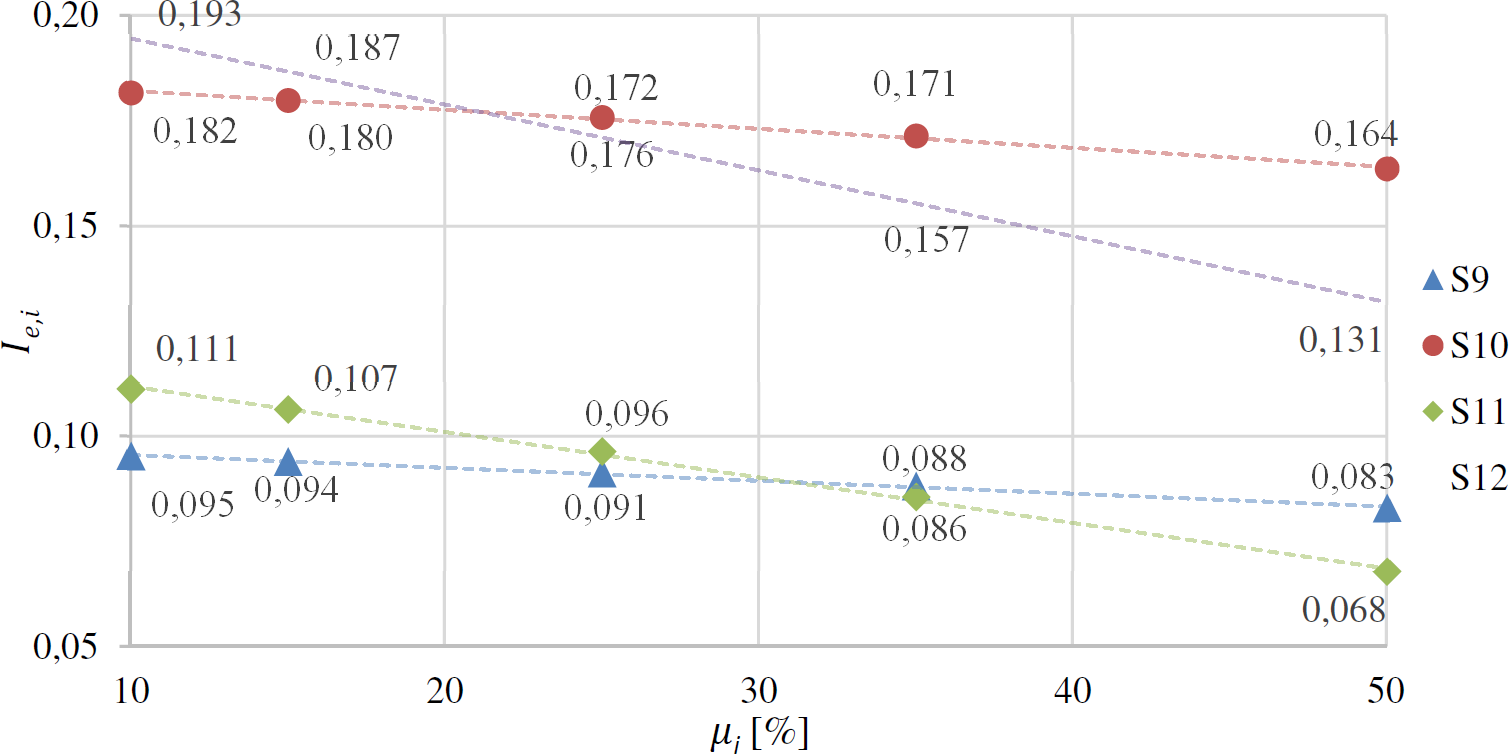
For μ = 10%, it became apparent that Ie,S12 > Ie,S10 > Ie,S11 > Ie,S9, a condition which only confirms earlier findings that, in such circumstances, Rankine cycle operating pressures are more influential to cogeneration energy performance than straw addition. The review of these sequencings for an arrangement where Ie,S10 > Ie,S12 > Ie,S9 > Ie,S11 is also expected when μ = 50%, as the high moisture content, albeit at this extreme of the scale, favors smaller straw dosages, and pressure remains a decisive parameter in energy performance composition.
By verifying the equations describing the trend lines for each scenario, it was possible to notice that a position inversion between S12 and S10 occurred at a level where μ = 21.4%, whereas the substitution of S11 by S9 was confirmed at μ = 30.1%. With regard to S12 and S10, the results indicate that, in systems where steam leaves the boiler at 100 bar, it is favorable in terms of energy performance to carry out straw additions of the order of 50% if this biomass comprises regulated moisture content lower than 21.4%. From this limit, reducing the rate of straw administration to 10% of the total volume generated in the field becomes a more conservative option. A similar reflection allows explaining the inversion between S11 and S9 for moisture content of 30.1% in the case where the cogeneration plant operates at 20 bar.
Figures 5-7 depict the environmental consequences of varying p, A and µ with regard to CC. An overview of the obtained results pointed out that the main contributions to this dimension come from losses of fossil carbon dioxide (CO2,f) from diesel combustion by agricultural machines during the soil preparation and treatment and sugarcane harvest, and in transport activities throughout the production chain. The set of precursors is completed by air Dinitrogen monoxide (N2O) emissions from land-use changes and Methane (CH4) releases also from incomplete diesel burning in agricultural machinery.
Emissions from the decomposition of straw left in the field, mainly as biogenic methane (CH4,b), did not represent a significant portion of the total impact for CC. On the other hand, releases of biogenic carbon dioxide (CO2,b) that are derived from biomass burning in the boiler were disregarded. This is because the impact accounting model applied by ReCiPe follows strictly the guidelines established by the Intergovernmental Panel on Climate Change [40] of disregarding, the portions relating to air CO2 fixation (CO2,fix) and the emissions of CO2,b.
The results from Figure 5 indicate that S2 repeated the performance achieved in the energy dimension by registering the most expressive results from the entire series also in environmental terms (688 kg CO2eq/MWh).
Regardless, S2 performance was always higher than its counterparts in all the analyzed pressures, as CC impacts are evaluated in specific terms (per MWh of exported electricity) and thus, the total electric energy generated when μS2 = 10% and AS2 = 50% is able to cushion all GHG emissions that occur in the system, even if it operates at 20 bar, when energy production reaches minimum values. In addition, as the boiler operating pressure (p) rises, differences between the impacts generated by the scenarios for the same pi value are reduced to the lowest values at 100 bar.
Effect of pressure variation (Δp) on the environmental performance of the system
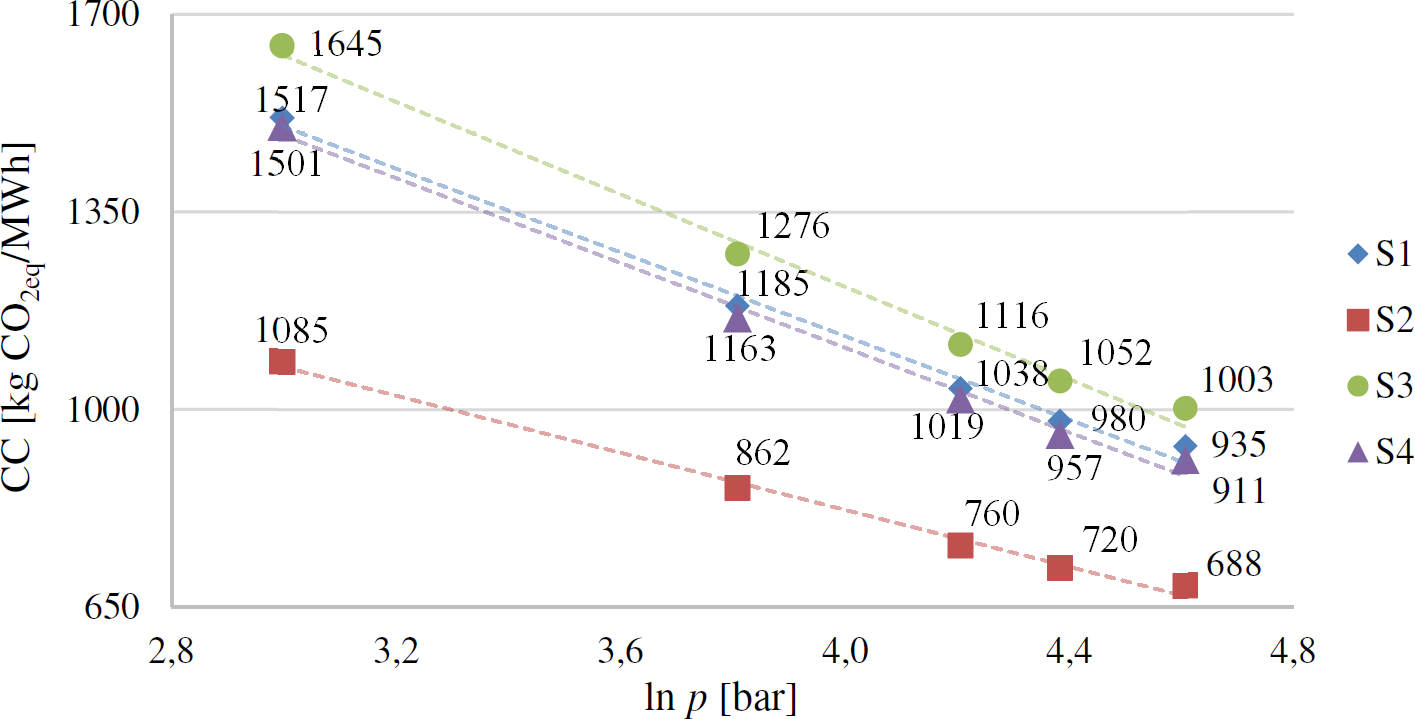
Such behavior confirms the expectation that the amount of energy contributed by the system at high pressures is even more significant than the GHG emissions that will be added due to increasing straw additions. Other evidence of this phenomenon lies in the pseudo-overlap between S1 (μS1 = 10%, AS1 = 10%) and S4 (μS4 = 50%, AS4 = 50%) performances for all evaluated pressures.
The worst performance achieved by the system was in S3. In this case, which accommodates low levels of electricity exports due to unfavorable relationships between straw moisture rates and biomass addition (μS3 = 50%, AS3 = 10%), the successive increases in the Rankine cycle operating pressure did not go beyond reducing their differences in the other scenarios.
Figure 6 depicts an important aspect of system environmental performance. Although S5 achieves sufficient results only in terms of energy performance, the CC profile of that scenario appears as the best of the series that verifies the consequences of adding straw to the environmental bias. This divergence can be explained by the sharp interference that μ and A variations exercise on GHG emissions. The successive use of straw in the boiler raises the emission rates of CO2,f, N2O and CH4 associated with this scenario, which originates from the agricultural stage. It should be noted that, in the logic practiced by the LCA, the straw left in the field is not characterized as a product of that specific processing and is therefore free of environmental loads.
Effect of straw addition variation (ΔA) on the environmental performance of the system
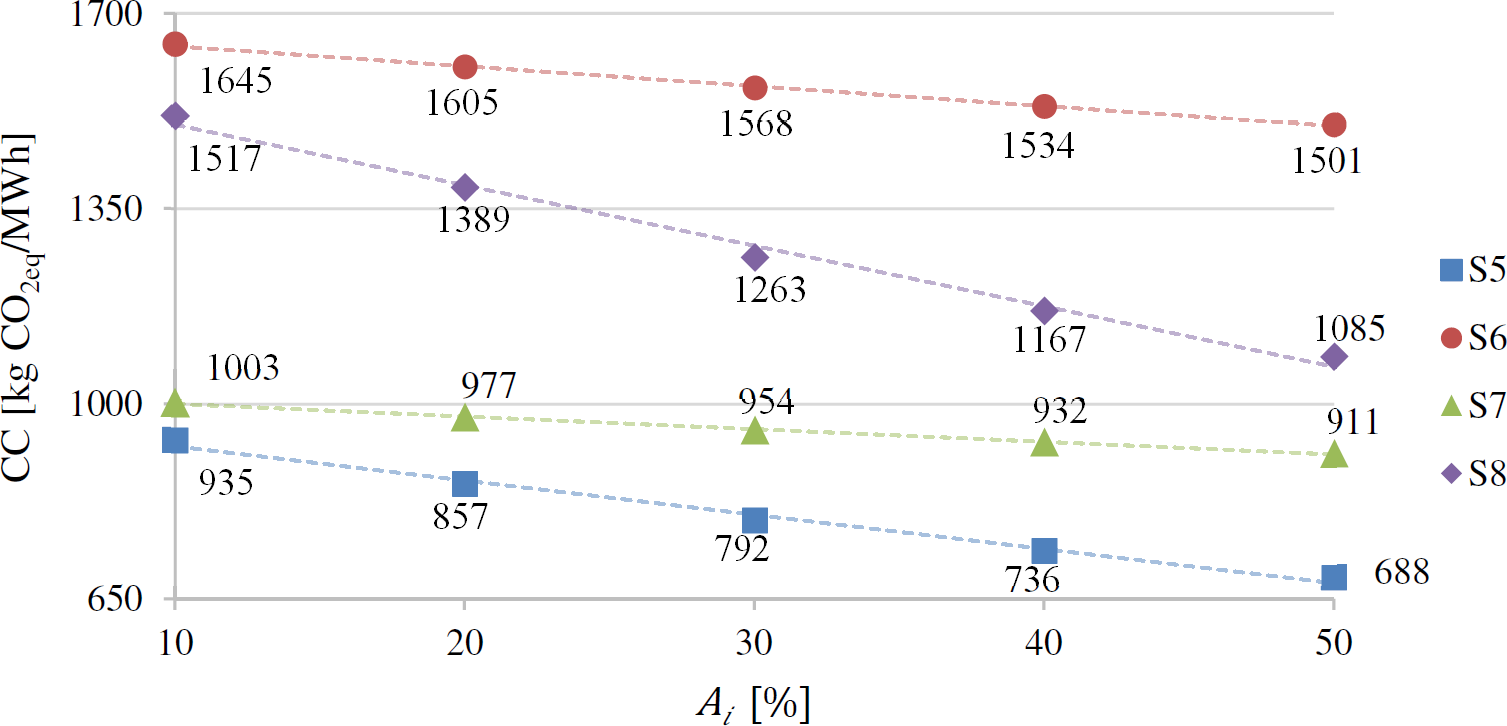
Following a similar line of approach, the presence of increasing amounts of water in the straw is reverted to excess transport load, thus intensifying the CO2 emissions resulting from this operation. In this context, although the total electricity generated in S5 is low (μS5 = 10%, pS5 = 20 bar), GHG emissions are moderate enough to be attributed the lowest specific impacts of the set. S7 also exhibits low energy performance, and ranks second among the options, for operating at 20 bar but with μS7 = 50%. S6 and S8 recorded the worst rates of absolute impact for CC. On the other hand, by generating more expressive amounts of exported electricity (pS8 = pS6 = 100 bar) these effects are attenuated. Successive straw additions into the boiler lead to the S5 and S7 distancing of environmental performances. The apex of this discrepancy occurs at A = 50%. When admitting μ = 10%, S5 shows a downward trend profile due to the increase in straw addition [tg(φS5) = −6.15]. As S7 considers μ = 50%, its evolution manifests itself in the form of a more restrained trajectory [tg(φS7) = −2.27]. The same phenomenon can be observed between S8 and S6, where [tg(φS8) = −10.9] and [tg(φS6) = −3.58].
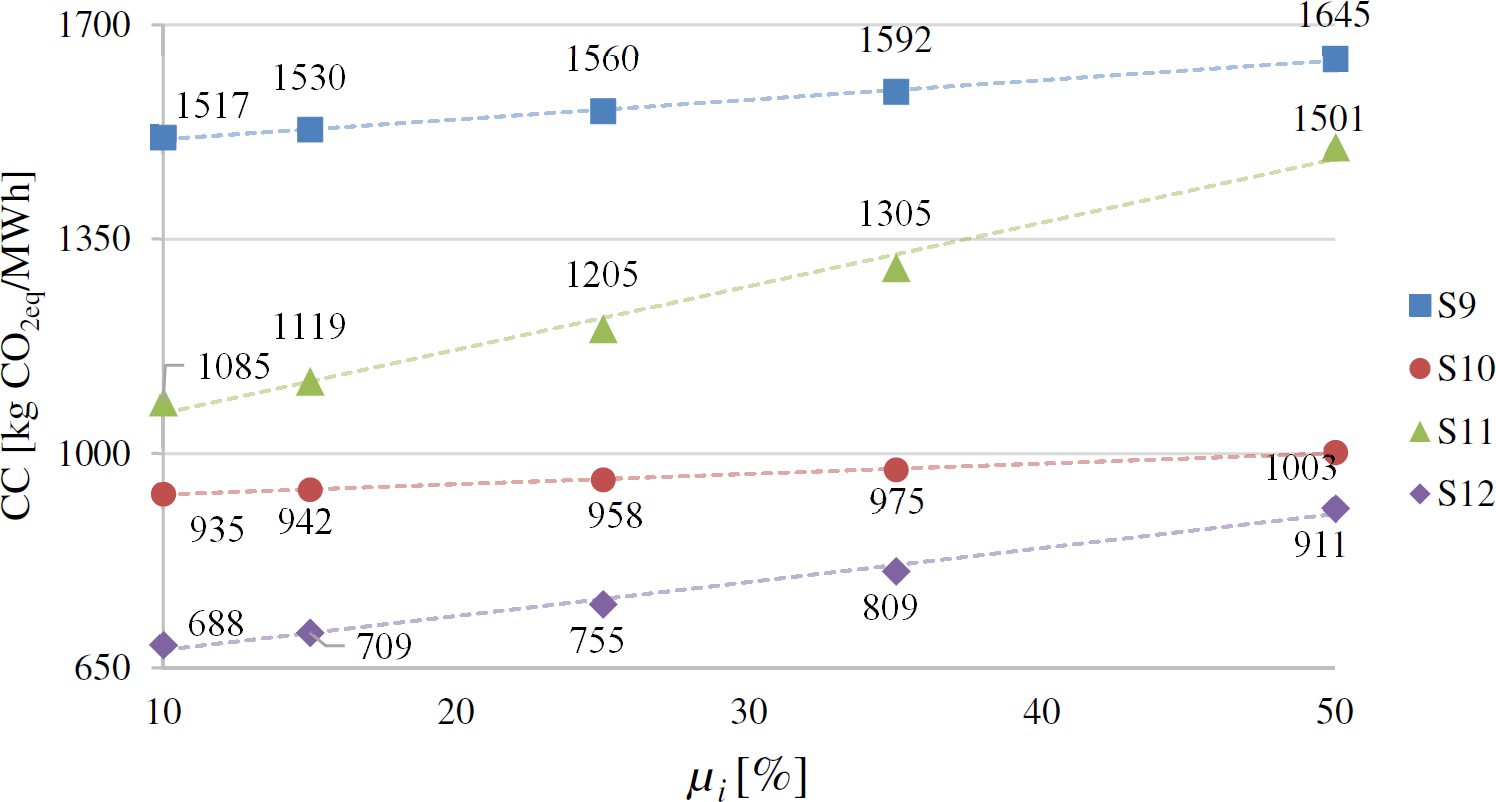
Finally, Figure 7 highlights the effects of moisture variation on the environmental profile of the electric cogeneration process from sugarcane biomass. By achieving the best specific CC performance indices, S12 corroborates previous findings. When operating with at AS12 = 10% and pS5 = 100 bar, this option achieves energy production levels high enough to absorb CC impact increases motivated by the same process conditions. The high operating pressures and high intake straw rates were shown to be more effective in terms of environmental performance than their procedural variants. In addition, unlike in the case of energy performance, no trend reversals associated with increased straw moisture were observed.
On the other hand, S12 and S11 are more sensitive to μ increments than their counterparts S10 and S9, from two circumstances: as straw addition rates increase, the amount of water introduced into the system with the biomass tends to reduce its potential for energy generation, as observed between S12 and S11, and if the Rankine cycle operates at low pressures, such as in S9 and S11, a situation in which production capacity is more restricted.
Effect of straw moisture variation (Δµ) on the environmental performance of the system
This study aimed to evaluate the effects of parameter oscillations in a cogeneration process operated with sugarcane biomass, on the energy and environmental performances of this arrangement. In order to do so, twelve analysis scenarios were designed taking into account different boiler operating pressure p, A and μ of this biomass. The energy dimension was evaluated through Ie, an index obtained for each analysis scenario from the ratio between the amount of electricity exported and the intrinsic energy of the biomass consumed in the cogeneration. Environmental performance was represented by specific impacts in terms of CC, measured by MWh of exported electricity. Scenario modeling was developed according to the conceptual framework proposed by the LCA technique with a ‘cradle-to-gate’ coverage.
The best result in terms of energy performance (Ie = 0.193) was recorded for p = 100 bar, A = 50% and μ = 10%, a conclusion that is not surprising apart from the index itself. On the other hand, for the adopted metrics, the cogeneration energy profile is mainly conditioned by boiler output vapor pressure, followed by straw moisture content, with the biomass addition rate only a complementary effect.
Regarding environmental performance, the main precursors are fossil carbon dioxide emissions from diesel combustion in agricultural machines during sugarcane cultivation and transportation throughout the production chain, dinitrogen monoxide released from land-use changes, and methane, also emitted from diesel burning in agricultural devices.
The most expressive results from the entire series (688 kg CO2eq/MWh) have also been obtained for the operation conditions mentioned above. However, unlike previous energy performance, moisture and straw dosage rates were important, in this case, as significant as the cogeneration plant operating pressure.
The LCA technique was decisive for obtaining the results that support this analysis. It is hoped that this development may bring other subsidies so that plant design and operation processes dedicated to the generation of bioelectricity are effectively guided by the environmental variable.
This research should proceed in different directions, but always within the context of assessing the effects of an increase in bioelectricity participation in the BR grid. In addition to technical analyses – aimed at identifying other potential alternatives that help reduce impacts associated with the national matrix, economic analyses should also be carried out to verify the costs from such processes. In the environmental sphere the natural step is to evaluate the magnitude of the other impacts that straw use can provide, thus providing subsidies that support short and medium-term energy planning actions for the country.
| Ai | straw addition rate |
| Ie,i | energy performance indicator |
| p | pressure of the superheated steam |
| tc | tons of sugarcane |
| µi | straw moisture |
| CC | Climate Change |
| CO2,b | Carbon Dioxide (biogenic origin) |
| CO2,f | Carbon Dioxide (fossil origin) |
| CO2,fix | Carbon Dioxide (fixation from the air) |
| CH4 | Methane |
| CH4,b | Methane, biogenic origin |
| LCA | Life Cycle Assessment |
| N2O | Dinitrogen Monoxide |
| RF | Reference Flow |
- ,
- ,
Energy from Sugarcane Bagasse in Brazil: An Assessment of the Productivity and Cost of Different Technological Routes ,Renewable and Sustainable Energy Reviews , Vol. 21 ,pp 356-364 , 2013, https://doi.org/https://doi.org/10.1016/j.rser.2012.11.080 - ,
Sustainability Assessment of Bio-ethanol Production in Brazil Considering Land use Change, GHG Emissions and Socio-economic Aspects ,Energy Policy , Vol. 39 (10),pp 5703-5716 , 2011, https://doi.org/https://doi.org/10.1016/j.enpol.2010.07.043 - ,
Combined Production of Sugar, Ethanol and Electricity: Thermoeconomic and Environmental Analysis and Optimization ,Energy , Vol. 36 (6),pp 3704-3715 , 2011, https://doi.org/https://doi.org/10.1016/j.energy.2010.08.011 - ,
Surplus Electricity Production in Sugarcane Mills using Residual Bagasse and Straw as Fuel ,Energy , Vol. 91 ,pp 751-757 , 2015, https://doi.org/https://doi.org/10.1016/j.energy.2015.08.101 - ,
Brazilian Sugarcane Bagasse: Energy and Non-energy Consumption ,Biomass and Bioenergy , Vol. 46 ,pp 564-573 , 2012, https://doi.org/https://doi.org/10.1016/j.biombioe.2012.06.038 - ,
The Renewable Energy Market in Brazil: Current Status and Potential ,Renewable and Sustainable Energy Reviews , Vol. 16 (6),pp 3786-3802 , 2012, https://doi.org/https://doi.org/10.1016/j.rser.2012.03.024 - , Dealing with the Gradual Elimination of the Burning of Sugarcane Straw and Gives Related Provisions (in Portuguese), 2002
- ,
A Vertical Integration Simplified Model for Straw Recovery as Feedstock in Sugarcane Biorefineries ,Biomass and Bioenergy , Vol. 81 ,pp 216-223 , 2015, https://doi.org/https://doi.org/10.1016/j.biombioe.2015.07.003 - ,
Technical and Economic Assessment of Trash Recovery in the Sugarcane Bioenergy Production System ,Scientia Agricola , Vol. 70 (5),pp 353-360 , 2013, https://doi.org/https://doi.org/10.1590/S0103-90162013000500010 - ,
Assessment of Sugarcane Trash for Agronomic and Energy Purposes in Brazil ,Scientia Agricola , Vol. 70 (5),pp 305-312 , 2013, https://doi.org/https://doi.org/10.1590/S0103-90162013000500004 - , , Ph.D. Thesis, 2008
- ,
Life Cycle Assessment of the Cogeneration Processes in the Cuban Sugar Industry ,Journal of Cleaner Production , Vol. 41 ,pp 222-231 , 2013, https://doi.org/https://doi.org/10.1016/j.jclepro.2012.08.006 - ,
Life Cycle Assessment of Bagasse Waste Management Options ,Waste Management , Vol. 29 (5),pp 1628-1633 , 2009, https://doi.org/https://doi.org/10.1016/j.wasman.2008.12.006 - ,
Cogeneration – A New Source of Income for Sugar and Ethanol Mills or Bioelectricity – A New Business ,Proceedings-International Society of Sugarcane Technologists , Vol. 27 ,pp 1-13 , 2010 - ,
Sustainability Considerations for Electricity Generation from Biomass ,Renewable and Sustainable Energy Reviews , Vol. 14 (5),pp 1419-1427 , 2010, https://doi.org/https://doi.org/10.1016/j.rser.2010.01.010 - ,
The Role of Bioenergy in Ireland’s Low Carbon Future – is it Sustainable? ,Journal of Sustainable Development of Energy, Water and Environment Systems , Vol. 3 (2),pp 196-216 , 2015, https://doi.org/https://doi.org/10.13044/j.sdewes.2015.03.0016 - ,
The Concept of Autonomous Power Supply System Fed with Renewable Energy Sources ,Journal of Sustainable Development of Energy, Water and Environment Systems , Vol. 5 (4),pp 579-589 , 2017, https://doi.org/https://doi.org/10.13044/j.sdewes.d5.0160 - ,
Emissões de gases de efeitos estufa pela disposição de palha de cana-de-açúcar sobre o solo ,Bragantia , Vol. 73 (2),pp 113-122 , 2014, https://doi.org/https://doi.org/10.1590/brag.2014.019 - ,
Agronomic and Environmental Implications of Sugarcane Straw Removal: A Major Review ,Global Change Biology Bioenergy , Vol. 9 (7),pp 1181-1195 , 2016, https://doi.org/https://doi.org/10.1111/gcbb.12410 - ,
Comprehensive Assessment of Sugarcane Straw: Implications for Biomass and Bioenergy Production ,Biofuels, Bioproducts and Biorefining , Vol. 11 (3),pp 488-504 , 2017, https://doi.org/https://doi.org/10.1002/bbb.1760 - ,
Balancing Straw Returning and Chemical Fertilizers in China: Role of Straw Nutrient Resources ,Renewable and Sustainable Energy Reviews , Vol. 81 (2),pp 2695-2702 , 2018, https://doi.org/https://doi.org/10.1016/j.rser.2017.06.076 - ,
Life Cycle Assessment of the Sugarcane Bagasse Electricity Generation in Brazil ,Renewable and Sustainable Energy Reviews , Vol. 32 ,pp 532-547 , 2014, https://doi.org/https://doi.org/10.1016/j.rser.2013.12.056 - ,
Comparative Analysis of Electricity Cogeneration Scenarios in Sugarcane Production by LCA ,International Journalof Life Cycle Assessment , Vol. 19 (4),pp 814-825 , 2014, https://doi.org/https://doi.org/10.1007/s11367-014-0702-9 - ,
Thermodynamic and Environmental Analysis of Scaling up Cogeneration Units Driven by Sugarcane Biomass to Enhance Power Exports ,Energies , Vol. 11 (1),pp 1-23 , 2018, https://doi.org/https://doi.org/10.3390/en11010073 - ,
A Comparative Assessment of Anaerobic Digestion Power Plants as Alternative to Lagoons for Vinasse Treatment: Life Cycle Assessment and Exergy Analysis ,Journal of Cleaner Production , Vol. 113 ,pp 459-471 , 2016, https://doi.org/https://doi.org/10.1016/j.jclepro.2015.11.095 - ,
Life Cycle Assessment of Vinasse Biogas Production in Sugarcane Biorefineries ,Proceedings of the 27th European Symposium on Computer Aided Process Engineering , Vol. 40 ,pp 2017-2022 , 2017, https://doi.org/https://doi.org/10.1016/B978-0-444-63965-3.50338-X, Barcelona, Spain - ,
Environmental and Energy Assessment of the Substitution of Chemical Fertilizers for Industrial Wastes of Ethanol Production in Sugarcane Cultivation in Brazil ,The International Journal of Life Cycle Assessment , Vol. 22 (4),pp 628-643 , 2017, https://doi.org/https://doi.org/10.1007/s11367-016-1074-0 - ,
The Brazilian Electricity Supply for 2030: A Projection Based on Economic, Environmental and Technical Criteria ,Environment and Natural Resources Research , Vol. 7 (4),pp 17-29 , 2017, https://doi.org/https://doi.org/10.5539/enrr.v7n4p17 - , , Proceedings of the 25th European Biomass Conference and Exhibition, 2017
- ,
Analysis of Energy Consumption in Three Systems for Collecting Sugarcane Straw for use in Power Generation ,Energy , Vol. 119 ,pp 178-187 , 2017, https://doi.org/https://doi.org/10.1016/j.energy.2016.12.067 - ,
Simulation of Ethanol Production from Sugarcane in Brazil: Economic Study of an Autonomous Distillery ,Computer Aided Process Engineering , Vol. 28 ,pp 733-738 , 2010, https://doi.org/https://doi.org/10.1016/S1570-7946(10)28123-3 - ,
Environmental and Economic Assessment of Sugarcane First Generation Biorefineries in Brazil ,Clean Technologies and Environmental Policy , Vol. 14 (3),pp 399-410 , 2012, https://doi.org/https://doi.org/10.1007/s10098-011-0424-7 - , , 2011
- , Environmental Management – Life Cycle Assessment – Principles and Framework, 2006
- , Environmental Management – Life Cycle Assessment – Requirements and Guidelines, 2006
- , Description of the ReCiPe Methodology for Life Assessment Impact Assessment, ReCiPe Report, 2012
- , Statistical Yearbook of Electricity – 2016 Baseline Year, 2017
- , , 2007
- , , 2007