


Blessed with abundant natural resources, Sub-Saharan Africa is a region with huge potential for development. According to World Bank data, the region has 46 countries with an area of 24.2 million square kilometres and about 1.1 billion people with multicultural differences. Despite its vast potential, the region faces tremendous challenges like low development and income distribution disparities, Coupled with the fact that most of its population needs more access to financial services. As a result of financial exclusion, the region’s development is restricted, and more people are living below the poverty line; aside from financial exclusion challenges, the region’s poor infrastructure, high level of debt, and political instability compound the already difficult situation and impede development.
Although the region is categorised as the lowest polluting region in terms of CO2 emission after South and Central America [1], climate change is a concern here because of the adverse effects, including low rainfall, which reduces food production since most farmers rely on rainfall for irrigation. World Bank 2020 figures indicated that Sub-Saharan Africa emitted about 850,000 kt of CO2 in 2020, accounting for 3% of the world’s related emissions. Despite low figures, the World Bank highlighted that the region registered an 87.5% rise in CO2 emissions between 1990 and 2017. The projection of the region in terms of CO2 emission (as estimated by ISS African Futures,
Recent literature emphasises the importance of pro-environmental actions and the adoption of renewable energy for sustainable economic development and a healthier planet. Various proxies and approaches are used in the literature to study the influence of financial development on environmental sustainability. One research fragment identifies the significance of a well-developed financial system in environmental sustainability by allowing and enabling businesses to adopt efficient, eco-friendly technologies and clean energy investments that reduce carbon emissions [3]. This finding emphasises that nations with effective financial systems are more likely to have good environmental quality through carbon sequestration and improved industrial structure. In their study on China, Tong et al. [4] demonstrated that a developed financial system also provides the necessary mechanisms for transitioning to cleaner energy. Baulch et al. [5] corroborated these findings by emphasising the importance of access to capital for adopting renewable energy technologies like solar home systems in Vietnam. Kirikkaleli et al. [6] found that financial development lowers carbon emissions, but economic expansion increases carbon emissions in Chile. He et al. [7] in Mexico corroborate these findings. Tax deduction incentives are achievable due to a well-developed financial framework for enterprises that actively engage in environmentally friendly procedures and contribute to environmental improvement [8].
Several empirical studies have demonstrated a positive relationship between environmental quality and financial development. Notably, research by Cao et al. [9] and Guo and Hu [10] highlights that in China, an increase in financial development helps to suppress carbon emissions. Similarly, Shahbaz’s study in Pakistan supports this finding [11].
Notwithstanding, the effect of financial inclusion and environmental quality remains inconclusive. Studies have also supported the negative association. Baloch and Danish, in their research, found that financial development increases carbon emissions in BRICS countries after employing the Common Correlated Effects Means Group (CCEMG) technique [12]. A study on OBOR (also known as New Silk Road) economies by Liu et al. [13] using the 2SLS and GMM reached similar findings even after observing both perspectives of financial inclusion. Given the inconclusive findings on this problem, the study poses the following research question: Does financial inclusion and consumption impact environmental quality positively and negatively? Even though several academics have researched the issue, some contradictory conclusions have emerged, emphasising the need for more researchers to support better policy formation for sustainable development.
When financial products and services are easily accessible to individuals and businesses, they can secure loans, invest in new ventures, and purchase various goods and services. This economic activity increases demand and overall consumption [14]. Higher consumption leads to increased production of goods and services, which frequently rely on fossil fuel energy, resulting in higher carbon emissions [13] as corroborated by [15]. The direct correlation between financial inclusion and carbon emissions can be complicated. When there is financial inclusion in society, it may result in higher levels of consumption, which could lead to increased emissions; however, it can also promote investments in cleaner technology and energy-efficient methods that help decrease emissions overall. This phenomenon is described by John Maynard Keynes’ theory of consumption, which asserts that income is the primary driver of expenditure. Access to financial services enables them to borrow against future earnings, increasing current spending and leading to more production and potentially more carbon emissions. The environmental Kuznets curve (EKC) concept is another theory that describes the scenario, suggesting that as the economy grows, environmental degradation increases until a certain threshold is reached, and it starts to decline again. Promoting inclusion could drive economic growth and consumption, producing higher carbon emissions. However, as income levels rise, there might be investment in cleaner technologies and sustainable methods, eventually reducing emissions over time.
The current research provides insights into the ongoing body of knowledge in several ways. As far as the authors are aware, it is the first attempt to ascertain financial inclusion’s impact on carbon emissions across 44 Sub-Saharan African nations from 2004 to 2022. This paper investigates the mechanism of household consumption, illustrating the pathway of financial inclusion’s influence on carbon emissions. Moreover, the research utilises econometric techniques that involve conducting heterogeneity analysis, considering different levels of financial inclusion and the four regions of Sub-Saharan Africa to obtain accurate, consistent and robust estimates.
In addition to the introduction (section 1), the rest of the study is structured as follows: literature review and theoretical analysis (section 2), econometric methodology and data (section 3), empirical results (section 4), analysis of mechanisms (section 5), conclusion and policy implications (section 6).
The existing literature review presents the relationship between financial inclusion, carbon emissions, and sustainable economic development and the possibility of financial inclusion’s positive and negative impacts on carbon emissions. The review explores measurement, financial development, and CO2 nexus, as well as the study’s theoretical analysis and conceptual framework.
Financial inclusion is a multifaceted concept that covers various aspects, such as the extent of inclusion, service providers, target audiences, pricing, and types of financial services offered [16]. The literature on financial inclusion is shaped by different interpretations of the term, which mirror the viewpoints and goals of policymakers, regulators, financial institutions, researchers and customers [17]. It highlights the importance of covering a range of financial services that are accessible and used by both people and businesses [18]. The United Nations Capital Development Fund (UNCDF) expands upon this idea by explaining that financial inclusion is accomplished when all individuals capable of carrying out financial activities can access a broad selection of top-notch, affordable, and easy-to-manage financial products and services [19]. In the same way, Pesqué-Cela et al. [20] describe financial inclusion as offering affordable financial products and services that are easily accessible to everyone regardless of their wealth levels and organisation size.
Properly assessing financial inclusion means considering its various aspects [21]. Relying solely on the percentage of adults using banking services as a measure of financial inclusion overlooks elements such as the availability and usage of financial services beyond mere access to the financial system itself. Accessibility is critical to understanding financial inclusion; however, it also covers the access and use of services within a comprehensive financial system. Beck and De La Torre [22] claim that various other methods to assess the reach of the banking sector have been put in place, such as geographic branch penetration, per capita loan and deposit accounts, loan-income and deposit-income ratios, and comparable indicators with similar measures. These indicators offer valuable and meaningful perspectives into the inclusiveness of a financial system, encompassing a variety of financial inclusion components. However, when used alone, they might not provide an adequate grasp of how inclusive the financial system is. The scenario shows that one could misunderstand the extent of inclusion in a society if attention is solely on individual indicators instead of combined.
The financial access survey (FAS) offered by the International Monetary Fund (IMF) is widely used in research studies focusing on financial inclusion. It covers two main aspects − the usage of financial services and products and their geographical reachability. According to a report by the IMF Secretariat in 2014, the FAS is a crucial source of information, providing global data about the availability of financial services worldwide. It includes standardised measures for assessing the accessibility and usage of financial services. Since 2014, the FAS has included metrics related to mobile money. Annual data commencing in 2004 are included in this database, comprising 47 fundamental indicators and 152 time series. There are two main categories: i) The geographic scope comprises the number of commercial banks and the density of ATMs and bank branches per 1000 square metres; ii) Financial services utilisation is defined as the ratio of outstanding loans from commercial banks to the Gross Domestic Product (GDP) and outstanding deposits with commercial banks to the GDP.
The research on the link between financial inclusion (FI) and environmental quality is still in its early stages. With rising CO2 emissions, many researchers have begun focusing on this topic and investigating its impact.
FI may impact CO2 emissions through three channels: consumption, economic, and technological. In the case of the consumption channel, a well-developed financial system facilitates access to consumer credits, which increases energy demand by allowing individuals to purchase and use more energy-intensive home appliances and automobiles [23], which can result in CO2 emissions from increased energy consumption. Similarly, FI facilitates access to low-cost funds, allowing businesses to purchase more machinery and equipment, construct new factories, and increase CO2 emissions through increased energy use [24].
Technology is widely researched to reduce CO2 emissions. Financial progress improves the environment by enabling investments in renewable energy sources and supporting eco-friendly projects that drive innovation and technology advancements to lower energy consumption and carbon emissions. The study by Li et al. [25] highlights the significance of employing green energy solutions in reducing carbon footprints after examining the effects of energy structure and the digital economy on CO2 emissions in China, demonstrating how financial development plays a role in moderating CO2 emissions effectively.
In their study, Grossman & Krueger [26] highlight the relationship between economic progress and environmental quality, known as the environmental Kuznets curve (EKC) concept. They suggest that although initial economic advancements may impact the environment, subsequent growth could lead to enhancements in environmental standards. In the publication by Wang et al. [27], the authors delve into the topic of the EKC, underscoring the importance of verifying its validity when formulating policies that strike a balance between preserving the environment and fostering economic development. Their research shows that the environmental impact increases as the economy grows, especially when natural resources are heavily exploited.
Since the global financial crisis, policymakers, scholars, and decision-makers have focused on how financial progress influences economic growth. Some scholars argue that financial progress is essential for development and technological innovations, but it can also substantially impact the environment’s quality, especially concerning carbon emissions [28]. However, scholars’ opinions remain divided as the data do not provide answers, making the study on the association inconclusive.
Recent academic studies have highlighted the relationship between financial inclusion and economic growth and their environmental effects. The research suggests that expanding services and manufacturing operations could lead to higher carbon dioxide (CO2) emissions, exacerbating climate change issues [4]. Based on their worldwide analysis, economic development and structure play a role in influencing carbon emissions positively or negatively. Le et al. [29] research on the impact of financial inclusion, renewable energy, and globalisation on South Asian CO2 emissions suggests that incorporating green energy sources is a crucial strategy for reducing South Asian CO2 emissions; their result shows that financial inclusion caused an increase in CO2. This finding is valid even amid ongoing economic expansion and rising energy usage, leading to higher carbon emissions.
Conversely, some scholars suggest an inverse correlation between financial inclusion and CO2 emissions. According to Yang et al. [30], financial inclusion plays a role in fighting climate change by boosting carbon sequestration capacity and enhancing industrial structure through excellent economic support.
A study by Ben Jebli & Hakimi [31] found that when financial inclusion is paired with renewable energy consumption in developed countries, it reduces carbon emissions over the long term in technologically advanced countries. Furthermore, research by Damrah et al. [32] demonstrated that implementing financial inclusion measures in oil-exporter nations has decreased CO2 emissions. Baulch et al. [5] found that financial constraints such as capital access and lack of government support are obstacles to adopting solar home systems in Ho Chi Minh City, Vietnam.
The literature synthesis highlights the intricate and varied correlation between financial inclusion and CO2 emissions, economic growth, human capital, consumption patterns, and technological advancements, including many factors. The relationship between financial inclusion and CO2 emissions is vital because of its potential to exacerbate or mitigate environmental degradation. Financial inclusion is an essential but overlooked factor in environmental studies because of the challenges that are associated with the complexity of its direct and indirect effects, data limitations, and the lack of a unified framework to capture its multifaceted influence across diverse regions, emphasising the importance of implementing a well-rounded approach to attaining a balanced harmony for sustainable progress; this strategy should consider the implications for both the economy and the environment.
To this end, it is imperative to address the existing barriers so that appropriate policies for sustainable development can be formulated, especially in Sub-Saharan Africa. This situation justifies the need for more research to comprehensively address all aspects and methodologies, ensuring meaningful policy implications.
The relationship between financial inclusion and environmental quality is relatively limited and recent. The environment Kuznets curve (EKC) theory, the Investment-Saving and Liquidity Preference – Money Supply (IS-LM), and the Energy Ladder Hypothesis (ELH) explain this relationship.
The EKC framework explains the relationship between environmental degradation and economic development. Lower income levels are more susceptible to environmental issues when the economy grows because they focus more on meeting their basic needs than addressing environmental concerns. However, a debate suggests that environmental degradation decreases as the economy grows and income levels increase. According to Grossman and Krueger (1991), it is commonly observed that individuals with higher incomes tend to embrace eco-friendly technology and prioritise environmental conservation. The EKC theory is influenced by how financial inclusion affects income distribution levels [26]. This is observed in the accessibility and affordability of green finance and innovation [33]. Various studies support the EKC theory by suggesting that as developing economies strive for growth, they may relax trade and environmental regulations. This can lead to an expansion in economic size and alter its structure, influencing manufacturing practices [34]. Additionally, financial advancement can impact the EKC by stimulating and fostering growth through higher production and energy consumption levels. Financial development can fund energy-intensive consumption products, increasing environmental emissions. In contrast, it may also encourage a green environment by offering green loans and financial support for energy-efficient projects [27].
The Investment-Saving and Liquidity Preference-Money Supply (IS-LM) theory was developed by Hicks in 1937 as a visual representation of John Maynard Keynes’s significant work “The General Theory of Employment” from 1936 [35]. This model offers insights into how an economy’s money and goods markets operate and is also referred to as the Hicks- Hansen model and Money theory. The theory has three critical components: liquidity, investment, and consumption; it posits that liquidity is determined by the money supply (M) and velocity of money supply (VT). At the same time, the level of investment and consumption reflects individual actors [36]. The IS curve illustrates the causal relationship between interest rates, planned investment, national income, and output. In contrast, the LM curve represents the equilibrium level of the money exchange for various combinations of interest rates and real income.
The IS-LM theory of interaction with the environment is effective because a well-developed financial system aims to increase the money supply, lower interest rates, and promote investment and consumption by providing access to funds through credits [36]. The advancement of finance often leads to improved access to credit for individuals [37] and drives up the demand for energy-intensive goods and services such as cars, household items, and real estate [38]. As a result of this trend, in consumption patterns driven by financial inclusion, CO2 emissions tend to rise. Businesses and industries benefit from it by enhancing their productivity and growth through marketing strategies and adopting new production lines [39]. It often involves acquiring energy-intensive machinery [40].
The critical advantage of financial inclusion advancement is that it encourages essential investment activities for a thriving stock market. Companies listed on the market can access funds, increase investment, engage in economic activities, and increase production and consumption. These factors positively and negatively affect environmental quality [41].
Another relevant theory in context is the theoretical theory known as the Energy Ladder Hypothesis (ELH), which proposes a hierarchical advancement of energy sources that communities and individuals have employed throughout history. The theory suggests a relationship between income levels and energy usage patterns among people in society. As their earnings rise steadily over time, they tend to transition from using traditional biomass resources fuel (such as wood and dung) to more modern commercial fuels, such as electricity and gas, for their energy needs. It is worth mentioning that switching to alternative energy options poses challenges due to factors that play a role in determining the preferred mix of energy sources, including factors such as availability, ease of access, pricing, dependability, convenience and personal preferences. Financial inclusion shapes the energy ladder by providing affordable and dependable energy options for individuals facing financial constraints.
Based on the literature synthesis, the study adopts the conceptual framework shown in Figure 1 to investigate the impact of financial inclusion on carbon emissions and the mechanism of household consumption. This framework will consider both dimensions of financial inclusion, relevant control variables and the mechanism variable.
Conceptual framework
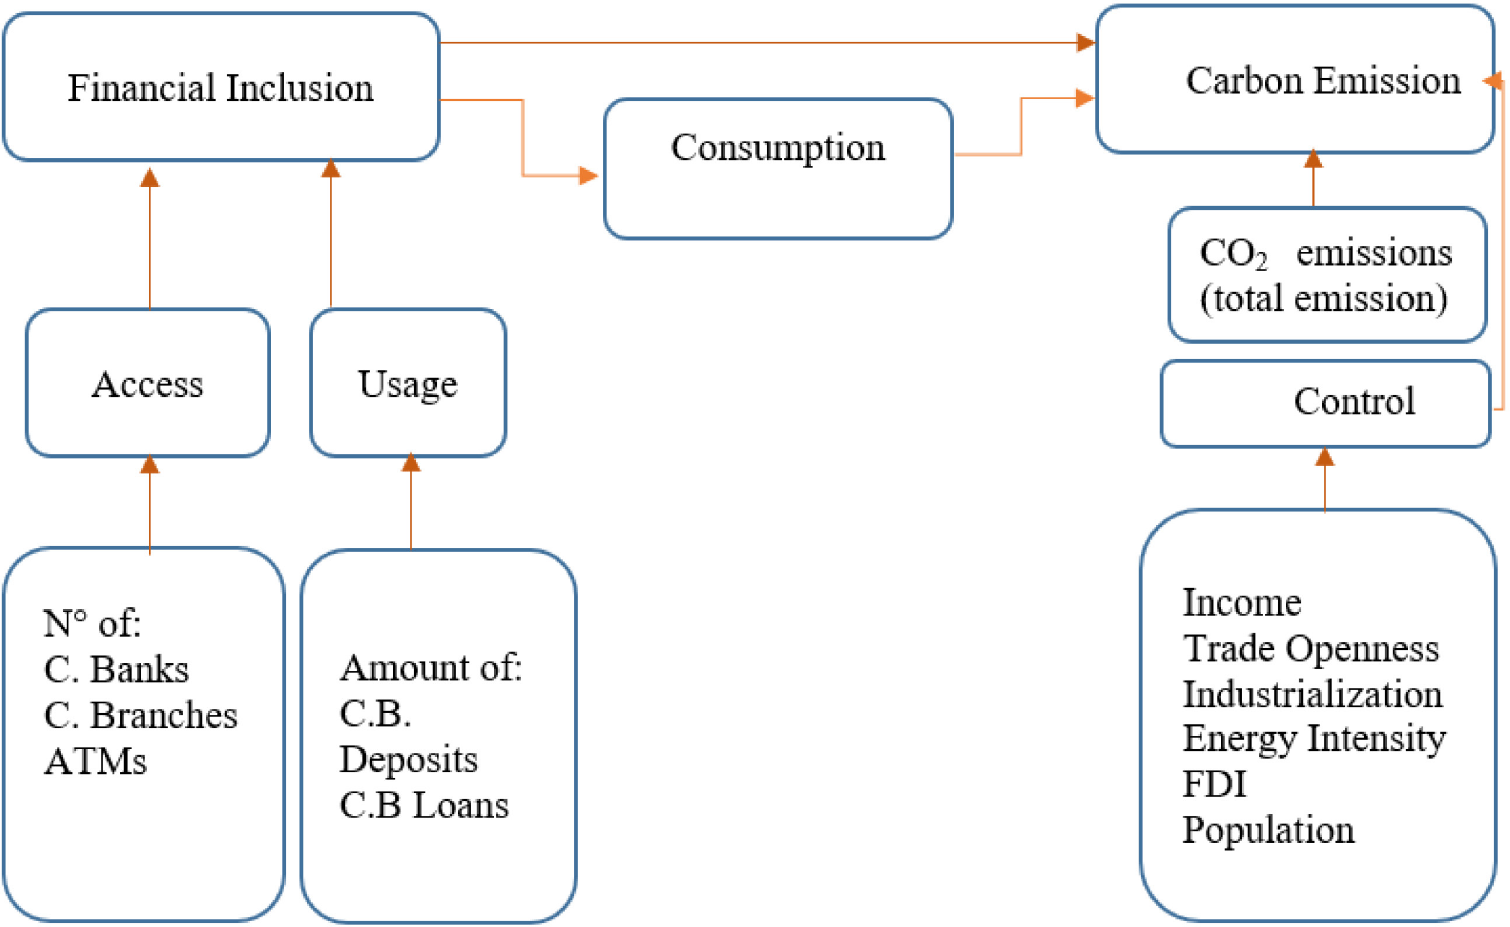
A well-developed financial sector is a critical factor in nations’ economic development. However, its impact on environmental change has not received enough attention. This study aims to investigate the impacts of financial inclusion on the environment, specifically carbon emissions in Sub-Saharan African (SSA) economies. Therefore, the study uses a Two-way fixed effect (TWFE) estimator to analyse the impact of financial inclusion on environmental performance across 44 SSA nations from 2004 to 2022.
The study will adopt the two-way fixed effects model using the reghdfe command in Stata software (
This paper constructs the following fixed-effect model to examine the impact of financial inclusion on Carbon Emission in SSA countries:
(1)
Where subscripts i and t denote country and year, respectively, and LnCO2 represents total CO2 emissions. The core explanatory variable Fi is the financial inclusion index contracted using Principal Component Analysis (PCA); Lninc, Lnto, Lnei, Lnind, LnP, and LnFDI represent the control variables in this study; θi is country-fixed effects, δt is time-fixed effects, and εit is an unobserved error term.
The study uses panel data from 44 Sub-Saharan African countries from 2004 to 2022 and adopts nine variables described in Table 1.
Variables description
| Type | Variable | Abbreviation | Description | Data source |
|---|---|---|---|---|
| Dependent variable | Carbon emission | CO2 | CO2 emissions (total emission) | World Development Indicator (WDI) |
| Independent variable | Financial inclusion index | Fi | Financial inclusion index using Principal Component Analysis | IMF |
| Control variables | Economic growth | EG | GDP per capita, in current USD | WDI |
| Trade openness | TO | Trade, in % of GDP | WDI | |
| Energy intensity | EI | The energy intensity level of primary energy, in MJ/USD2017 PPP GDP | WDI | |
| Industrialisation | IND | Industry (incl. construction) value added, in current USD | WDI | |
| Population | P | Population growth, in annual % | WDI | |
| Foreign direct investment | FDI | Foreign direct investment net inflows (BoP), in current USD | WDI | |
| Mechanism variable | Consumption | CON | Households and NPISHs final consumption expenditure per capita, in USD2015 | WDI |
Table 2 highlights the proxies used to construct the Fi composite index, as done by [29]. Financial inclusion is the most important regressor and includes a combination of various proxy measures to measure its multidimensional nature accurately. Therefore, this study adopts the PCA approach to construct a composite index for financial inclusion.
Financial inclusion proxies
| Variable | Abbreviation | Measurement of variables | Data source |
|---|---|---|---|
| Number of commercial banks | CB | Geographical scope | Financial Access Survey – IMF |
| Number of ATMs per 1000 km2 | ATM | ||
| Number of commercial bank branches per 1000 km2 | CBB | ||
| Outstanding deposits with commercial banks (% of GDP) | ODEP | Utilisation of financial services | |
| Outstanding loans from commercial banks (% of GDP) | OL |
Table 3 presents an overview of the summary statistics for the variables included in our econometric model. The results show significant differences in carbon emission intensity in different cities. The minimum and maximum values for carbon emission are 11.2020 and 20.0204, and the average is 14.9154, which indicates that carbon emission is geographically imbalanced. The standard deviations of the variables show that the variables are concentrated around the mean values). The skewness values indicate that the positively skewed variables are more than the negative ones. Kurtosis values are positive, which means that the distribution is leptokurtic. The Jarque-Bera test denotes the non-normal distribution of our variables.
Descriptive statistics
| Stats | LnCO2 | Fi | Lninc | Lnto | Lnind | Lnei | LnP | FDI | Lncon |
|---|---|---|---|---|---|---|---|---|---|
| Mean | 14.9154 | 0.1785 | 7.1591 | 4.1304 | 3.1273 | 1.7024 | 15.9111 | 3.9274 | 6.8567 |
| Sd | 1.6516 | 0.1147 | 1.0294 | 0.4752 | 0.4667 | 0.5231 | 1.6357 | 5.4486 | 0.8276 |
| Min | 11.2020 | 0.0000 | 4.8562 | 0.9928 | 1.4725 | 0.3646 | 11.3203 | –11.1917 | 5.3081 |
| Max | 20.0204 | 1.0000 | 9.8959 | 5.4631 | 4.4350 | 3.1108 | 19.2025 | 56.2638 | 8.9604 |
| Skewness | 0.4096 | 1.4482 | 0.6081 | –0.4914 | –0.2030 | 0.3420 | –0.6521 | 3.4342 | 0.4844 |
| Kurtosis | 3.9213 | 6.7744 | 2.7185 | 6.7693 | 3.7827 | 2.3815 | 3.0816 | 22.8781 | 2.4610 |
| Jarque-Bera | 49.34 | 788.5 | 53.57 | 465.3 | 26.34 | 26.65 | 59.49 | 0.00015 | 35.28 |
| N | 779 | 836 | 825 | 736 | 813 | 752 | 836 | 820 | 689 |
Table 4 shows that the maximum correlation coefficient value among independent variables is –0.5457, below the value of ± 0.7, generally used as the rule of thumb for high correlation. It suggests that neither collinearity nor multicollinearity is considered a concern in our data.
Correlation matrix
| LnCO2 | Fi | Lninc | Lnto | Lnind | Lnei | LnP | FDI | |
|---|---|---|---|---|---|---|---|---|
| LnCO2 | 1 | |||||||
| Fi | 0.6992* | 1 | ||||||
| 0.000 | ||||||||
| Lninc | 0.4329* | 0.2296* | 1 | |||||
| 0.000 | 0.000 | |||||||
| Lnto | 0.0292 | –0.2137* | 0.5391* | 1 | ||||
| 0.4415 | 0.0000 | 0.000 | ||||||
| Lnind | 0.3962* | 0.016 | 0.3679* | 0.4167* | 1 | |||
| 0.000 | 0.648 | 0.000 | 0.000 | |||||
| Lnei | 0.0879* | –0.0556 | –0.5349* | –0.2673* | –0.0253 | 1 | ||
| 0.0200 | 0.1280 | 0.000 | 0.000 | 0.4925 | ||||
| LnP | 0.6758* | 0.4694* | –0.4326* | –0.5457* | 0.1371* | 0.4399* | 1 | |
| 0.000 | 0.000 | 0.000 | 0.000 | 0.0001 | 0.000 | |||
| LnFDI | 0.2103* | –0.0526 | 0.0657 | 0.3210* | –0.1114* | –0.0427 | –0.2605* | 1 |
| 0.0000 | 0.1324 | 0.0599 | 0.000 | 0.0015 | 0.2421 | 0.000 |
As shown in Table 5, the Variance Inflation Factor (VIF) further affirms the result because it is performed to test collinearity between our variables. The maximum VIF is 3.96, while the mean VIF is 2.43, much lower than the threshold value 10 generally used in academic literature, confirming that our model does not suffer from collinearity or multicollinearity problems. All variables in the econometric model for this research show a significant positive correlation with the dependent variable, where Fi has the highest correlation with LnCO2.
Variance Inflation Factor
| Variable | VIF | 1/VIF |
|---|---|---|
| LnP | 3.96 | 0.2524 |
| Lninc | 3.21 | 0.3111 |
| Fi | 2.96 | 0.3375 |
| Lnind | 2.31 | 0.4337 |
| Lnto | 2.03 | 0.4936 |
| Lnei | 1.45 | 0.6883 |
| LnFDI | 1.1 | 0.9129 |
| Mean VIF | 2.43 |
The study’s primary goal is to investigate how financial inclusion impacts carbon emissions in Saharan Africa utilising the two-way fixed effect model pioneered by Mundlak in 1978 [45] based on the data sample provided.
Presented in Table 6 are the results from eq. (1); columns (1) and (2) display the outcomes of the fixed and random effects, respectively, employed for the Hausman test. With a p-value of 0.000, the null hypothesis is rejected in favour of the fixed effect model under the Hausman test. It is evident that, observing Columns (3)–(5), all coefficients of the financial inclusion index used in the study consistently showed positive and statistically significant effects on carbon emissions at a significance level of 1%. The correlation between financial inclusion and Carbon Emission suggests that more significant financial activity is linked to higher levels of atmospheric carbon emissions.
The regression analysis in columns (4) and (5) demonstrates statistically significant correlations between several economic variables and CO2 emissions. In column (4), a statistically significant positive relationship exists between Economic Growth (Lninc) and emissions at a 1% significance level. This suggests that wealthier countries produce CO2 emissions on a larger scale than others with lower incomes. The coefficient of trade openness (Lnto) has a statistically negligible negative impact. However, the coefficients of energy intensity (Lnei) and industrial output (Lnind) positively increase emissions at a significance level of 1%. This highlights the impacts associated with energy consumption and industrial activities. The population size (LnP) has a negative but statistically insignificant correlation. In contrast, foreign direct investment (LnFDI) has a modest but statistically significant negative impact at a significance level of 5%, suggesting that FDI might help reduce emissions. Including fixed effects for both country and year in column (5) enhances the precision of existing correlations. The association between the financial inclusion index and carbon emissions remains positive but with a reduced magnitude of impact. Results show a notable positive correlation between trade openness and emissions, suggesting that countries with higher levels of openness might experience increased emissions rates. While the impact of energy intensity (Lnei) and industrial production (Lnind) has decreased somewhat in magnitude by incorporating the county and year-fixed effect in column (5), they still play roles in driving CO2 emissions; the correlation between population size (LnP) and emissions levels is positive, suggesting that larger populations are linked to higher emissions levels (all results at a significance level of 1%). The influence of Foreign Direct Investment (FDI) becomes insignificant. At the same time, the high R squared value in column (5) indicates that the model adequately accounts for a considerable amount of the variability in CO2 emissions. This emphasises the need to consider country-specific and time-specific elements when analysing the influence of financial inclusion on the region’s carbon emissions while maintaining significant control variables.
Baseline results where FE denotes Fixed Effects, including country and year effects; robust standard errors are shown in parentheses, *** p<0.01, ** p<0.05, * p<0.1
| Variable | LnCO2 | ||||
|---|---|---|---|---|---|
| (1) | (2) | (3) | (4) | (5) | |
| Fi | –0.490* | 1.245*** | 9.885*** | 9.148*** | 0.762*** |
| (0.291) | (0.312) | (0.580) | (0.363) | (0.281) | |
| Lninc | 0.212*** | 0.420*** | 0.472*** | 0.311*** | |
| (0.0324) | (0.0354) | (0.0584) | (0.0457) | ||
| Lnto | 0.254*** | 0.288*** | –0.0429 | 0.314*** | |
| (0.0407) | (0.0482) | (0.109) | (0.0470) | ||
| Lnei | 0.140** | 0.176** | 0.644*** | 0.468*** | |
| (0.0609) | (0.0687) | (0.0736) | (0.0643) | ||
| Lnind | 0.0889* | 0.0478 | 0.843*** | 0.148*** | |
| (0.0474) | (0.0547) | (0.0986) | (0.0505) | ||
| LnP | 1.924*** | 1.060*** | –0.0865 | 1.094*** | |
| (0.0791) | (0.0571) | (0.113) | (0.200) | ||
| LnFDI | –0.00135 | –0.00267 | –0.0166** | 0.00116 | |
| (0.00231) | (0.00276) | (0.00762) | (0.00197) | ||
| Constant | 13.18*** | 6.792*** | 5.596*** | ||
| –18.84*** | –6.867*** | (0.102) | (0.789) | (0.876) | |
| Observations | 779 | 625 | 625 | ||
| R-squared | 0.489 | 0.756 | 0.988 | ||
Overall significance Hausman test Groupwise heteroscedasticity |
F(7,581) = 231.18 Prob > F = 0.0000 chi2(7) = 219.14 Prob > chi2 = 0.0000 chi2(37) = 1382.97 Prob > chi2 = 0.0000 |
||||
| Country FE | YES | ||||
| Year FE | YES | ||||
While the two-way fixed effects model effectively accounts for unobserved heterogeneity across nations over time, endogeneity issues can still be affected due to biases arising from omitted variable bias and measurement error. Even though the empirical approach has managed to consider factors affecting a country’s carbon emissions accurately, a chance of bias remains due to missing variables that stem from unobservable elements. The study addressed these problems using the instrumental variable (IV) method. In particular, the financial inclusion index (Fi) lag was utilised as an instrument. By using the exogenous variance in the lagged financial inclusion index, which is associated with the present financial inclusion index but uncorrelated with the error term, this approach helps to reduce endogeneity. The results obtained from the instrumental variable (IV) estimation in column (2) of Table 7 are consistent with those obtained from the two-way fixed effects model. This adds weight to our conclusions and confirms the significant impact of financial inclusion on carbon emissions.
Instrumental variable approach; robust standard errors in parentheses, *** p<0.01, ** p<0.05, * p<0.1
| Variable | LnCO2 | |
|---|---|---|
| (1) | (2) | |
| Fi | 0.891** | |
| L1. | 0.852*** (0.363) | (0.4152) |
| Lninc | –0.014*** (0.0031) | 0.311*** (0.0451) |
| Lnto | –0054* (0.0032) | 0.302*** (0.0464) |
| Lnei | –0.0088* (0.0048) | 0.501*** (0.0689) |
| Lnind | –0.0019 (0.0036) | 0.158*** (0.0514) |
| LnP | 0.0152 (0.0135) | 1.141*** (0.1915) |
| LnFDI | 0.0001 (0.0002) | 0.0017 (0.0025) |
| Observations | 593 | 593 |
| Country FE | YES | YES |
| Year FE | YES | YES |
| First-stage F-statistic | F(1, 533) = 1180.18 | |
Cragg-Donald Wald F statistic |
1180.18 | 1180.176 |
Kleibergen-Paap Wald rk F statistic |
||
| Anderson canon.corr LM statistic test | Chi-sq(1) 408.51*** | Chi-sq(1) 408.507*** |
This section discusses the approaches to testing the reliability of the results of the presented research.
In addition to using the IV method in our analysis processes, the two-step GMM estimator was included to ensure the reliability of our results and address any concerns related to endogeneity issues in our study. The two-step system GMM estimator that is employed is based on the work of Blundell & Bond in 1998 [46] equations at both levels and first differences, with lagged values of endogenous variable Fi functioning as instruments. The outcomes presented in Table 8 are reliable, aligning with the results obtained from our baseline regression and the IV method estimation. Our findings show that the stability of our model indicates its reliability and highlights the significant influence of financial inclusion on carbon emissions. This holds even when potential endogeneity factors are considered.
An alternative measure of our dependent variable, Carbon Emission (total in kilotons) generated using solid, liquid, and gas fuels and gas flaring, with CO2 emission in metric tons per capita, is used to evaluate the robustness of our findings. In Table 9, columns (1) and (2) present the independent variable’s influence on carbon emissions, measured in metric tons per capita. The results shown in the table exhibit robustness and consistency with the conclusions drawn in the baseline regression analysis across all estimations. The study shows a statistically significant positive correlation between financial inclusivity and a nation’s carbon footprint at a significance level of 1%, considering both scenarios without control variables and with control variables in place. The findings imply that the advancement of financial inclusion greatly influences a country’s carbon emissions, leading to environmental degradation.
Two-step system GMM approach; robust standard errors in parentheses, *** p<0.01, ** p<0.05, * p<0.1
| LnCO2 | Coef. | Corrected st. err. | t-value | p-value | 95% Conf. | Interval |
|---|---|---|---|---|---|---|
| L | 0.876*** | 0.061 | 14.41 | 0.000 | 0.757 | 0.995 |
| Fi | 1.787** | 0.758 | 2.36 | 0.018 | 0.301 | 3.273 |
| Lninc | –0.006 | 0.067 | –0.09 | 0.929 | –0.137 | 0.125 |
| Lnto | –0.084 | 0.074 | –1.14 | 0.256 | –0.229 | 0.061 |
| Lnind | 0.172* | 0.099 | 1.74 | 0.081 | –0.022 | 0.366 |
| Lnei | 0.144* | 0.084 | 1.72 | 0.086 | –0.02 | 0.308 |
| LnFDI | 0.001 | 0.002 | 0.64 | 0.521 | –0.003 | 0.005 |
| LnP | –0.091 | 0.081 | –1.13 | 0.258 | –0.25 | 0.067 |
| Constant | 2.631** | 1.229 | 2.14 | 0.032 | 0.222 | 5.04 |
| Mean dependent var. | 14.952 | SD dependent var. | 1.519 | |||
| Observations | 561 | Chi-square | 970108.195 | |||
| AR(1) | 0.000 | |||||
| AR(1) | 0.219 | |||||
| Sargan test | 0.498 | |||||
| Hansen test | 0.498 | |||||
Number of groups Wald chi2(8) Prob > chi2 |
37 970108.20 0.000 |
Number of instruments | 25 | |||
Alternative explained variable and lag of independent variables regression, data notation as in Table 8
| Variable | LnCO2 in metric tons per capita | |||
|---|---|---|---|---|
| (1) | (2) | (3) | ||
| Fi | 0.373*** (0.136) | 0.688*** (0.257) | L.Fi | 0.575* (0.309) |
| Lninc | 0.277*** (0.0401) | L.lninc | 0.286*** (0.0456) | |
| Lnto | 0.287*** (0.0406) | L.lnto | 0.325*** (0.0486) | |
| Lnei | 0.148** (0.0672) | L.lnei | 0.370*** (0.0689) | |
| Lnind | 0.0563 (0.0440) | L.lnind | 0.125** (0.0486) | |
| LnP | 0.959*** (0.180) | L.LnP | 1.143*** (0.198) | |
| LnFDI | 0.000553 (0.00149) | L.FDI | 0.00113 (0.00204) | |
| Constant | –1.120*** (0.0256) | – 8.570*** (0.838) | 5.851*** (0.873) | |
| Observations | 836 | 660 | 625 | |
| R-squared | 0.976 | 0.989 | 0.988 | |
| Country FE | YES | YES | YES | |
| Year FE | YES | YES | YES | |
The research conducted a test to ensure the robustness of our findings by including lagged values of the independent and control variables in the analysis process. This approach aims to reduce the risk of causality and dynamic effects by using lagged values that are less likely to correlate with the current error term. The results obtained through incorporating lagged variables in Table 9, column (3), align with those from the two-way fixed effects model, reinforcing the reliability and validity of our findings. The consistency of this finding highlights the substantial influence of financial inclusion on carbon emissions. This influence remains notable when taking into account potential endogeneity and dynamic interactions.
This part of the study delves into the connection between inclusion and its influence on carbon emissions via the role of household consumption.
Financial inclusion enhances the availability of services and facilitates access to credit and other financial offerings for households and businesses. Due to improved access to finances, households and firms may boost their consumption levels, ultimately driving up the demand for products and services, increasing production activities and leading to higher carbon emissions. Consumption is measured by the natural logarithm of the Country’s Households and NPISHs’ final consumption expenditure per capita, denoted as LnCon.
Table 10 presents the relationship between Financial Inclusion and CO2 emissions, evaluated with consumption as a mediating variable. The analysis was conducted in three stages: First column (1), the direct impact of financial inclusion on CO2 emissions was evaluated; second column (2), the effect of financial inclusion on consumption; and third column (3), estimating the relationship of both financial inclusion and consumption on CO2 emissions. The research findings revealed financial inclusion positively and significantly impacts consumption and CO2 emissions. In addition, consumption was also discovered to mediate the relationship between financial inclusions, with approximately 12.5% of the effect being explained through consumption. It indicates that financial inclusion directly impacts CO2 emissions, but some of the effects are through increased consumption.
Mechanism analysis; robust standard errors in parentheses, *** p<0.01, ** p<0.05, * p<0.1
| Variable | (1) LnCO2 |
(2) LnCon |
(3) LnCO2 |
|---|---|---|---|
| Fi | 0.762*** (0.281) | 0.405*** (0.151) | 1.077*** (0.278) |
| Lncon | 0.309*** (0.101) | ||
| Lninc | 0.311*** (0.0457) | 0.134*** (0.0230) | 0.365***(0.0482) |
| Lnto | 0.314*** (0.0470) | −0.0196 (0.0253) | 0.294*** (0.0463) |
| Lnind | 0.148*** (0.0505) | −0.0179 (0.0302) | 0.0723 (0.0500) |
| Lnei | 0.468*** (0.0643) | –0.129*** (0.0432) | 0.563*** (0.0662) |
| LnP | 1.094*** (0.200) | –0.407*** (0.104) | 1.357*** (0.185) |
| LnFDI | 0.00116 (0.00197) | 0.000786 (0.00107) | 0.00331* (0.00196) |
| Constant | 5.596*** (0.876) | 12.59*** (1.575) | 2.178** (1.079) |
| Observations | 625 | 624 | 589 |
| R-squared | 0.988 | 0.991 | 0.990 |
| Country FE | YES | YES | YES |
| Year FE | YES | YES | YES |
The pathway through which financial inclusion impacts carbon emissions is better understood by linking these two analyses. The advancement of inclusion provides real income to households and businesses by easing financial restrictions and enhancing spending. Nevertheless, this increased spending results in heightened carbon emissions, underlining the importance of implementing policies harmonising progress with environmental conservation.
This part of the study discusses the heterogeneity of financial ecosystems of SSA countries and its impact on the level of countries’ carbon emissions.
The 44 Sub-Saharan African countries included in the study have different and diverse financial ecosystems. Kenya, for example, has a well-developed money system with M-Pesa [47], while other countries mostly rely on traditional banking, have lower financial services, and exhibit varying regulatory frameworks governing financial services [48]. Considering poverty and inequality disparities across SSA countries, heterogeneity analysis is necessary for understanding and practical policy design for interventions.
Table 11 presents the outcome of the heterogeneity analysis of the level of financial inclusion in SSA countries. Column (1) in Table 11 estimates higher Fi countries, while column (2) estimates lower Fi countries. Evidence shows that financial inclusion positively impacts carbon emission in column (1) while insignificant in lower Fi countries, making our baseline regression robust and consistent.
Heterogeneity analysis by level of financial inclusion; robust standard errors in parentheses, *** p<0.01, ** p<0.05, * p<0.1
| Variable | LnCO2 | |
|---|---|---|
| (1) | (2) | |
| Fi | 1.520*** (0.503) | 0.262 (0.342) |
| Lninc | 0.426*** (0.0838) | 0.218*** (0.0587) |
| Lnto | 0.431***(0.0621) | 0.308*** (0.0559) |
| Lnind | 0.108 (0.0839) | –0.0144 (0.0741) |
| Lnei | 0.488*** (0.118) | 0.244*** (0.0940) |
| LnP | 0.439* (0.255) | 2.225*** (0.376) |
| LnFDI | 0.00248 (0.00375) | –0.00178 (0.00208) |
| Constant | 6.658*** (1.115) | 2.896* (1.750) |
| Observations | 308 | 315 |
| R-squared | 0.994 | 0.984 |
| Country FE | YES | YES |
Sub-Saharan Africa refers to the part of the African continent that lies south of the Sahara Desert. This vast area includes Central Africa, East Africa, Southern Africa, and West Africa; each region listed exhibits a different level of economic development. East Africa, for example, has shown different growth patterns than West and Southern Africa [49]. Due to differences in infrastructure, governance and socio-economic conditions, financial inclusion policies that work in one region might not be effective in another. Understanding these disparities helps assess how financial inclusion impacts each region’s carbon emission, which is uniquely important in facilitating the design of region-specific interventions.
Table 12 presents the results of the heterogeneity analysis of the SSA regions. The data shown in columns (1) to (4) of Table 12 indicate that the development of financial inclusion index (Fi) in the Southern and East regions can promote courtiers’ carbon emissions. In contrast, the development of Fi in the Central and West regions is insignificant.
This study investigates, using an advanced econometric method, how financial inclusivity affects carbon dioxide emissions within 44 chosen Saharan African nations from 2004 to 2022. Our research employs the TWFE approach following a validation of the Hausman test and using the IV method to address endogeneity concerns.
Numerous vital findings emerged from our study. Firstly, financial inclusion leads to an increase in a country’s carbon emissions. Secondly, the tests for endogeneity and multiple robustness checks were conducted, and the results remain robust and consistent with our major findings. A study on the mechanism was also performed, revealing that financial inclusion could influence countries’ carbon emissions. Enhanced access to financial services, including the availability of credit and other financial products, can increase household and firm consumption, leading to higher demand for goods and services, thus increasing production and carbon emissions. The impact of financial inclusion is more significant and pronounced in the eastern and southern regions of Sub-Saharan Africa than in the western and central areas.
Heterogeneity analysis by region; robust standard errors in parentheses, *** p<0.01, ** p<0.05, * p<0.1
| Variable | LnCO2 | |||
|---|---|---|---|---|
(1) East Africa |
(2) Southern Africa |
(3) West Africa |
(4) Central Africa |
|
| Fi | 1.128** (0.434) | 1.435** (0.566) | 0.449 (0.421) | –0.376 (0.477) |
| Lninc | –0.0578 (0.0665) | 1.313*** (0.178) | 0.535*** (0.0654) | 0.263*** (0.0952) |
| Lnto | 0.198*** (0.0683) | 0.216** (0.0967) | 0.320*** (0.0723) | –0.0183 (0.108) |
| Lnei | 0.220* (0.118) | 0.953*** (0.170) | 1.140*** (0.110) | –0.0477 (0.134) |
| Lnind | 0.172 (0.132) | –0.139 (0.157) | 0.164*** (0.0539) | –0.395* (0.218) |
| LnFDI | 0.00101 (0.00846) | 0.00549 (0.00677) | 0.00192 (0.00201) | 0.00416 (0.00307) |
| LnP | 4.095*** (0.967) | –0.974*** (0.235) | 2.398*** (0.389) | 1.716*** (0.196) |
| Constant | 33.29*** (4.353) | 6.465** (1.895) | –2.503 (1.829) | 8.435** (1.028) |
| Observations | 182 | 84 | 244 | 115 |
| R-squared | 0.993 | 0.999 | 0.987 | 0.991 |
| Country FE | YES | YES | YES | YES |
| Year FE | YES | YES | YES | YES |
Our research findings contribute to the body of knowledge on the relationship between environmental pollution and financial inclusion, household consumption, economic advancement, energy intensity, industrial development, population growth and foreign investment. Additionally, our study supports the idea that as economies expand and industries grow through access to financial services, they tend to produce more CO2 emissions and harm the environment. Therefore, this study makes a theoretical contribution to energy and environmental studies by confirming and supporting the pollution haven theory concerning the 44 Sub-Saharan African nations.
The empirical analysis of the research reveals the following implications: Firstly, most of the credits and financial services provided through financial inclusion in the region are not allocated to eco-friendly projects; instead, they are directed towards initiatives contributing to high energy consumption and carbon emissions. Secondly, it is considered not desirable to attempt to reduce the impact of financial inclusion development on CO2 emissions by restricting economic activities, industrial production and trade, as this could potentially lead to an economic recession. Lastly, efforts should be made to structure and promote the credit potential of inclusion towards supporting green investments that reduce fossil fuel usage.
Based on the empirical evidence of the study, the following policy implications and recommendations are made to promote long-term sustainable development in Sub-Saharan Africa through financial inclusion. Financial services should prioritise eco-friendly projects that cater to the region’s specific needs. While a large portion of existing assistance goes towards vital economic endeavours like agriculture, local trade and infrastructural development, there is a concern about the high energy consumption levels associated with these activities in the region. SSA nations must focus on establishing environmental protection agencies that collaborate with economic organisations and institutions to encourage and steer funding for initiatives that effectively match the country’s climate objectives. These policies should guide environmental institutions to develop strategies that facilitate sustainable development by reallocating some financial services and products towards environmentally friendly initiatives such as implementing solar-powered irrigation systems for farmers or establishing community-owned solar power solutions. Working together, the public and private sectors can help individuals and small businesses access green loans through subsidised loan programs and government-backed guarantees. The energy sector presents a chance for environmentally friendly investments to thrive in Sub-Saharan Africa, where numerous areas suffer from electricity shortages. Solar and wind power are viable and economical alternatives to conventional fossil fuels in this region. By encouraging funding through loans and investments for home setups, mini-grid projects based on solar projects and hydropower initiatives, communities can transition to clean energy sources without relying heavily on high-carbon options like fossil fuels.
Achieving a balance between environmental goals and economic stability involves implementing strategies that make it easier to access funding for energy-efficient solutions in industries with high emissions like transportation, infrastructure and manufacturing sectors. The government could encourage the adoption of green technologies by promoting the local manufacturing of electric cars or cost-effective solar panels, which would create jobs and bring about positive environmental impacts. Local governments, non-governmental organisations, and educational institutions can significantly impact how people view environment-friendly projects and initiatives through their awareness campaigns. Using languages and messaging that resonate with the culture is essential to help individuals comprehend the importance of adopting eco-friendly habits. To enhance the effectiveness of campaigns, utilise community radio stations, mobile educational units and partnerships with religious and community figures.
The current study is not devoid of constraints. Its focus was limited to the 44 Sub-Saharan African nations. It was constrained by a lack of available data on some mechanisms and variables like technology, which would have been critical for this empirical analysis. Subsequent research endeavours should incorporate a variable to capture the diverse impacts of ICT and financial inclusion on the environment in the region.
This study analysed publicly available datasets. The data can be found on the World Bank and International Monetary Fund websites at
The research was conducted without commercial or financial relationships that could be construed as a potential conflict of interest.
| 2SLS | Two-Stage Least Squares |
| ATM | Automated Teller Machine |
| BoP | Balance of Payment |
| BRICS | Brazil, Russia, India, and China + six partner countries |
| EKC | Environmental Kuznets Curve |
| FDI | Foreign Direct Investment |
| FE | Fixed Effects |
| FI | Financial Inclusion |
| Fi | Financial Inclusion Index |
| GDP | Gross Domestic Product |
| GMM | Generalised Method of Moments |
| IMF | International Monetary Fund |
| IV | Instrumental Variable |
| NPISH | Non-Profit Institutions Serving Households |
| OBOR | One Belt One Road |
| PCA | Principal Component Analysis |
| SSA | Sub-Saharan Africa |
| TWFE | Two-Way Fixed Effect |
| VIF | Variance Inflationary Factor |
- Global energy-related CO2 emissions by region 2023 | Statista, 2024, https://www.statista.com/statistics/205966/world-carbon-dioxide-emissions-by-region
- Regulatory Indicators for Sustainable Energy 2018, 2024, https://www.worldbank.org/en/topic/energy/publication/rise-2018
- ,
Financial Inclusion and Carbon Reduction: Evidence From Chinese Counties ,Front Environ Sci , Vol. 9 ,pp 793221 , 2022, https://doi.org/https://doi.org/10.3389/FENVS.2021.793221/BIBTEX - ,
The pathway to the natural gas industry: Financial development, coal consumption, and carbon dioxide emissions in P.R. China ,Sci Prog , Vol. 106 (1), 2023, https://doi.org/https://doi.org/10.1177/00368504231160643/ASSET/IMAGES/LARGE/10.1177_00368504231160643-FIG1.JPEG - ,
Constraints to the uptake of solar home systems in Ho Chi Minh City and some proposals for improvement ,Renew Energy , Vol. 118 ,pp 245–256 , 2018, https://doi.org/https://doi.org/10.1016/J.RENENE.2017.10.106 - ,
Consumption-based carbon emissions, renewable energy consumption, financial development and economic growth in Chile ,Bus Strategy Environ , Vol. 31 (3),pp 1123–1137 , 2022, https://doi.org/https://doi.org/10.1002/BSE.2945 - ,
Consumption-based carbon emissions in Mexico: An analysis using the dual adjustment approach ,Sustain Prod Consum , Vol. 27 ,pp 947–957 , 2021, https://doi.org/https://doi.org/10.1016/J.SPC.2021.02.020 - ,
Financial stability, energy consumption and environmental quality: Evidence from South Asian economies ,Renewable and Sustainable Energy Reviews , Vol. 67 ,pp 1105–1122 , 2017, https://doi.org/https://doi.org/10.1016/J.RSER.2016.09.021 - ,
Impact of financial development and technological innovation on the volatility of green growth—evidence from China ,Environmental Science and Pollution Research , Vol. 28 (35),pp 48053–48069 , 2021, https://doi.org/https://doi.org/10.1007/S11356-021-13828-3/FIGURES/1 - ,
The Impact of Financial Development on Carbon Emission: Evidence from China ,Sustainability 2020 , Vol. 1212 (17),pp 6959 ,pp 6959 , 2020, https://doi.org/https://doi.org/10.3390/SU12176959 - ,
Does financial instability increase environmental degradation? Fresh evidence from Pakistan ,Econ Model , Vol. 33 ,pp 537–544 , 2013, https://doi.org/https://doi.org/10.1016/J.ECONMOD.2013.04.035 - ,
CO2 emissions in BRICS countries: what role can environmental regulation and financial development play? ,Clim Change , Vol. 172 (1–2),pp 1–14 , 2022, https://doi.org/https://doi.org/10.1007/S10584-022-03362-7/TABLES/5 - ,
Financial inclusion and its influence on economic-environmental performance: demand and supply perspectives ,Environmental Science and Pollution Research , Vol. 29 (38),pp 58212–58221 , 2022, https://doi.org/https://doi.org/10.1007/S11356-022-18856-1/TABLES/5 - ,
Impact of Financial Inclusion on Consumption Expenditure in Kenya ,Int J Econ Finance , Vol. 10 (5),pp p114 , 2018, https://doi.org/https://doi.org/10.5539/IJEF.V10N5P114 - ,
Impacts of household income change on CO2 emissions: An empirical analysis of China ,J Clean Prod , Vol. 157 ,pp 190–200 , 2017, https://doi.org/https://doi.org/10.1016/J.JCLEPRO.2017.04.126 - , ICT, Financial Inclusion, and Growth: Evidence from African Countries, Cairo, 20102024
- ,
How does long-term finance affect economic volatility? ,Journal of Financial Stability , Vol. 33 ,pp 41–59 , 2017, https://doi.org/https://doi.org/10.1016/J.JFS.2017.10.005 - ,
The Global Findex Database 2017: Measuring Financial Inclusion and Opportunities to Expand Access to and Use of Financial Services ,World Bank Econ Rev , Vol. 34 (1),pp S2–S8 , 2020, https://doi.org/https://doi.org/10.1093/WBER/LHZ013 - Inclusive Digital Economies for the Sustainable Development Goals - UN Capital Development Fund (UNCDF), 2024, https://www.uncdf.org/ide4sdg
- ,
Defining and measuring financial inclusion: A systematic review and confirmatory factor analysis ,J Int Dev , Vol. 33 (2),pp 316–341 , 2021, https://doi.org/https://doi.org/10.1002/JID.3524 - , Measuring Financial Inclusion for Asian Economies, Financial Inclusion in Asia, 2016
- ,
The Basic Analytics of Access to Financial Services ,Financial Markets, Institutions & Instruments , Vol. 16 (2),pp 79–117 , 2007, https://doi.org/https://doi.org/10.1111/J.1468-0416.2007.00120.X - ,
Does financial development mitigate carbon emissions? Evidence from heterogeneous financial economies ,Energy Econ , Vol. 88 ,pp 104768 , 2020, https://doi.org/https://doi.org/10.1016/J.ENECO.2020.104768 - ,
Nexus between Environmental Degradation, Clean Energy, Financial Inclusion, and Poverty: Evidence with DSUR, CUP-FM, and CUP-BC Estimation ,Sustainability 2023 , Vol. 1515 (19),pp 14161 ,pp 14161 , 2023, https://doi.org/https://doi.org/10.3390/SU151914161 - ,
The role of financial development indicators in sustainable development-environmental degradation nexus ,Environmental Science and Pollution Research , Vol. 28 (25),pp 33707–33718 , 2021, https://doi.org/https://doi.org/10.1007/S11356-021-13037-Y/TABLES/7 - ,
Environmental Impacts of a North American Free Trade Agreement , 1991, https://doi.org/https://doi.org/10.3386/W3914 - ,
Revisiting the environmental kuznets curve hypothesis in 208 counties: The roles of trade openness, human capital, renewable energy and natural resource rent ,Environ Res , Vol. 216 ,pp 114637 , 2023, https://doi.org/https://doi.org/10.1016/J.ENVRES.2022.114637 - ,
Modelling for insight: Does financial development improve environmental quality? ,Energy Econ , Vol. 83 ,pp 156–179 , 2019, https://doi.org/https://doi.org/10.1016/J.ENECO.2019.06.025 - ,
Does financial inclusion impact CO2 emissions? Evidence from Asia ,Financ Res Lett , Vol. 34 ,pp 101451 , 2020, https://doi.org/https://doi.org/10.1016/J.FRL.2020.101451 - ,
Is financial development beneficial to improve the efficiency of green development? Evidence from the ‘Belt and Road’ countries ,Energy Econ , Vol. 105 ,pp 105734 , 2022, https://doi.org/https://doi.org/10.1016/J.ENECO.2021.105734 - ,
How do financial inclusion and renewable energy collaborate with Environmental quality? Evidence for top ten countries in technological advancement ,Environmental Science and Pollution Research , Vol. 30 (11),pp 31755–31767 , 2023, https://doi.org/https://doi.org/10.1007/S11356-022-24430-6/FIGURES/4 - ,
How does financial inclusion affect environmental degradation in the six oil exporting countries? The moderating role of information and communication technology ,Front Environ Sci , Vol. 10 ,pp 1013326 , 2022, https://doi.org/https://doi.org/10.3389/FENVS.2022.1013326/BIBTEX - ,
Driving sustainable growth: exploring the link between financial innovation, green finance and sustainability performance: banking evidence ,Kybernetes , Vol. ahead-of-print ,pp ahead-of-print , 2023, https://doi.org/https://doi.org/10.1108/K-05-2023-0918/FULL/XML - ,
The Environmental Kuznets Curve (EKC) Hypothesis in China: A Review ,Sustainability 2023 , Vol. 1515 (7),pp 6110 ,pp 6110 , 2023, https://doi.org/https://doi.org/10.3390/SU15076110 - ,
Mr. Keynes and the ‘Classics’; A Suggested Interpretation ,Econometrica , Vol. 5 (2),pp 147 , 1937, https://doi.org/https://doi.org/10.2307/1907242 - ,
Impact of financial development on CO2 emissions: A comparative analysis of developing countries (D8) and developed countries (G8) ,Environmental Science and Pollution Research , Vol. 27 (11),pp 12461–12475 , 2020, https://doi.org/https://doi.org/10.1007/S11356-019-06680-Z/TABLES/10 - , Economic Policy for Sustainable Development: Role of Monetary Policy, Fiscal Policy and Regulatory Policy, Circular Economy and Sustainability, 2024
- ,
Impact of Financial Inclusion for Welfare: Analyse to Household Level ,Journal of Finance and Islamic Banking , Vol. 1 (2),pp 90–104 , 2018, https://doi.org/https://doi.org/10.22515/JFIB.V1I2.1450 - ,
Carbon emission and financial development under the ‘double carbon’ goal: Considering the upgrade of industrial structure ,Front Environ Sci , Vol. 10 ,pp 1091537 , 2023, https://doi.org/https://doi.org/10.3389/FENVS.2022.1091537/BIBTEX - ,
To Facilitate or Curb? The Role of Financial Development in China’s Carbon Emissions Reduction Process: A Novel Approach ,International Journal of Environmental Research and Public Health 2017 , Vol. 1414 (10),pp 1222 ,pp 1222 , 2017, https://doi.org/https://doi.org/10.3390/IJERPH14101222 - ,
The Impact Of Financial Literacy And Financial Inclusion On Investment Decision In Manado ,Jurnal EMBA: Jurnal Riset Ekonomi, Manajemen, Bisnis dan Akuntansi , Vol. 9 (3),pp 411–418 , 2021, https://doi.org/https://doi.org/10.35794/EMBA.V9I3.34748 - ,
Specification tests in econometrics ,Applied Econometrics , Vol. 38 (2),pp 112–134 , 2015, https://doi.org/https://doi.org/10.2307/1913827 - , Basic Econometrics, 20072024
- ,
Information asymmetry, leverage and firm value: Do crisis and growth matter? ,International Review of Financial Analysis , Vol. 46 ,pp 140–150 , 2016, https://doi.org/https://doi.org/10.1016/J.IRFA.2016.05.002 - ,
On the Pooling of Time Series and Cross Section Data ,Econometrica , Vol. 46 (1),pp 69 , 1978, https://doi.org/https://doi.org/10.2307/1913646 - ,
Initial conditions and moment restrictions in dynamic panel data models ,J Econom , Vol. 87 (1),pp 115–143 , 1998, https://doi.org/https://doi.org/10.1016/S0304-4076(98)00009-8 - ,
Risk Sharing and Transactions Costs: Evidence from Kenya’s Mobile Money Revolution ,American Economic Review , Vol. 104 (1),pp 183–223 , 2014, https://doi.org/https://doi.org/10.1257/AER.104.1.183 - ,
Savings Constraints and Microenterprise Development: Evidence from a Field Experiment in Kenya ,Am Econ J Appl Econ , Vol. 5 (1),pp 163–92 , 2013, https://doi.org/https://doi.org/10.1257/APP.5.1.163 - ,
Structural transformation in sub-Saharan Africa: A comparative analysis of sub-regions performances ,African Journal of Economic and Management Studies , Vol. 11 (2),pp 233–252 , 2020, https://doi.org/https://doi.org/10.1108/AJEMS-06-2019-0236/FULL/XML