With the rapid development of the world’s society and economy, particularly in emerging countries, the increasing energy demand is catastrophic. By 2050, global energy consumption is predicted to double [1]. Fossil fuels continue to meet more than 80% of global energy demand because of their abundance and affordability [2]. However, global fossil fuel reserves are decreasing, resulting in various of environmental issues, indicating that new solutions are required [3]. As a result, the necessity for clean, long-term energy is a key component for society [4].
Over the last decade, methanol synthesis processes have gotten much attention. The catalytic hydrogenation reaction uses carbon dioxide and hydrogen as input components. Catalytic hydrogenation of carbon dioxide is now technically competitive with industrial methanol synthesis from syngas [5], [6], and much potential for large-scale applications and carbon dioxide consumption [7], [8].
CO2 hydrogenation to methanol eliminates the costly synthesis step of the traditional methanol production process [9]. Copper remains the most active catalyst for methanol synthesis when combined with other promoters like zinc, zirconium, cerium, aluminum, and silicon, despite the development and testing of numerous metal-based catalysts. The catalyst Cu/ZnO/Al2O3 is commonly used in the process of synthesizing methanol [10], [11]. According to Ahadzi et al. [12], efficient conversion of CO2 to methanol requires high Cu loading on the catalyst. The Cu-centers are generally regarded as the main active sites; the presence of ZnO is thought to have a stabilizing impact on the copper, and Al2O3 stabilizes and prevents the particles from sintering [13], [14]. Water created during methanol synthesis is said to remain connected to the active sites, which ultimately poisons the catalyst [15]. The Cu/ZnO/Al2O3 catalyst prevents this by inducing a reverse water gas shift reaction and maintaining a high CO/CO2 ratio in the reactor feed stream [16]. It is known that the most important factors for CO2 hydrogenation are temperature, pressure, and feed ratio.
Torcida et al. [17] optimized a multibed reactor for producing biomethane and methanol. Parameters such as feed ratio, pressure conditions, and number of beds were shown to have optimal values in the results. The effect of operational factors such as pressure, temperature, and space velocity on the efficiency of CO2 hydrogenation on fuels were examined by Saeidi et al. [18]. Reactor behavior remains unaffected by variations in pressure and space velocity when the temperature rises, as revealed by the sensitivity analysis, which indicates that this mechanism is temperature dependent. Leonzio et al. [3] utilized analysis of variance (ANOVA) and a central composite design in their investigation of the process of CO2 hydrogenation to methanol. The findings indicated that elevated temperatures and recycling parameters were associated with increased production.
The high CO2 conversion and methanol production observed in commercial Cu/ZnO/Al2O3 catalysts were found to be facilitated by operating pressure and temperature conditions of 124.1 bar and 240 °C, respectively [19]. An example of this can be seen in the methanol yield of 27.3% reported by Kim et al. [20] at an ideal temperature of 247 °C. Additionally, it was observed that a rise in pressure has a beneficial effect on the yield of methanol. At 240 °C, 124.1 bar, and 3300 h-1 space velocity, a pilot-scale reactor system achieved 49% methanol rate and 14.3% CO2 reduction [19]. Methanol yield increased with higher operating pressure, resulting in reduced by-product generation.
Based on the past research, optimization of process variables for CO2 hydrogenation to methanol was found to be minimal, thus this research focuses on the investigation of the combined effects of the H2/CO2 ratio, temperature, pressure, and space velocity (GHSV) toward the CO2 conversion, methanol selectivity and methanol yield as the response variables for tri-promoted (GVII, GV, GIV) Cu/ZnO catalyst supported on Al2O3. The process variables were optimized using face centered (FCCD) along with the RSM method. A model was developed to determine the optimum conditions for methanol synthesis, where the maximum percentage of methanol production was achieved. Under this optimization using RSM method, the pressure range was kept in between 22 – 40 bar (lower pressure range). One significant drawback of RSM models is that their accuracy is limited to a small set of input and process parameters. Additionally, creating higher-order RSM models is more time-consuming, expensive, and requires a large number of tests. Considering this constraint, the present study employed a mix of OFAT and RSM approaches to ascertain the methanol production [21]. Thus, the high-pressure testing range of 40 – 80 bar employed the one-factor-at-a-time (OFAT) method, while the remaining operating conditions, including H2/CO2 ratio, temperature, and space velocity, were held constant at their optimal levels determined during testing at lower pressures.
Prior to the catalytic testing, the bare support and catalyst formulation need to undergo pre-treatment and synthesize. Figure 1 shows the simplified diagram of the catalyst synthesis.
Catalyst synthesis
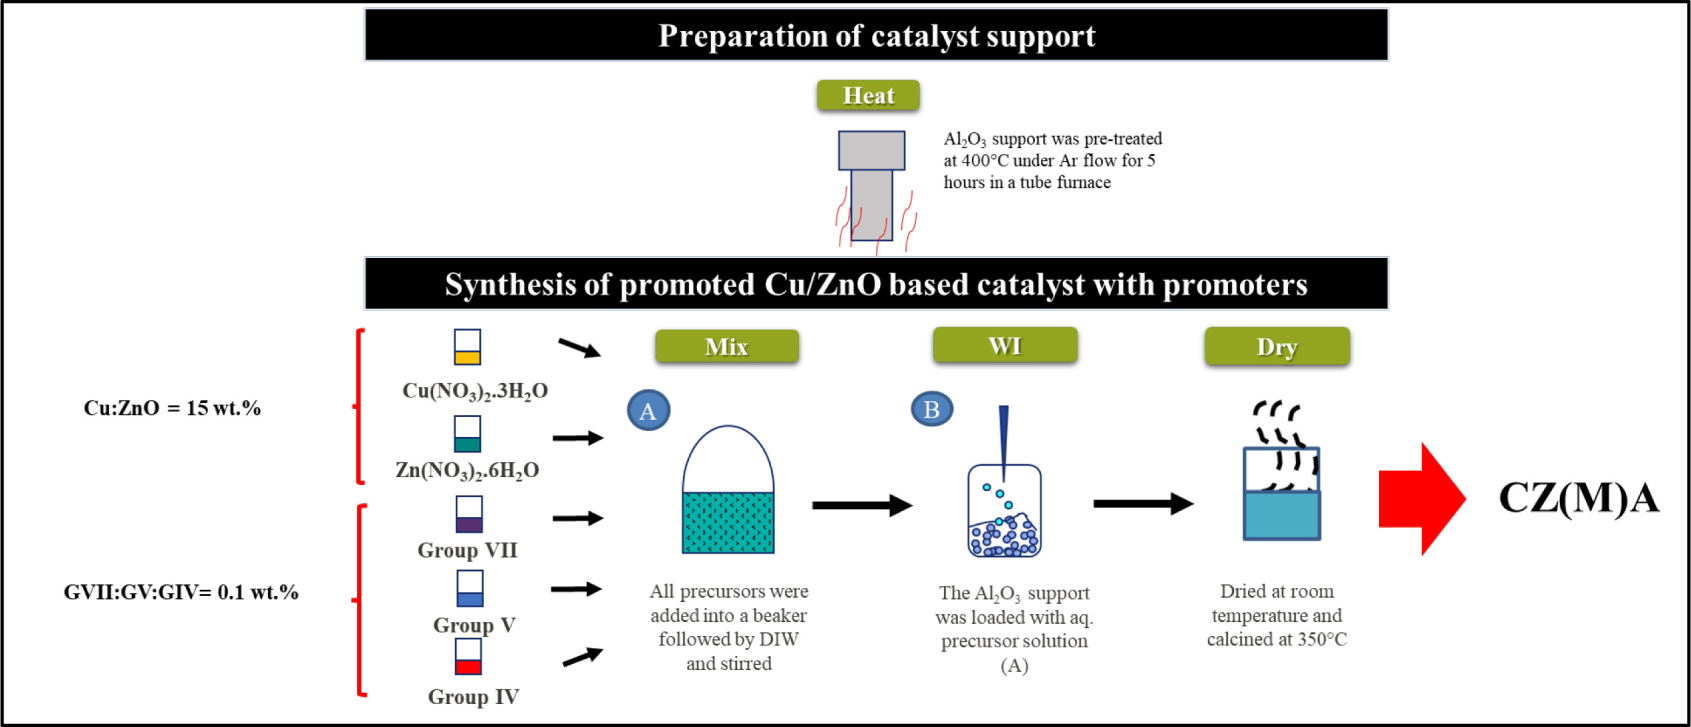
Al2O3, which was purchased from Merck, with purity of 98% has been pre-treated under argon flow at 400 °C for 5 h to remove moisture and impurities.
Cu/ZnO with fixed metal loading of 15 wt.% and tri-promoters (GVII, GV, GIV) with 0.1 wt.% loading was synthesized using wet impregnation method. The amount of each precursor and promoter added was calculated based on the mass of the prepared catalyst. In order to make an aqueous solution, copper (II) nitrate trihydrate (Cu(NO3)2.3H2O), zinc nitrate hexahydrate (Zn(NO3)2.6H2O), Group VII salt, Group V salt, and Group IV salt were dissolved in deionized water. The solution was stirred at room temperature for 1 h. The prepared aqueous precursor solution was then added dropwise to the beaker containing the Al2O3 support. The pH of the mixture was maintained at 7. After stirring for 24 h, the mixture was filtered and rinsed with deionized water. The paste was dried in an oven at 120 °C for 12 h. After drying, the catalyst was placed in a ceramic crucible and calcined for 4 h at 350 °C. The catalyst sample was denoted as CZ(M)A for Cu/ZnO/GVII/GV/GIV/Al2O3. M represents the tri-promoters (GVII/GV/GIV).
The optimization of CO2 hydrogenation to methanol was investigated using two different approach which are Response Surface Methodology (RSM) and one factor at a time (OFAT).
The process parameters of the synthesized CZ(M)A for CO2 hydrogenation reaction were investigated using a standard response surface methodology (RSM) design, also known as central composite design (CCD). H2/CO2 ratio, temperature, pressure (lower range), and space velocity (GHSV) were studied. Using a second-degree polynomial as in eq. (1), an empirical model was built to correlate the responses CO2 conversion (XCO2), MeOH selectivity (SMeOH), and MeOH yield (YMeOH) to the four respective parameters impacting the CO2 hydrogenation process in methanol synthesis:
(1)
where γ is the predicted response; β0 is the constant coefficient; β1, β2 and β3 are the linear coefficients; β12, β13, and β23 are the interaction coefficients; β11, β22, and β33 are the quadratic coefficients; and A, B, C are the coded values of independent input parameters.
Design Expert Version 13 (Stat Ease, USA) was used to correlate all responses and determine experimental condition with the highest desirability. Analysis of variance (ANOVA) described every change in the statistically obtained model and demonstrated the significance of each model parameter. The significance of the model was assessed using the F-test with a 95% confidence level and the lack of fit (LOF) test. When the F-value is higher and the p-value is lower, the model is considered more significant.
One factor at a time approach was employed to optimize pressure at higher range with the rest of the variables (H2/CO2 ratio, temperature, and GHSV) were fixed from RSM optimization.
The CO2 hydrogenation reaction to methanol was carried out in a tubular, stainless steel micro-activity fixed bed reactor. Prior to a reaction, (0.2 – 1.0) g of calcined catalyst was activated in H2 for 2 h. Then, the reaction was performed on the activated catalyst under process conditions listed in Table 1. The reactor effluents were analysed using a gas chromatograph equipped with a TCD detector for H2 and CO2 analysis and an FID detector for alcohols and other hydrocarbons. CO2 conversion, MeOH selectivity, and MeOH yield were calculated using eqs. (2–4), respectively.
Independent variables in experimental design
| Variables | Unit | Levels | ||
|---|---|---|---|---|
| -1 | 0 | +1 | ||
| Low | Medium | High | ||
| H2/CO2 (A) | - | 3 | 6.5 | 10 |
| Temperature (B) | °C | 200 | 250 | 300 |
| Pressure (C) | bar | 22 | 31 | 40 |
| GHSV (D) | mL/g h | 2160 | 6480 | 10800 |
(2)
(3)
(4)
The catalyst performance for CO2 hydrogenation to methanol was evaluated using a fixed bed reactor (5 times reactor volume than microactivity fixed bed reactor). The catalyst was reduced in-situ under H2 flow and atmospheric pressure for 2 h. The pressure was varied in the range of 40 – 80 bar and H2/CO2 ratio, temperature, and GHSV were fixed using optimized conditions from low pressure testing range. The product gases were analysed via an on-line gas chromatograph. The catalytic performance was evaluated based on the CO2 conversion, MeOH selectivity, and MeOH yield calculated as per eqs. (2–4) respectively.
The following results of RSM and OFAT optimization for CO2 hydrogenation to methanol at low- and high-pressure range testing respectively were discussed.
The proposed model should be considered a good starting point for model fitting when identifying the optimal model to employ for the response [22]. Table 2 shows the reduced quadratic models are suggested for all three responses (XCO2, SMeOH, and YMeOH) with p-values < 0.05 indicated the models’ term are significant. The lack of fit (LOF) values of 0.4349 (XCO2), 1.00 (SMeOH), and 1.47 (YMeOH) are not significant which imply that the models are a good representation of the responses. The coefficient of determination (R2) values for XCO2, SMeOH, and YMeOH were 0.9458, 0.8541, and 0.9342 respectively which means the models explain 95%, 84%, and 93% respectively of the observed variances. The remaining % (that are not explained by the model) can be due to random variability (experimental variability) or to an effect that is not considered by the model or a combination of both, which is almost always the case. The values are considered acceptable because they’re not far away from unity indicating how close the chosen models are to the experimental data points. Meanwhile, the adjusted R2 represents the amount of variance around the mean that the model can explain [23]. The predicted R2 values of 0.7649, 0.5728, and 0.6955 for XCO2, SMeOH, and YMeOH are in reasonable agreement with their respective adjusted R2 of 0.8916, 0.7666, and 0.8785 where the difference is <0.2. In addition, adequate precision which measures the signal to noise ratio shows the ratio of greater than 4 at 15.6177, 10.7154, and 15.4175 respectively for each response. These indicate adequate model discrimination.
Analysis of variance (ANOVA) for the process optimization study of CZ(M)A
| Model | XCO2 |
SMeOH |
YMeOH |
|---|---|---|---|
| Standard deviation | 2.67 | 9.20 | 17363.03 |
| R2 | 0.9458 | 0.8541 | 0.9342 |
| Adjusted R2 | 0.8916 | 0.7666 | 0.8785 |
| Predicted R2 | 0.7649 | 0.5728 | 0.6955 |
| Adequate precision | 15.6177 | 10.7154 | 15.4175 |
| p-value | <0.0001 | <0.0001 | <0.0001 |
| F-value | 17.45 | 9.76 | 16.77 |
| LOF | 0.4349 | 1.00 | 1.47 |
Tables 3, 4, and 5 summarize the multiple regression coefficients of a second order polynomial model describing the effect of catalyst CZ(M)A process operating conditions on the values of XCO2, SMeOH, and YMeOH respectively. The F-value and p-value were used to assess the significance of each coefficient. If the p-value is less than 0.05, it is deemed significant.
If the linear term (A, B, C, D) is significant or insignificant, it indicates that there is a significant or insignificant linear relationship between the predictor variable (A, B, C, D) and the response variable (XCO2, SMeOH, and YMeOH). In other words, as the predictor variable changes, the response variable changes in a linear fashion or do not lead to significant changes in the response variable respectively. If the interaction term (AB, AD, BC, CD) is significant or insignificant, it suggests that there is a significant or insignificant interaction effect between the two predictor variables. This means that the relationship between one predictor variable and the response variable depends on the value of the other predictor variable or is consistent across different values of the other predictor variable respectively. If the quadratic term (A2, B2, C2, D2) is significant or insignificant, it indicates that there is a significant or insignificant quadratic relationship between the predictor variable (A, B, C, D) and the response variable. This suggests that the relationship between the predictor variable and the response variable is not linear but instead follows a curved pattern or can be adequately explained by a linear model respectively.
The effects of process operating conditions of the catalyst CZ(M)A on XCO2 are shown in Table 3. The first order effect of A (H2/CO2) and B (temperature) are significant with both p-values <0.0001. However, the first order effect of C (pressure) and D (GHSV) are not significant with p-value of 0.1167 and 0.1165 respectively. The interaction effect of AB is significant while the interaction effect of AD, BC, and CD are not significant where the p-values are >0.0.5. The second order effect of A2 (H2/CO2), B2 (temperature), C2 (pressure) and D2 (GHSV) all are not significant (p>0.05). The coefficient estimate values of the regression model are A = 4.97 (H2/CO2), B = 7.57 (temperature), C = –1.29 (pressure) and D = 1.19 (GHSV). Hence, temperature has the highest effect on the response XCO2, followed by H2/CO2, pressure and GHSV, summarized as B>A>C>D.
Coefficient of regression model and their significance for first response, XCO2
| Source | Coefficient Estimate | F-value | Prob>F | Remark |
|---|---|---|---|---|
| Reduced quadratic model | - | 17.45 | <0.0001 | significant |
| A | 4.97 | 42.46 | <0.0001 | significant |
| B | 7.57 | 98.63 | <0.0001 | significant |
| C | 1.29 | 2.86 | 0.1167 | insignificant |
| D | –1.19 | 2.86 | 0.1165 | insignificant |
| AB | 3.72 | 19.38 | 0.0009 | significant |
| AD | 0.4677 | 0.3510 | 0.5646 | insignificant |
| BC | –1.19 | 1.97 | 0.1860 | insignificant |
| CD | –1.03 | 1.72 | 0.2148 | insignificant |
| A2 | –2.98 | 3.20 | 0.0988 | insignificant |
| B2 | 2.46 | 2.18 | 0.1656 | insignificant |
| C2 | 3.24 | 3.78 | 0.0757 | insignificant |
| D2 | –0.8987 | 0.2906 | 0.5997 | insignificant |
Effects of catalyst CZ(M)A process operating conditions on the second response, SMeOH are shown in Table 4. The first order effect of A (H2/CO2), C (pressure), the interaction between the first order effect of AD, the second order effect of A, B, and D are not significant with p-values >0.05. Furthermore, the first order effect of B (temperature), D (GHSV), the interaction between first order effect of AB is significant with p-values <0.01. The coefficient estimate values of the SMeOH regression model are A = –2.13 (H2/CO2), B = 16.06 (temperature), C = –0.3494 (pressure), and D = –9.56 (GHSV). The highest effect on the SMeOH is the temperature followed by GHSV, H2/CO2, and pressure (B>D>A>C).
Coefficient of regression model and their significance for second response, SMeOH
| Source | Coefficient Estimate | F-value | Prob>F | Remark |
|---|---|---|---|---|
| Reduced quadratic model | - | 9.76 | <0.0001 | significant |
| A | –2.13 | 0.6860 | 0.4205 | insignificant |
| B | 16.06 | 39.08 | <0.0001 | significant |
| C | –0.3494 | 0.0185 | 0.8936 | insignificant |
| D | –9.56 | 15.71 | 0.0012 | significant |
| AB | 7.55 | 7.88 | 0.0133 | significant |
| AD | 2.34 | 0.8100 | 0.3823 | insignificant |
| A2 | –8.40 | 2.33 | 0.1480 | insignificant |
| B2 | 4.24 | 0.5915 | 0.4538 | insignificant |
| D2 | 11.51 | 4.37 | 0.0541 | insignificant |
Table 5 shows the effect of process operating conditions on YMeOH. The first order effect of A (H2/CO2), B (temperature), interaction effect in between A and B, B and D are all significant with p-values of <0.05. Meanwhile, the first order effect of C (pressure), D (GHSV), interaction effect in between A and D, B and C, and the second order effect of A, B and D are not significant with p-value >0.05. The coefficient estimate values of the regression model are A = –19225.97 (H2/CO2), B = 41975.97 (temperature), C = 4162.92 (pressure) and D = –15022.24 (GHSV). According to the corresponding p-value, the first order effect of C is the least significant among the variables studied because it has the lowest coefficient estimate. Thus, temperature has the greatest influence on the response YMeOH, followed by H2/CO2, GHSV and pressure (B>A>D>C).
Coefficient of regression model and their significance for third response, YMeOH
| Source | Coefficient Estimate | F-value | Prob>F | Remark |
|---|---|---|---|---|
| Reduced quadratic model | - | 16.77 | <0.0001 | significant |
| A | 19225.97 | 15.01 | 0.0019 | significant |
| B | 41975.97 | 71.56 | <0.0001 | significant |
| C | 4162.92 | 0.7038 | 0.4167 | insignificant |
| D | –15022.24 | 10.78 | 0.0059 | insignificant |
| AB | 22250.60 | 16.41 | 0.0014 | significant |
| AD | –9320.17 | 3.29 | 0.0929 | insignificant |
| BC | 3186.90 | 0.3367 | 0.5717 | insignificant |
| BD | –14782.87 | 8.27 | 0.0130 | significant |
| A2 | –13103.51 | 1.58 | 0.2308 | insignificant |
| B2 | 22046.49 | 4.47 | 0.0543 | insignificant |
| D2 | 13496.49 | 1.68 | 0.2179 | insignificant |
The responses variables of the design experiment were modeled using the polynomial eq. (5) (CO2 conversion), eq. (6) (MeOH selectivity) and eq. (7) (MeOH yield).
(5)
(6)
(7)
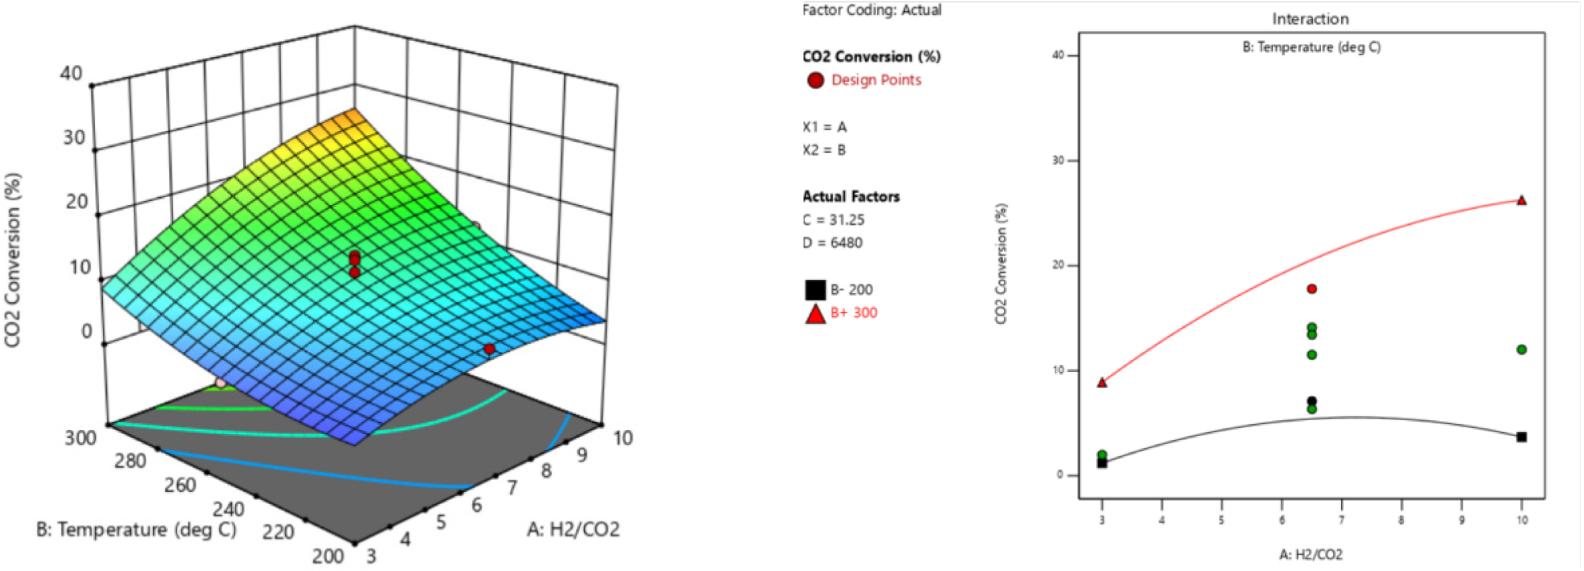
The 3-D curvatures and its respective interaction plots for the optimum responses and the relationship between significant model terms are graphically illustrated in Figure 2 – Figure 4. Since the model of each response is reduced quadratic model, some of the interaction effects of the variables were removed to improve the model. Figure 2 shows the interaction effect of AB on CO2 conversion. When the temperature (B) increased from 200 °C to 300 °C, and the H2/CO2 (A) increased from 3 to 10, XCO2 was increased. Interaction effect of AB on MeOH selectivity (SMeOH) are depicted in Figure 3. When the temperature (B) is at low level of 200 °C, and H2/CO2 (A) increased from 3 – 10, the SMeOH significantly decreased. Nevertheless, when the temperature (B) is at higher level of 300 °C, increasing H2/CO2 shows slight increase in SMeOH.
Interaction effect of AB on CO2 conversion (XCO2)
Interaction effect of AB on MeOH selectivity (SMeOH)
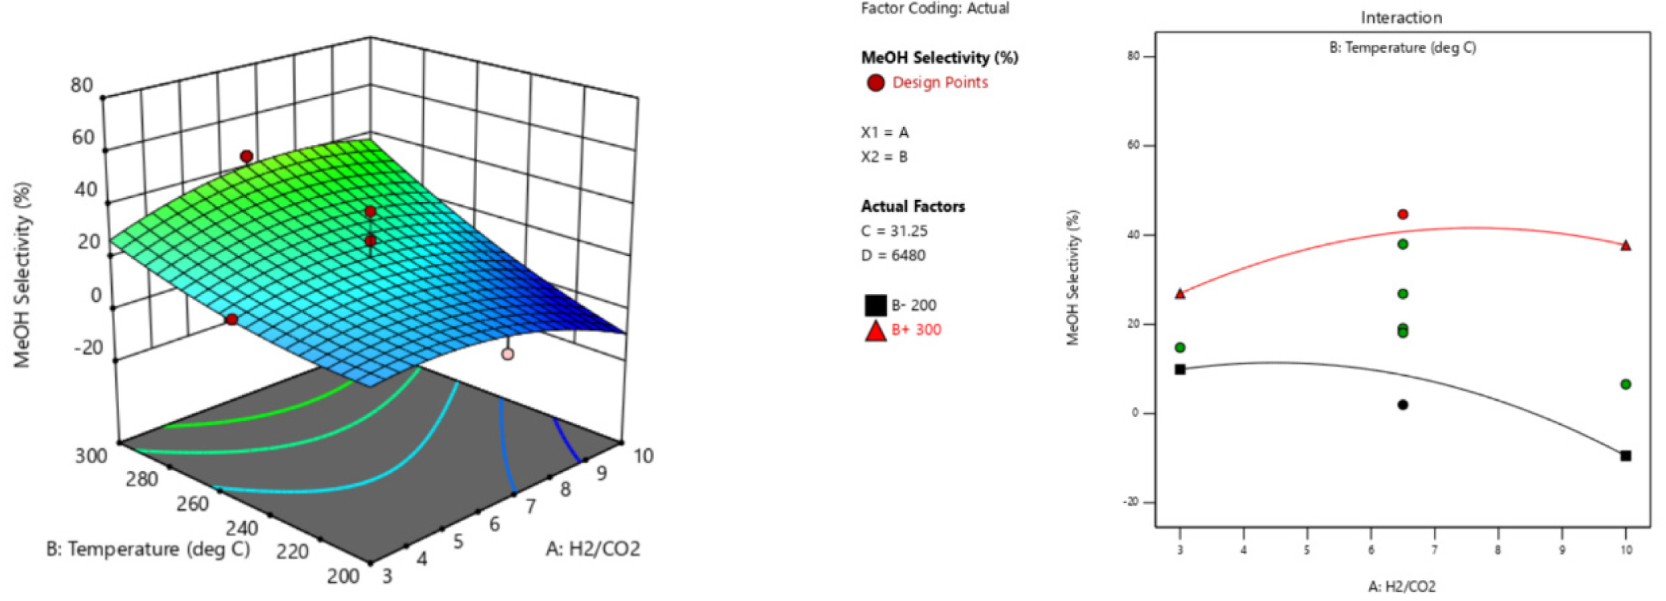
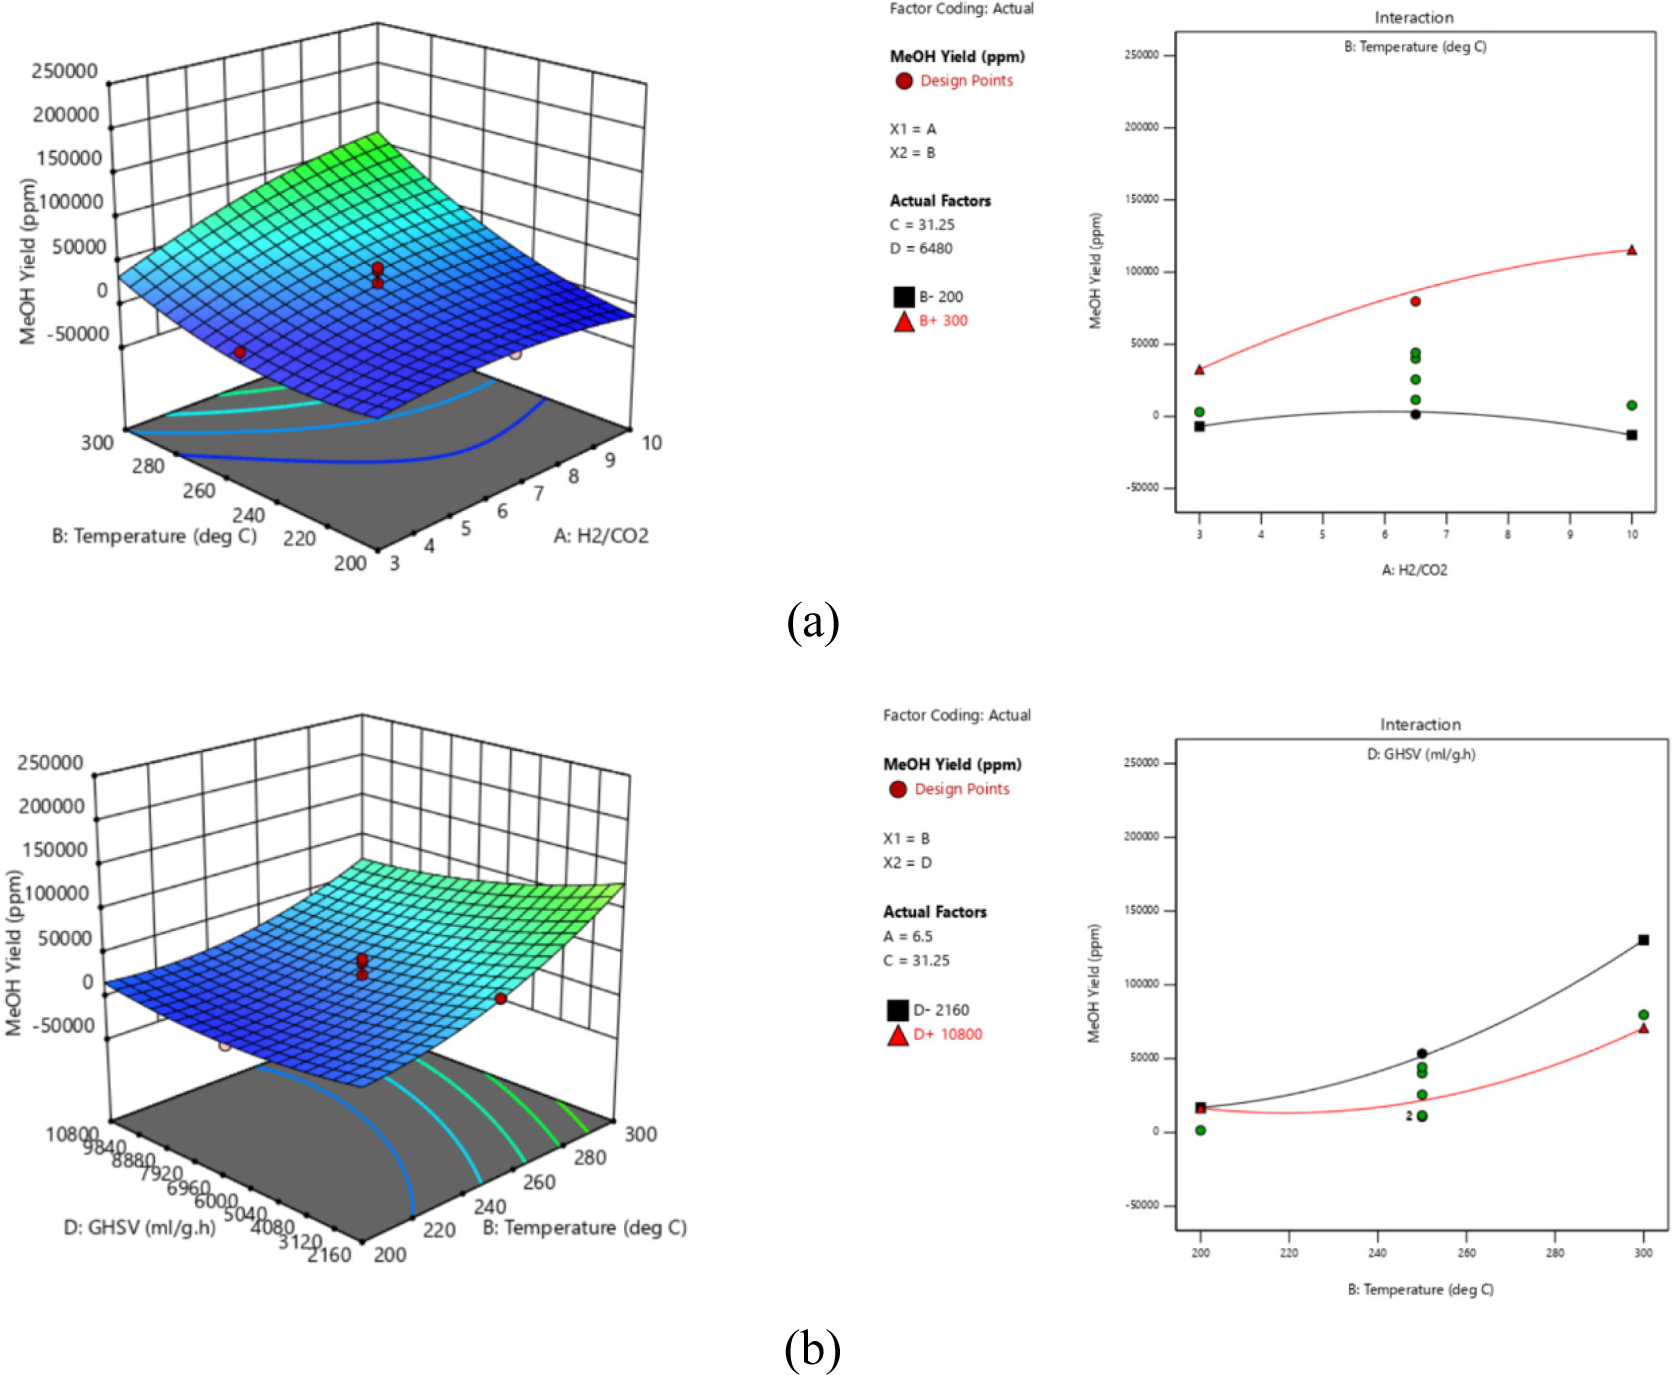
Figure 4a and Figure 4b show the interaction effect of AB and BD on MeOH yield (YMeOH). AB has significant influence on YMeOH which is similar trend as XCO2 and SMeOH. The interaction effect in between temperature (B) and GHSV (D) to YMeOH is also significant.
When B is at low level of 200 °C and decreasing GHSV (D) from 10,800 mL/g h to 2160 mL/g h shows an increase by 2.8% (16448.8 ppm to 16928 ppm) in YMeOH. However, an increase by 46% (70835.4 ppm to 130445 ppm) was observed when the temperature is at high level of 300 °C and GHSV was decreased from 10,800 mL/g h to 2160 mL/g h. The higher the temperature and the lower the GHSV, has increased MeOH yield by 94%.
Interaction effect of (a) AB; and (b) BD on MeOH yield
The optimum process operating conditions for catalytic activity of the synthesized CZ(M)A catalyst are summarized in Table 6. Based on the optimum conditions, the XCO2, SMeOH and YMeOH were calculated using eqs. (5–7). Three confirmation runs were carried out under the same experimental technique. The calculated and experimental values of XCO2 were 28.6% and 30.7% respectively, and 59.2% and 66.3% for SMeOH. While for YMeOH, 164,000 ppm and 202,000 ppm respectively. The percentage errors between the calculated and experimental values are 7.34% (XCO2), 12.0% (SMeOH) and 23.2% (YMeOH) which are not within the acceptable range of deviation of 5%. This observation in measured responses could be due to heterogeneity of Cu active sites at atomic scale. Methanol synthesis is a structure sensitive reaction, thus even small variation on distribution of Cu active sites and proportion of low-coordinated surface atoms at atomic scale could lead to significant change in catalytic activity and product selectivity.
Optimum process operating conditions for synthesized catalyst CZ(M)A
| Variables | Units | Optimum conditions |
|---|---|---|
| H2/CO2 (A) | - | 10 |
| Temperature (B) | °C | 300 |
| Pressure (C) | bar | 31 |
| GHSV (D) | mL/g h | 2160 |
| XCO2, calculated | % | 28.6 |
| XCO2, experimental | % | 30.7 |
| Percentage error, XCO2 | % | 7.34 |
| SMeOH, calculated | % | 59.2 |
| SMeOH, experimental | % | 66.3 |
| Percentage error, SMeOH | % | 12.0 |
| YMeOH, calculated | ppm | 164,000 |
| YMeOH, experimental | ppm | 202,000 |
| Percentage error, YMeOH | % | 23.2 |
Le Chatelier’s principle indicates that a system at equilibrium will adjust to stress, hence at equilibrium, CO2 conversion and selectivity to methanol rise with pressure, while CO selectivity declines. The effect of high reaction pressure of 40 - 80 bar on the performance of the CZ(M)A catalyst in CO2 hydrogenation to methanol was evaluated. The evaluation was carried out in a reactor volume five times bigger than microactivity fixed-bed reactor for low pressure testing in which this reactor can only run at maximum pressure of 40 bar. Meanwhile, the H2/CO2, temperature, and GHSV were kept constant using the optimum value from low pressure testing at 10:1, 300 °C, and 2160 mL/g h, respectively.
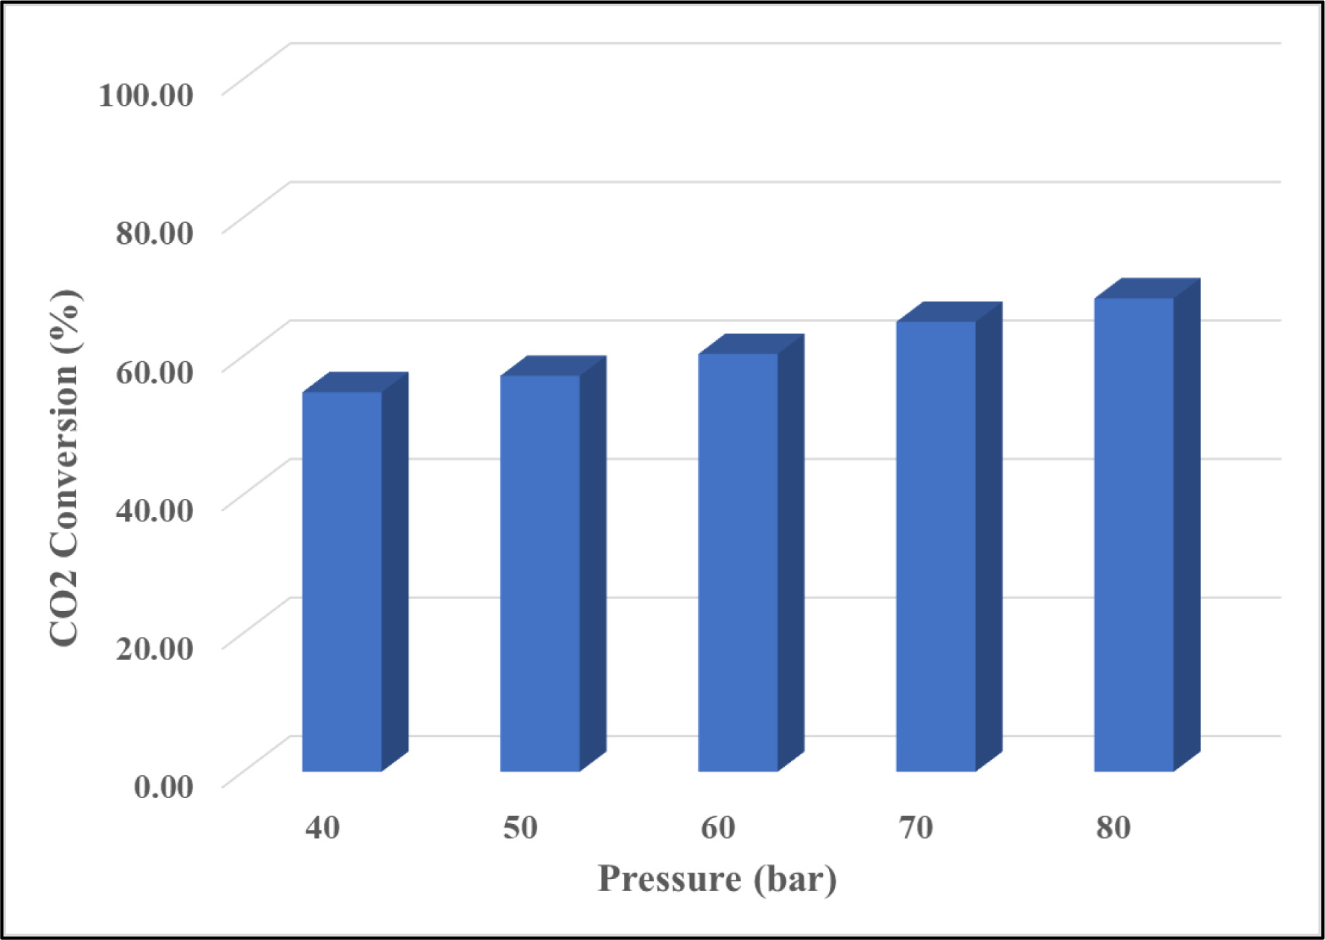
The catalytic performance in terms of CO2 conversion is shown in Figure 5. The result showed that reaction pressure has a considerable impact on CO2 conversion, with conversion increasing from 54.80% to 68.35% as reaction pressure was increased from 40 bar to 80 bar. Under a kinetic-controlled regime, increasing the reaction pressure could boost CO2 conversion by increasing CO2 and hydrogen adsorption on the catalyst [24].
Effect of high reaction pressure of CZ(M)A catalyst on CO2 conversion
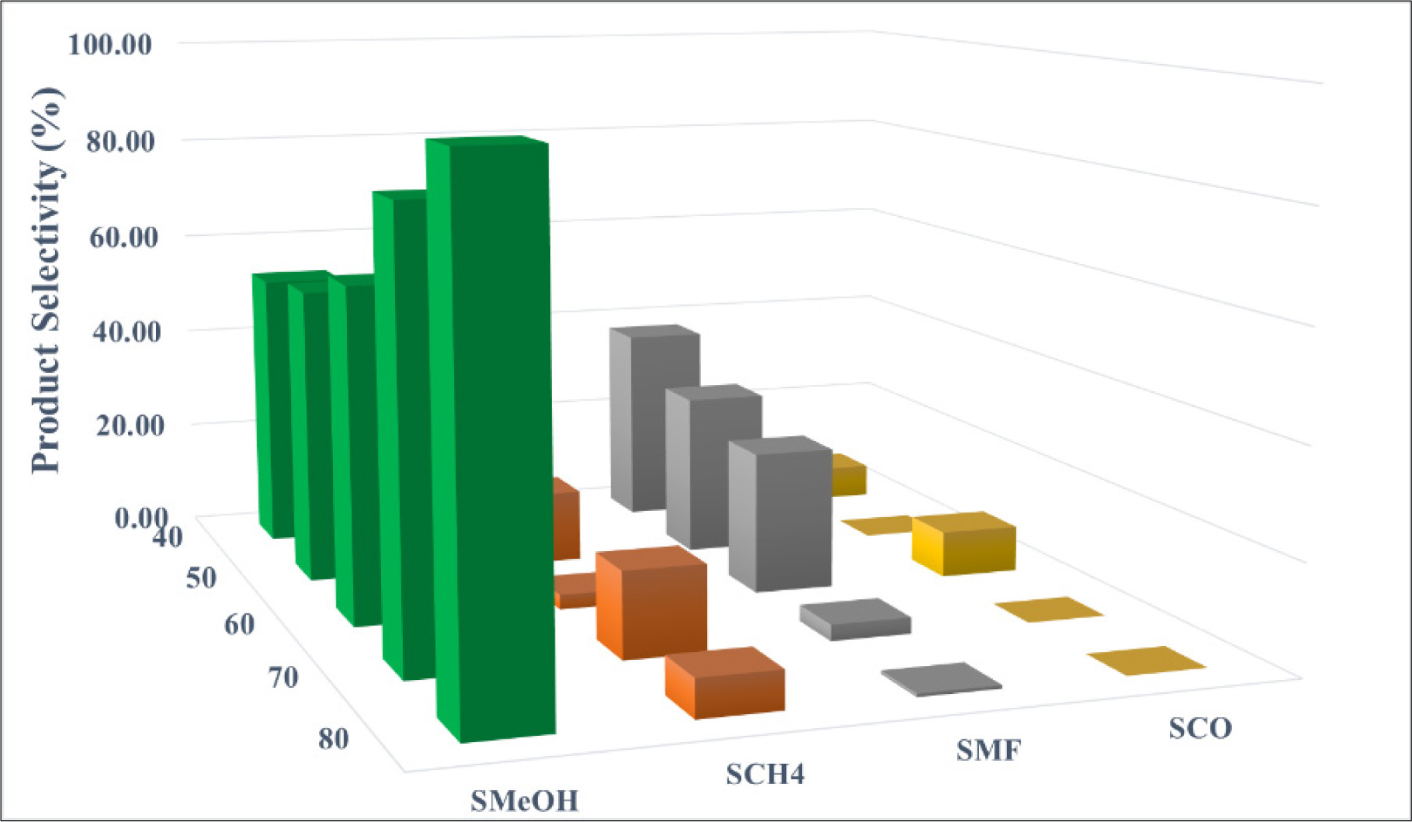
CO production by the RWGS is pressure independent from a thermodynamic aspect [25]. The methanol synthesis from CO2 hydrogenation, on the other hand, is pressure sensitive due to the reduction of 4 moles of reactants to 2 moles of products during the reaction. This is consistent with Le Chatelier’s principle. According to the findings in Figure 6, the methanol selectivity increased progressively from 53% to 62% as the reaction pressure increased from 40 to 60 bar. When the reaction pressure was increased from 60 to 80 bar, the selectivity increased dramatically from 62% to 93%. At the greatest reaction pressure, neither CO or methyl formate is formed. Based on the findings, it can be concluded that increasing reaction pressure has a positive effect on methanol production rate by improving CO2 conversion and, to a lesser extent, increasing methanol selectivity. The highest catalytic performance was achieved at 80 bar with CO2 conversion of 68.35%, MeOH selectivity of 93%, and MeOH yield of 63.57%.
Effect of high reaction pressure of CZ(M)A catalyst on product selectivity
The main objective of this research was to identify an alternative method that is both efficient in terms of time and cost, in order to enhance the production of methanol. RSM has become a crucial tool in scientific-analytical research. RSM and OFAT, when used together, showed to be a valuable combo for providing reliable outcomes.
The optimized process operating conditions at low pressure range testing for the synthesized CZ(M)A catalyst for methanol synthesis via CO2 hydrogenation has been investigated using RSM. Reduced quadratic model was proposed to correlate the experimental variables for all three responses (XCO2, SMeOH, and YMeOH). Empirical model equations are developed for CO2 conversion (XCO2), MeOH selectivity (SMeOH) and MeOH yield (YMeOH). The optimized conditions were at H2/CO2 ratio of 10, temperature 300 °C, pressure 31 bar and GHSV 2160 mL/g h. The catalyst was then subjected to high pressure range testing (40 – 80 bar) using OFAT with the optimum H2/CO2, temperature, and GHSV from low pressure range testing using. CO2 conversion and MeOH selectivity increased when reaction pressure increased. No CO or methyl formate formed at reaction pressure of 80 bar with CO2 conversion of 68.35%, MeOH selectivity of 93%, and MeOH yield of 63.57%.
The combination of RSM and OFAT methods allows for a comprehensive understanding of the factors influencing process performance, optimization of process conditions, validation of optimization results, and insights for further improvement. This integrated approach helps us make informed decisions and achieve desired outcomes in process optimization and improvement efforts.
The authors acknowledge the financial support provided by PETRONAS Research Sdn.Bhd. and Universiti Teknologi PETRONAS (UTP).
| CZ(M)A | Cu/ZnO/ GVII/GV/GIV/Al2O3 |
| GHSV | Gas hourly space velocity |
| GVII | Group VII |
| GV | Group V |
| GIV | Group IV |
| MeOH | Methanol |
| RWGS | Reverse Water Gas Shift |
- Power to Liquid and Power to Gas: An Option for the German Energiewende, Renew. Sustain, 2015,
- Current Status and Future Projections of LNG Demand and Supplies: A Global Prospective, 2011,
- Optimization Through Response Surface Methodology of a Reactor Producing Methanol by the Hydrogenation of Carbon Dioxide, 2017,
- ,
Clean Energy Technology Approaches of Mitigating Greenhouse Gases, in: Chemical Engineering Transactions ,Italian Association of Chemical Engineering - AIDIC ,pp 607–612 , 2010 - Catalytic Carbon Dioxide Hydrogenation to Methanol: A Review of Recent Studies, 2014,
- A Cu/Zn/Al/Zr Fibrous Catalyst That is an Improved CO2 Hydrogenation to Methanol Catalyst, 2007,
- Carbon Dioxide Recycling: Emerging Large-Scale Technologies with Industrial Potential, 2011,
- Optimization of Operating Conditions for CO Hydrogenation to Hydrocarbon via Response Surface Method, 2021,
- Design and Simulation of a Methanol Production Plant from CO2 Hydrogenation, 2013,
- Methanol Synthesis from Flue-Gas CO2 and Renewable Electricity: A Feasibility Study, 2003,
- Processes for the Synthesis of Liquid Fuels from CO2 and Marine Energy, 2006,
- CO2 to Green Fuel: Photocatalytic Process Optimization Study, 2021,
- Catalytic Synthesis of Methanol from COH2: IV. The Effects of Carbon Dioxide, 1982,
- Thermodynamics and Kinetics of Low Pressure Methanol Synthesis, 1995,
- Simulation of CO2 Capture using MEA Scrubbing: A Flowsheet Decomposition Method, 2005,
- Methanol Production from CO2 using Solar-Thermal Energy: Process Development and Techno-Economic Analysis, 2011,
- Design and Optimization of CO2 Hydrogenation Multibed Reactors, 2022,
- Effect of Operating Conditions and Effectiveness Factor on Hydrogenation of CO2 to Hydrocarbons, 2019,
- Optimization of Methanol Synthesis from Carbon Dioxide and Hydrogen: Demonstration of a Pilot-Scale Carbon-Neutral Synthetic Fuels Process, 2009,
- Techno-Economic and Climate Impact Analysis of Carbon Utilization Process for Methanol Production from Blast Furnace Gas Over Cu/ZnO/Al2O3 Catalyst, 2020,
- Combination of Classical and Statistical Approaches to Enhance the Fermentation Conditions and Increase the Yield of Lipopeptide(s) by Pseudomonas sp. OXDC12: Its Partial Purification and Determining Antifungal Property, 2021,
- , Stat-Ease Handbook for Experimenters, 2017
- Optimization of progressive freezing for residual oil recovery from a palm oil-water mixture (POME model), 2021,
- Kinetics of methanol synthesis from carbon dioxide hydrogenation over copper-zinc oxide catalysts, 2017,
- Mechanism, kinetics and thermodynamics of carbon dioxide hydrogenation to methanol on Cu/ZnAl2O4 spinel-type heterogeneous catalysts, 2017,


