


The wind energy sector has experienced notable growth in recent years as a promising way to reach carbon neutrality. In recent years, new wind power capacity has been installed in record-breaking numbers, with 267 GW installed in 2020, 2021 and 2022 [1]. The industry is expected to develop further with the advent of offshore wind, which capitalizes on more abundant wind resources and vast available areas [2]. Offshore, wind turbines can be mounted on seabed-fixed platforms, including monopiles and jacket-frame substructures [3]. Floating offshore wind is a nascent technology, with concepts such as the spar-buoy [4]. Offshore wind can spur other innovative technologies, e.g., hydrogen production [5]. This can be used, for instance, for mobility applications [6]. Another interesting opportunity is co-located exploitation [7]. This has been studied, for example, for different solutions for wind-solar [8], which shows great potential. Co-located wind-wave offshore energy farms have only been studied in detail [9]. Notwithstanding its critical role in the mitigation of climate change through the reduction of total greenhouse gas (GHG) emissions, wind energy production is highly dependent on the resources, i.e., on the climate itself, and therefore stands to be affected by climate change. This feedback loop has been termed the wind energy paradox [10].
Climate change influences the wind industry in different ways, causing alterations in both the availability of energy from wind farms and its consumption [11]. In the case of wind energy, available wind resources depend on atmospheric patterns, which are influenced by climate change [10]. In this sense, evaluating climate-change impacts on the available wind resources is imperative.
Notably, wind resources stand out as the factor with the largest influence on the cost-effectiveness of a wind project [12]. Hence, wind resources play a pivotal role in the assessment of potential zones for new installations [13]. It has been reported that minor changes to the production of energy may lead to substantial impacts on the levelized cost of energy (LCOE) [14]. Evolving global temperatures cause alterations to weather patterns and, consequently, to available wind resources and turbine operating conditions [15]. Since wind power density varies with the cube of wind speed, minor variations in wind conditions may have amplified effects on wind resources. As a result, climate change may imperil or, in certain areas, benefit wind energy exploitation [16]. A thorough knowledge of the evolution of wind resources is key to evaluating new wind energy initiatives, managing existing ones and evaluating the rôle of wind energy in the overall energy mix [17]– hence the motivation of this study.
Initial works on the repercussions of climate change on wind resources, based on scenarios A2 and B of the Intergovernmental Panel on Climate Change (IPCC), focused on Europe [18]. Based on similar scenarios, a study also was conducted in Northern Europe [19]. Subsequent evaluations utilised variations of the same scenarios globally [20]. Similar methods were employed in another study for the US [21]. More recently, Global Climate Models (GCMs) developed within the framework of the Coupled Model Intercomparison Project Phase 5 (CMIP5) were employed to ascertain the consequences of climate change on the wind climate of North America [22]. With the same scenarios, the evolution of wind resources was studied in Europe [23]. Additionally, the evolution of the energy output of wind turbines was studied in Europe [24]. These models employed the Representative Concentration Pathways [25] climate scenarios. In North America, changes of small magnitude to wind resources were identified in areas of the central US. In Europe, similar results were obtained for the Baltic countries by the two models, but different results for Central Europe.
Recently, the latest phase, CMIP6, released the outputs of a large number of its activities [26]. Within these activities, the ScenarioMIP considers the latest climate scenarios to produce climate projections, including wind climate. These scenarios are the Shared Socioeconomic Pathways (SSPs), which take into account, for the first time, social changes and land use [27]. Projections from the models participating in the ScenarioMIP were used to ascertain changes in the available wind resources in a number of places, with significant results. In China [28], wind resources were predicted to decrease in most parts. However, in offshore regions, small changes were projected in [29]. Substantial, concentrated increases were predicted in Australasia [34]. Important increases in mean and maximum wind speeds were also reported in the Northwest Passage [33]. Regional studies in Europe, nonetheless, have predicted an opposite trend. In a study in the UK [30], monthly wind speeds were predicted to decrease by 2050. In Northern Europe, reduced wind power density is projected regardless of the scenario [31]. Finally, in the offshore Atlantic European regions, mean resources are expected to drop while extreme conditions are projected to intensify [32].
This study delves into the trends of wind resources in the two largest wind energy markets of the Western world, i.e., North America and Europe, under the effects of climate change. Projections on the future wind climate using the latest climate scenarios, the SSPs, are studied and compared in the two continents to evaluate trends in the long-term future. By studying the future available wind energy, it can be determined whether territories with an established wind industry might experience a reduction in the available resources or, conversely, regions with no previous wind exploitations may become viable.
Projections on daily, near-surface wind speed sourced from the ScenarioMIP activity are employed. These projections consider the Shared Socioeconomic Pathways, which consist of a set of scenarios created to explore possible future trajectories of global societal development, including different levels of economic growth, social and technological changes and GHG emissions [27]. These pathways are used by the CMIP6 as a framework to develop climate projections.
Among all the SSPs, each representing a distinct storyline of how the world may evolve, two scenarios are highlighted in the activities of the CMIP6, and, therefore, considered in this work: SSP2-4.5 and SSP5-8.5. The former, SSP2-4.5, is a middle-of-the-road scenario, in which global challenges, including climate change, are addressed insufficiently, with uneven economic growth, leading to a radiative forcing of 4.5 W/m2 at the end of the 21st century. The latter, SSP5-8.5, is a scenario with a strong focus on rapid economic growth based on intensive consumption of fossil fuels, in which climate conservation has a very low priority, resulting in augmented GHG emissions leading to a radiative forcing of 8.5 W/m2 in 2100.
All the GCMs from the CMIP6 with openly available projections on daily-averaged, near-surface wind speeds are taken into account in this work (listed in [34]).
Two regions are considered: Europe and North America. In the following, the GCMs are validated in the two regions separately, and the models that best represent historical data on the wind climate are chosen to build a multi-model ensemble (MME). With this approach, the uncertainties of each model are greatly attenuated, which may be expected to result in more accurate results [35].
In the formal study, projections on wind speeds from the models are weighted against past data belonging to the same models in order to evaluate future changes. As a result, assessing distributional differences of the GCMs is of much more relevance than distributional biases. In this work, the performance of a GCM in the region of study is assessed using the Kolmogorov-Smirnov test (K-S test) – which is applied to ascertain whether two series come from the same distribution [36].
First, since the models provide data with different spatial resolutions, these are mapped into a common grid. In order to preserve the flux integrals, a first-order conservative remapping is the choice [37]. The destination grid is chosen to have a 1.5° × 1.5° (latitude × longitude) resolution, based on the spatial resolution of the models. Second, given the great difference in latitudes between the areas included in the work, the seasonal bias of the models is eliminated – with this step, the K-S test can better evaluate statistical differences [36].
Data on historical (2005-2014) daily-averaged wind speeds from the models are thus compared to their remapped counterparts sourced from the ERA-5 reanalysis data. The Kolmogorov-Smirnov test is applied to the remapped, unbiased GCMs and the remapped, unbiased ERA-5 data. The performance of the GCMs in North America and Europe is measured based on the percentage of mesh points which are deemed to belong to the same distribution as their ERA-5 counterparts (Table 1 and Table 2, respectively) [23].
North America: Percentage of mesh points of individual GCMs that are statistically similar, according to the K-S test, to the ERA-5 reanalysis [38]
| GCM | Reference | Percentage |
|---|---|---|
| NorESM2-MM | [39] | 66% |
| CESM2-WACCM | [40] | 64% |
| EC-Earth3 | [41] | 64% |
| GFDL-ESM4 | [42] | 62% |
| GFDL-CM4 | [43] | 61% |
| ACCESS-CM2 | [44] | 59% |
| IPSL-CM6A-LR | [45] | 57% |
| FGOALS-f3-L | [46] | 56% |
| MPI-ESM1-2-HR | [47] | 55% |
| AWI-CM-1-1-MR | [48] | 55% |
| CanESM5 | [49] | 53% |
| BCC-CSM2-MR | [50] | 51% |
| KACE-1-0-G | [51] | 48% |
| MPI-ESM1-2-LR | [52], [53] | 47% |
| MRI-ESM2-0 | [54] | 47% |
| MIROC6 | [55] | 46% |
| INM-CM5-0 | [56], [57] | 39% |
| INM-CM4-8 | [58], [58] | 39% |
Europe: Percentage of mesh points of individual GCMs that are statistically similar, according to the K-S test, to the ERA-5 reanalysis [59]
| GCM | Percentage |
|---|---|
| EC-Earth3 | 67% |
| GFDL-CM4 | 67% |
| NorESM2-MM | 66% |
| CESM2-WACCM | 64% |
| GFDL-ESM4 | 62% |
| IPSL-CM6A-LR | 58% |
| FGOALS-f3-L | 56% |
| ACCESS-CM2 | 52% |
| MPI-ESM1-2-HR | 50% |
| CanESM5 | 50% |
| AWI-CM-1-1-MR | 50% |
| BCC-CSM2-MR | 47% |
| MIROC6 | 45% |
| MPI-ESM1-2-LR | 44% |
| INM-CM4-8 | 44% |
| MRI-ESM2-0 | 43% |
| INM-CM5-0 | 43% |
| KACE-1-0-G | 39% |
With the validation performed in Tables 1 and 2, the models that scored the best following the criteria of the validation in the separate two regions are chosen to build the multi-model ensemble. The top five models in each region are selected, and the MME is constructed with an unweighted approach [35]. It is noteworthy that the same five GCMs were selected for the two regions: NorESM2-MM, GFDL-ESM4, GFDL-CM4, EC-Earth3 and CESM2-WACCM.
The wind power density (P), which is used hereinafter to quantify the available wind resources, is obtained following:
(1)
In eq. (1), ρ represents the air density (1.225 kg/m3) and U the wind speed. Hence, daily values of wind power density are calculated at each grid point with data on daily wind speeds sourced from the GCMs.
The MME is thus constructed with the above-mentioned five models. Mean values of wind power density are calculated for the period from 2091 to 2100 (long term) from the daily-averaged wind power density at each grid point. Subsequently, these values are compared with their historical (2005-2014) counterparts to assess changes in future wind resources.
Following the above-mentioned methods, the long-term projections obtained with the MME are weighted with past-present wind resources of the same MME to determine the trends of the future wind climate – the mean wind power density is studied, along with the intra-annual variability.
In North America, the historical onshore and offshore wind resources show great differences (Figure 1). Offshore, regions north to the 40th parallel show exhibit the greatest wind resources (600 W/m2). In stark contrast, the mean wind power density in continental regions does not exceed 250 W/m2.
Climate change effects on wind power density in North America. Historical (2005-2014) and long-term (2091-2100) changes according to wind projections following the intermediate scenario (SSP2-4.5) and the augmented emissions scenario (SSP5-8.5)
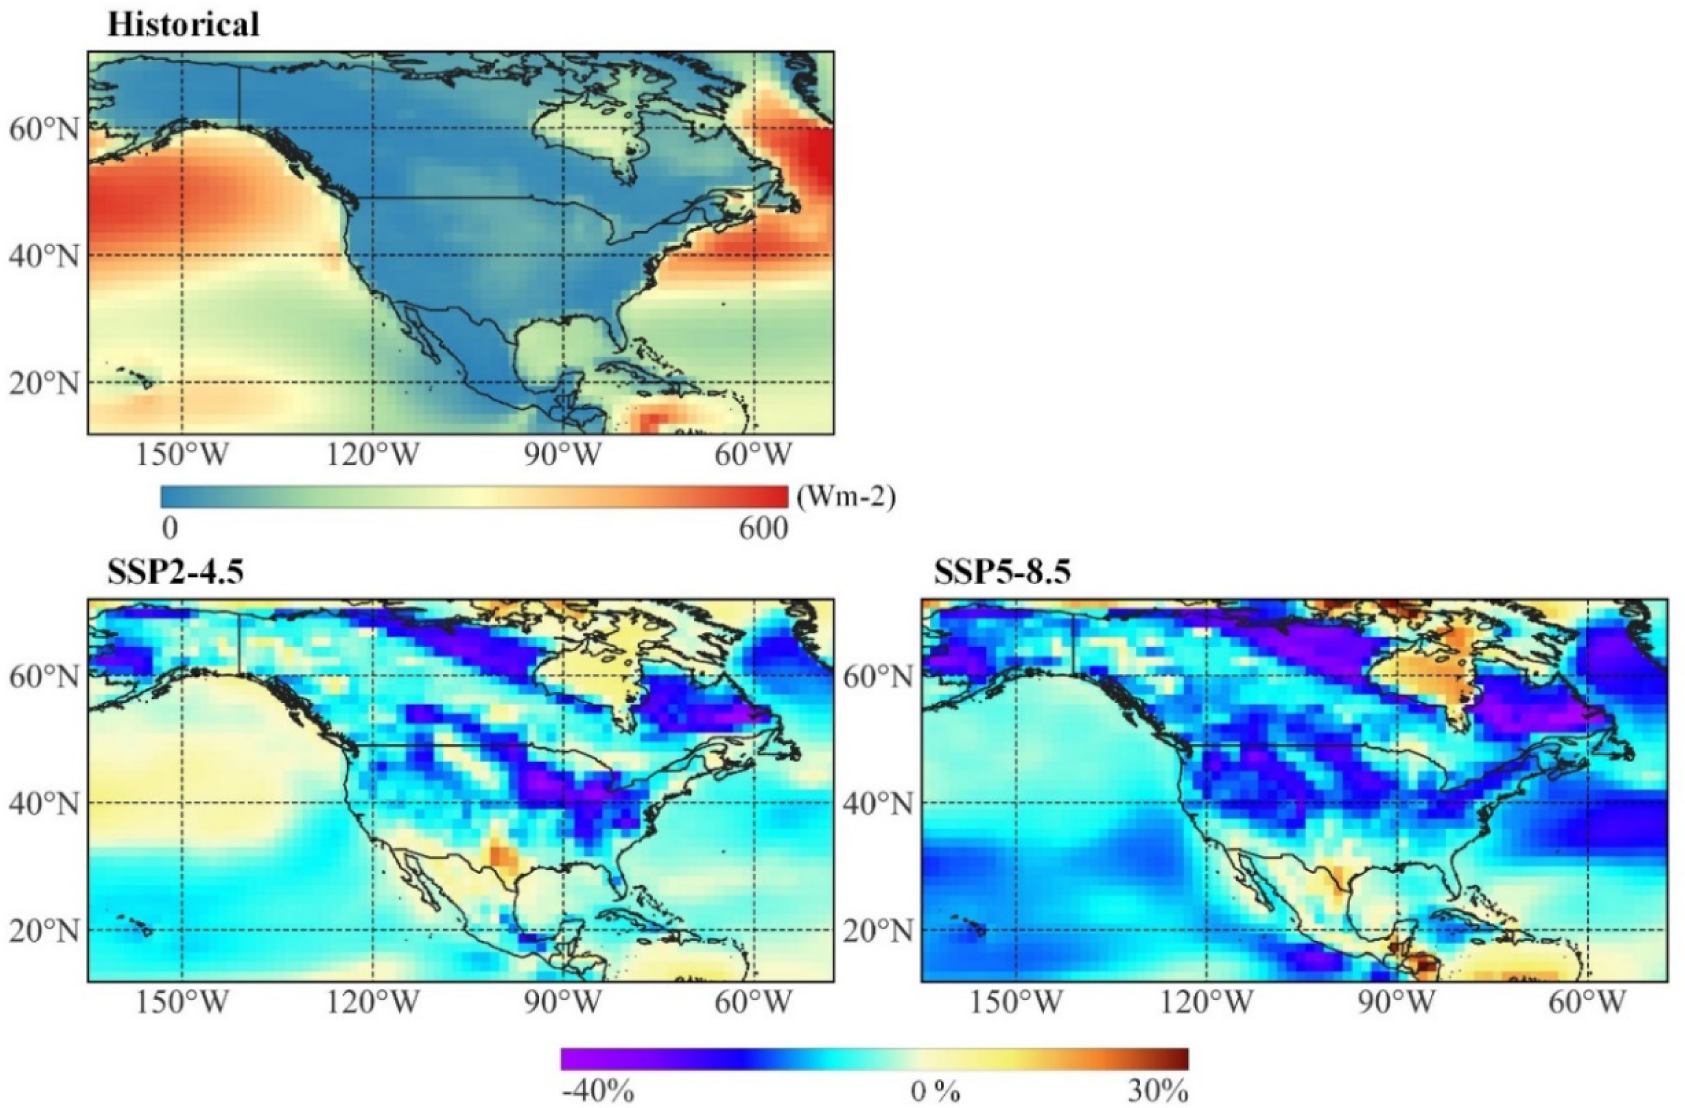
Notably, projections anticipate significant evolution in mean wind power density (Figure 1) – reaching declines of 40% and increases of 30%. The most substantial changes are associated with augmented emissions, i.e., SSP5-8.5, where a general reduction of approx. 15% in wind power density is predicted across the North American continent. The greatest drops in this scenario, however, are predicted in specific regions of Canada (in the provinces of Quebec and Nunavut) and the US (in Alaska). There are some regional exceptions to this decreasing trend, with growth in certain areas: parts of northeastern Mexico and Texas (over 10%), Hudson Bay (~20%) and parts of Central America (Belize, Guatemala and Honduras, ~30%).
In SSP2-4.5 (Figure 1), a general decrease in wind resources is also anticipated, albeit less pronounced than in SSP5-8.5. South of the Great Lakes is an area with a particularly strong decrease. In this scenario the main regional exception to the general decrease, where growth is anticipated, is Texas – again, less pronounced than in SSP5-8.5. Interestingly, the few other areas with increasing resources in SSP5-8.5 exhibit very muted growth (Hudson Bay) or no growth (Belize, Honduras) in SSP2-4.5.
In Europe, the greatest values of historical mean wind power density occur offshore around the 55th parallel, off west Ireland and south of Iceland (>700 W/m2), as a result of the prevailing westerlies (Figure 2) [14]. Onshore and in the Mediterranean Sea, values rarely surpass 250 W/m2.
Climate change effects on wind power density in Europe. Historical (2005-2014) and long-term (2091-2100) changes in the intermediate scenario (SSP2-4.5) and the augmented emissions scenario (SSP5-8.5)
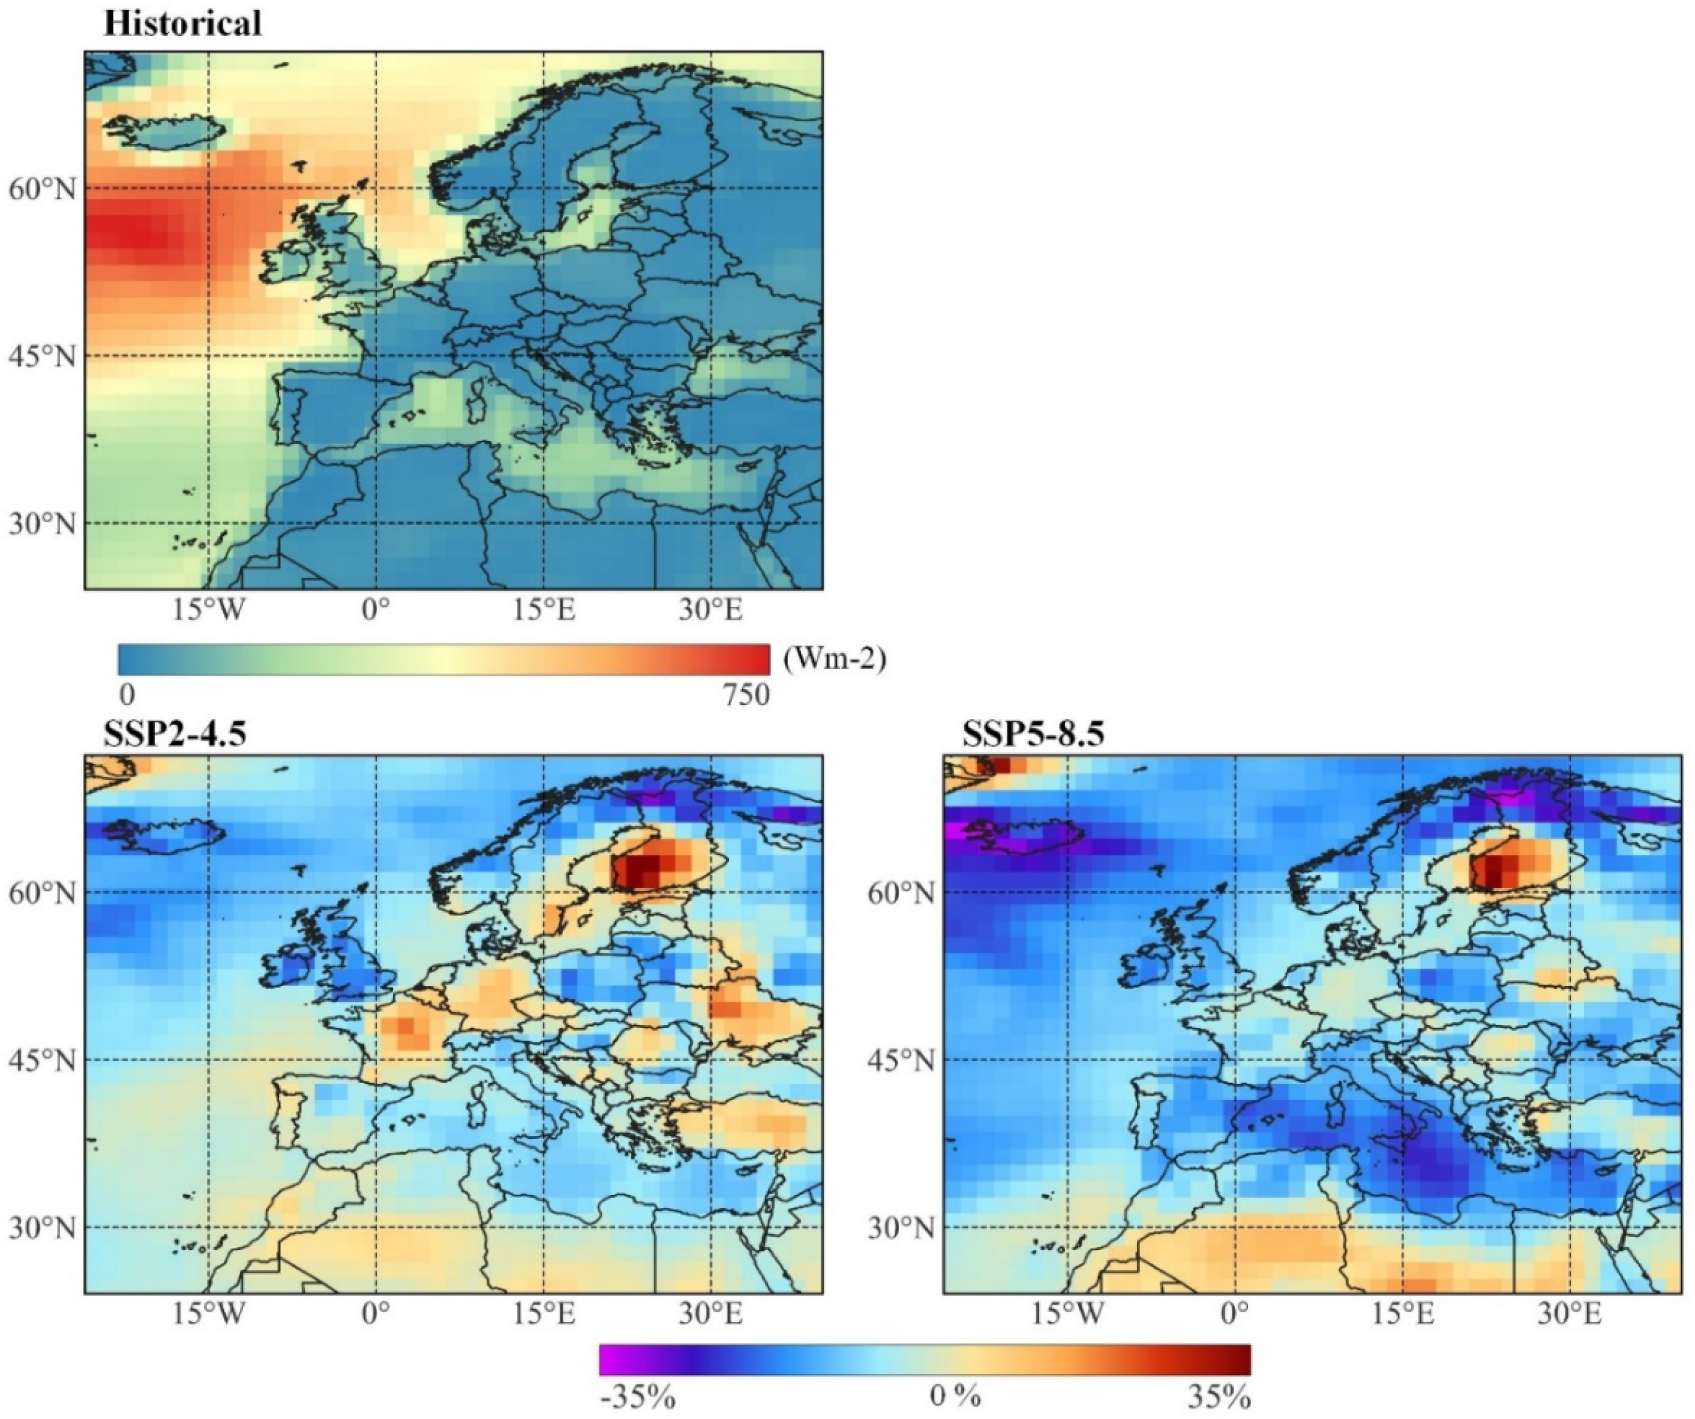
Remarkably, the projections in the high-emissions scenario (Figure 2) include a substantial drop in average wind power densities (approximately 15%) over Europe. The most substantial reductions (between 20% and 35%) are predicted in Ireland, Great Britain, Northern Scandinavia and Lapland. In addition, a focus of significant decreases (up to 25%) is found in the Mediterranean Sea and, in particular, in its central regions, including the Ionian Sea [60]. By contrast, substantial growth is anticipated in SW Finland (30-35%).
In SSP2-4.5, spatial variations are more marked (Figure 2). A significant drop in wind energy (10-30%) is anticipated in Ireland, Great Britain, Northern Scandinavia and Lapland, and a substantial increase in SW Finland – similar to, albeit less pronounced, SSP5-8.5. The discrepancies arise in Central and Western Europe, mainly in Germany and France: SSP2-4.5 anticipates slight rises in wind resources (15%), whereas SSP5-8.5 predicts slight reductions. It is interesting to note that previous works have reported significantly different trends in wind resources in these areas depending on the climate-change scenario considered [61], which may indicate a particular sensitivity to the scenarios [23].
Importantly, the results highlight that models based on the latest climate scenarios anticipate bigger changes than models participating in previous phases of the CMIP [38]. In North America [62], only slight changes (~5%) were anticipated in the US, and no significant effects [22]. In another study in the USA [63], a widespread decrease in wind speeds of 5% was predicted in the East Coast, while small increases were anticipated in the central regions of the West Coast. In Europe [59], changes anticipated by the GCMs in the CMIP5 [23], the previous phase of the CMIP, are also of lesser magnitude than those depicted in Figure 2.
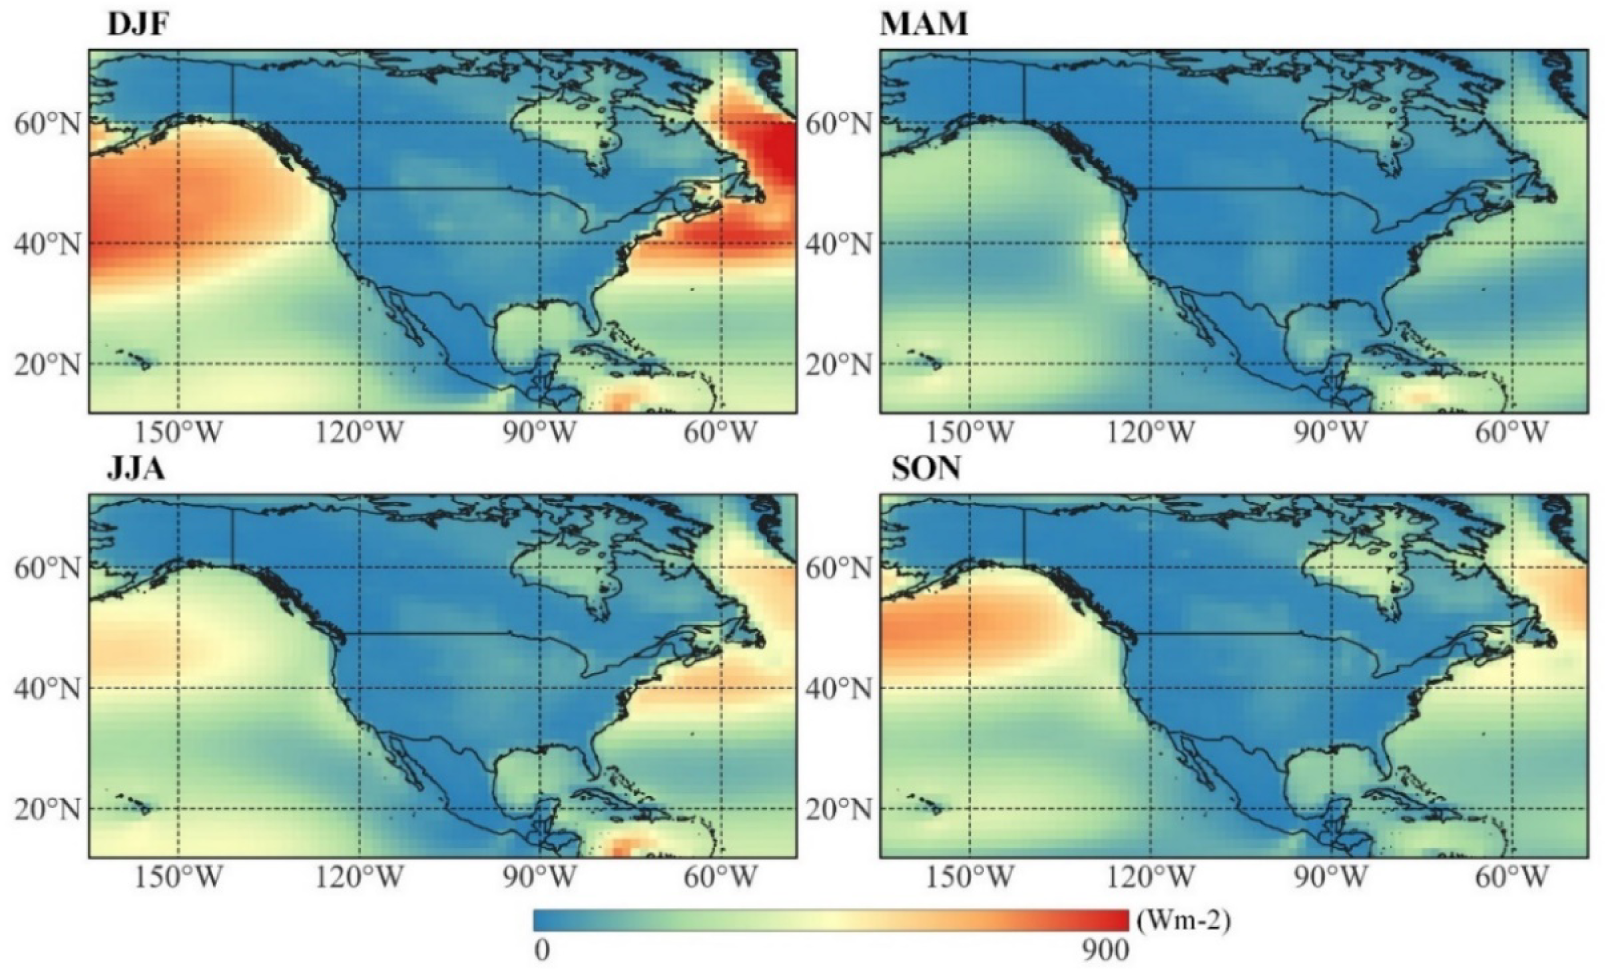
The year is divided into DJF (from December to February), MAM (from March to May), JJA (from June to August) and SON (from September to November). Wind power density data from wind projections in North America (Figure 4 and Figure 5) and Europe (Figure 7 and Figure 8) in all four periods are weighted against historical data from the same MMEs (Figure 3 and Figure 6, respectively).
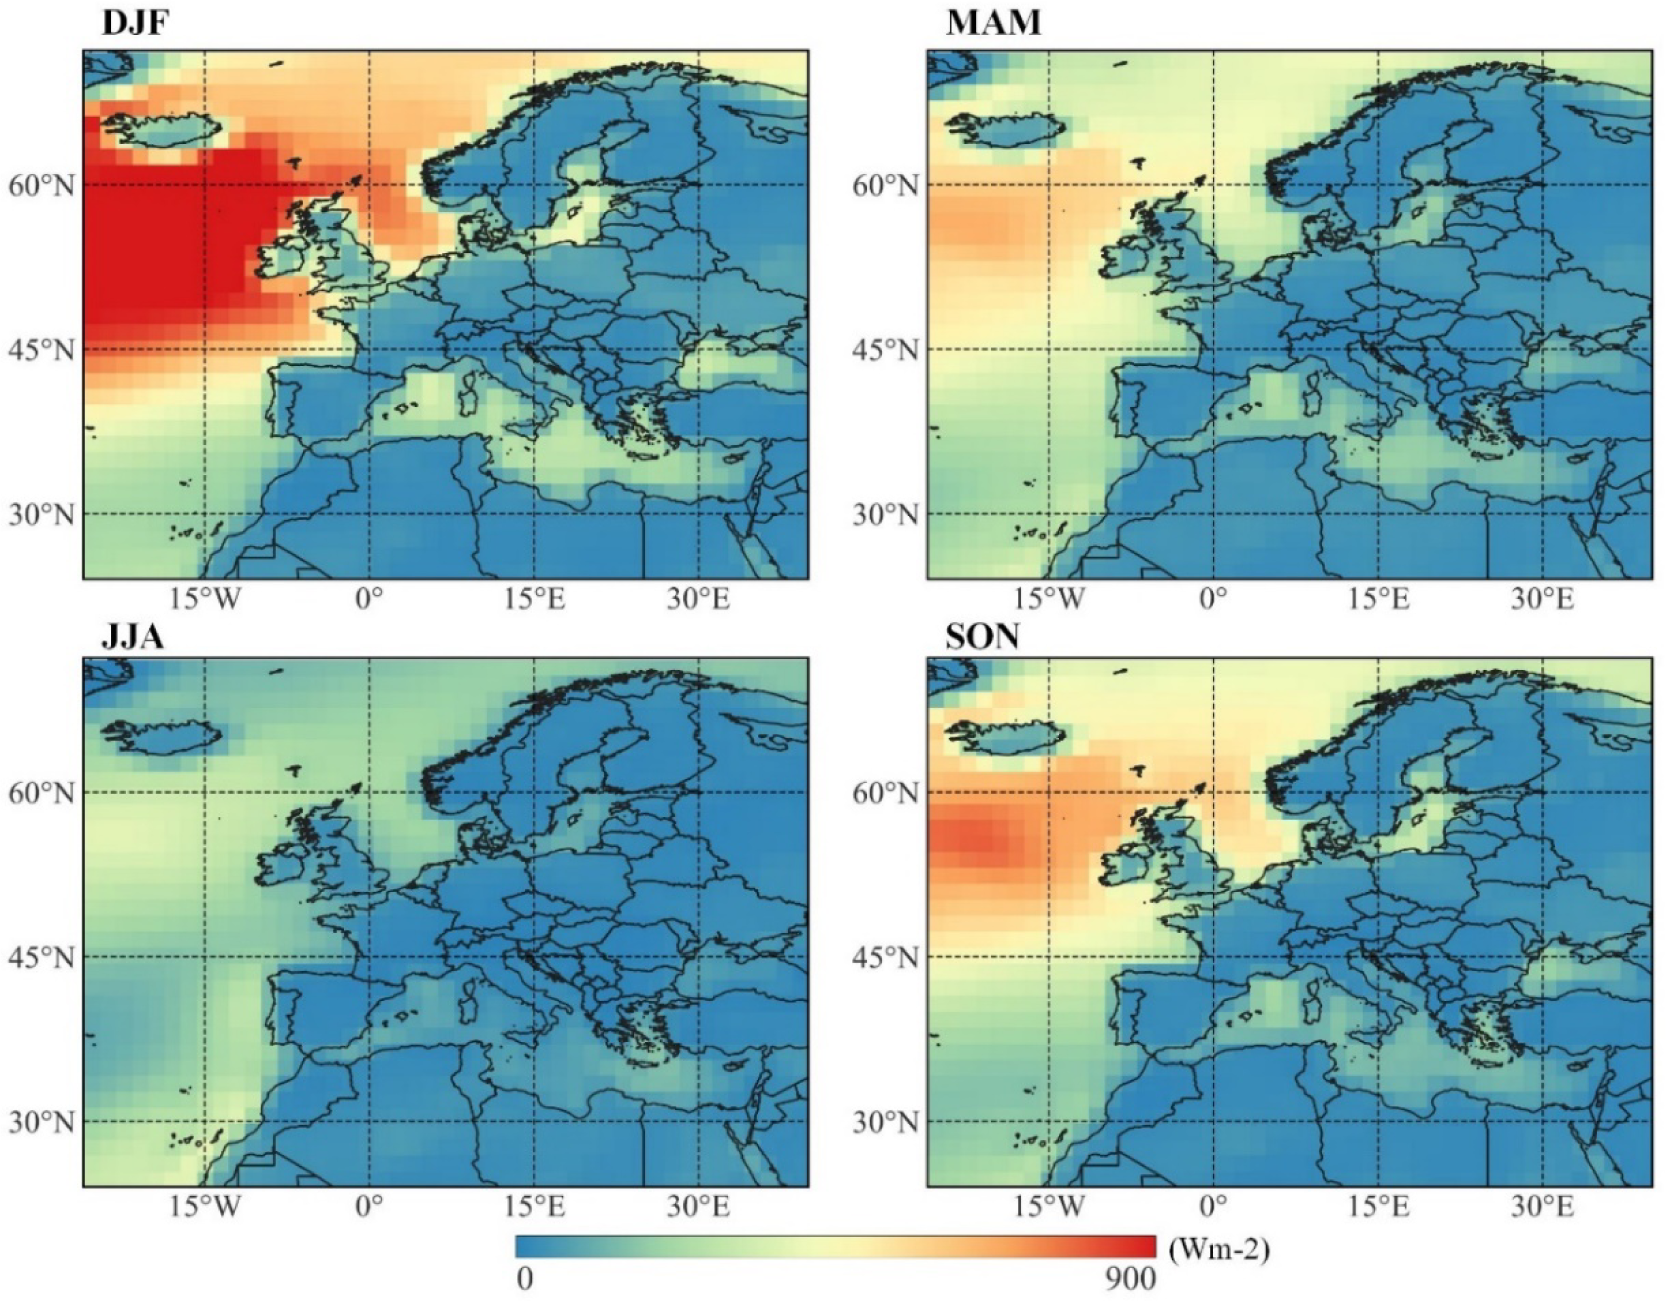
Historical data show the largest values of mean wind power density take place in SON and, particularly, DJF (surpassing 900 W/m2), corresponding with the occurrence of extratropical cyclones in the Northern Hemisphere, in both North America and Europe (Figure 3 and Figure 6, respectively). Conversely, the lowest values occur in JJA, in summer in the Northern Hemisphere.
The intra-annual variability is evaluated according to the following rationale. If wind resources increase in the seasons with already the greatest values of wind power density, a greater intra-annual variability will result – and similarly if the resources drop in seasons with the lowest values. On the contrary, wind resources dropping in seasons with the greatest resources would result in reduced intra-annual variability – and similarly if the resources grow in seasons with the lowest values. As a result, based on the historical wind resources, increases/decreases in wind projections in DJF/JJA result in an augmented intra-annual variability.
North America, historical (2005-2014) seasonal wind power density
In North America, changes anticipated by wind projections present a high seasonal component. In SSP2-4.5 (Figure 4), a notable increase (reaching 40%) is anticipated over Hudson Bay during DJF and, to a lesser degree, in MAM, whereas negligible changes are projected during the rest of the year. Another increase is predicted in wide areas in the Pacific Ocean (10%), between the 30th and 50th parallels. Being DJF the season with the most energetic winds, a growth in intra-annual variability may be expected in these regions.
North America, long-term (2091-2100) evolution of seasonal wind power density. Climate change scenario SSP2-4.5
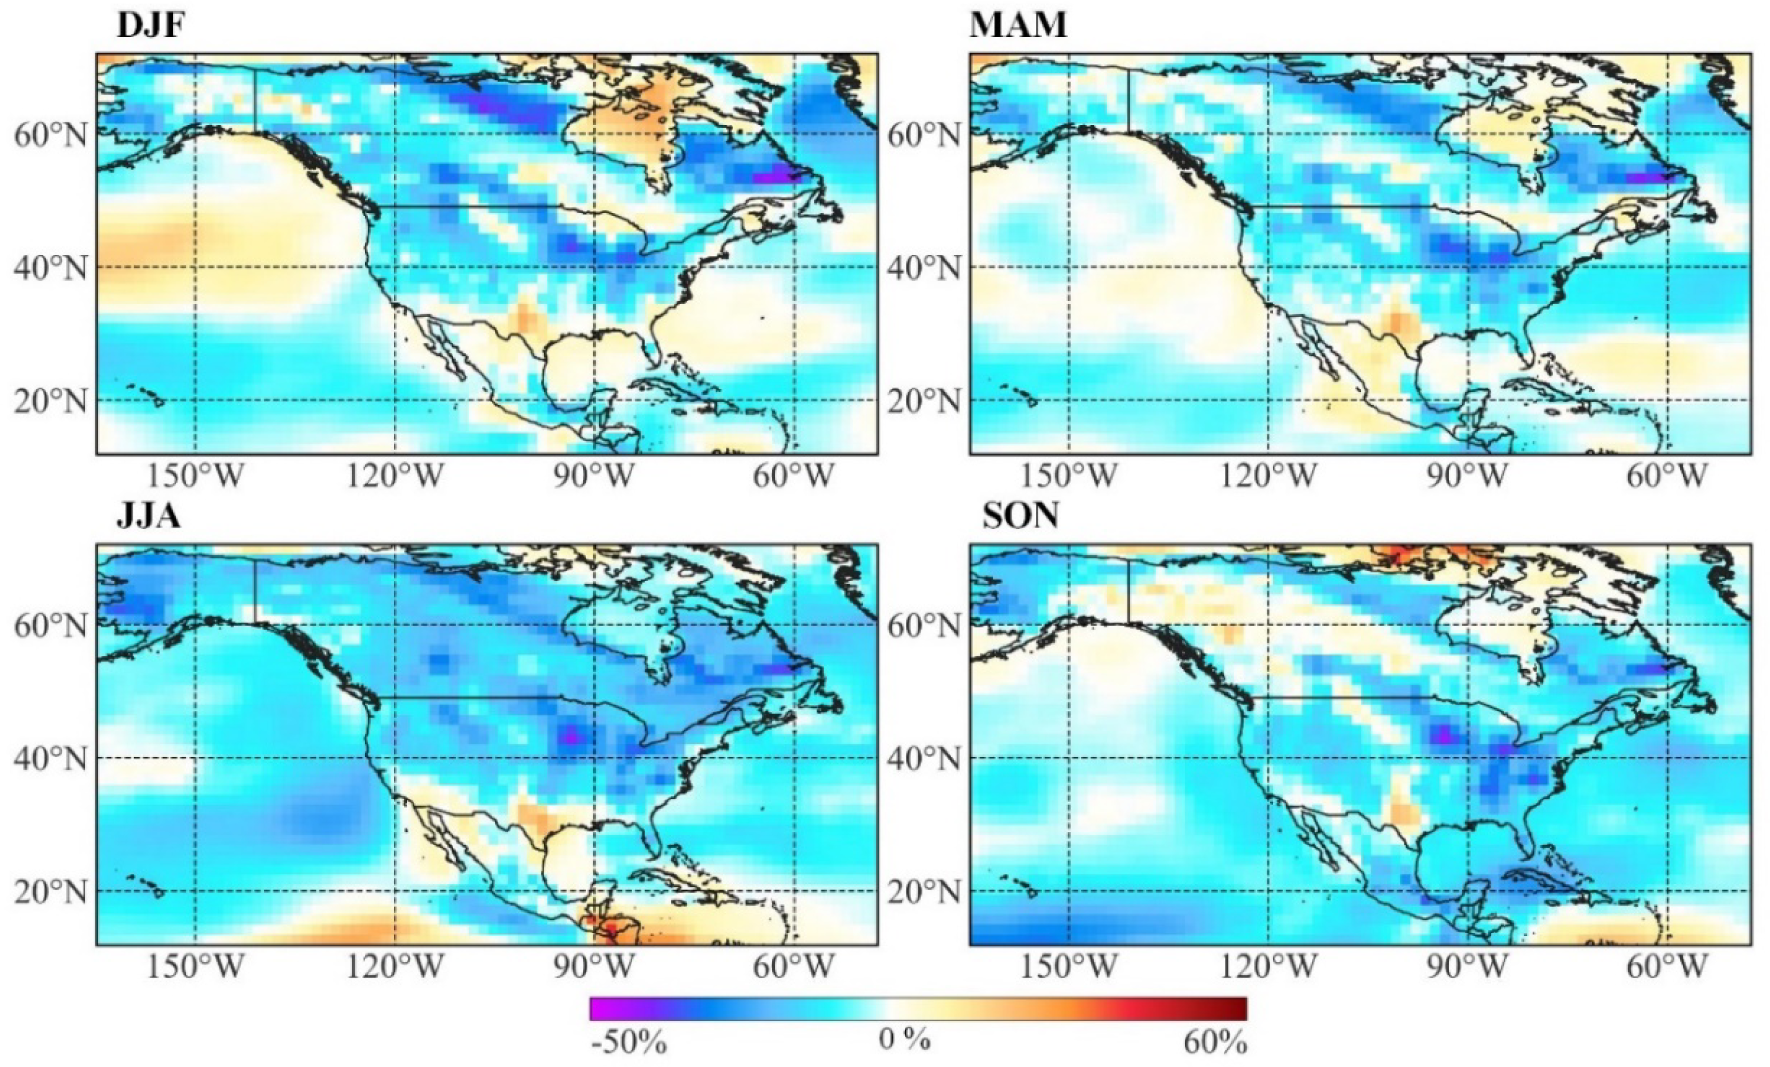
North America, long-term (2091-2100) evolution of seasonal wind power density. Climate change scenario SSP5-8.5
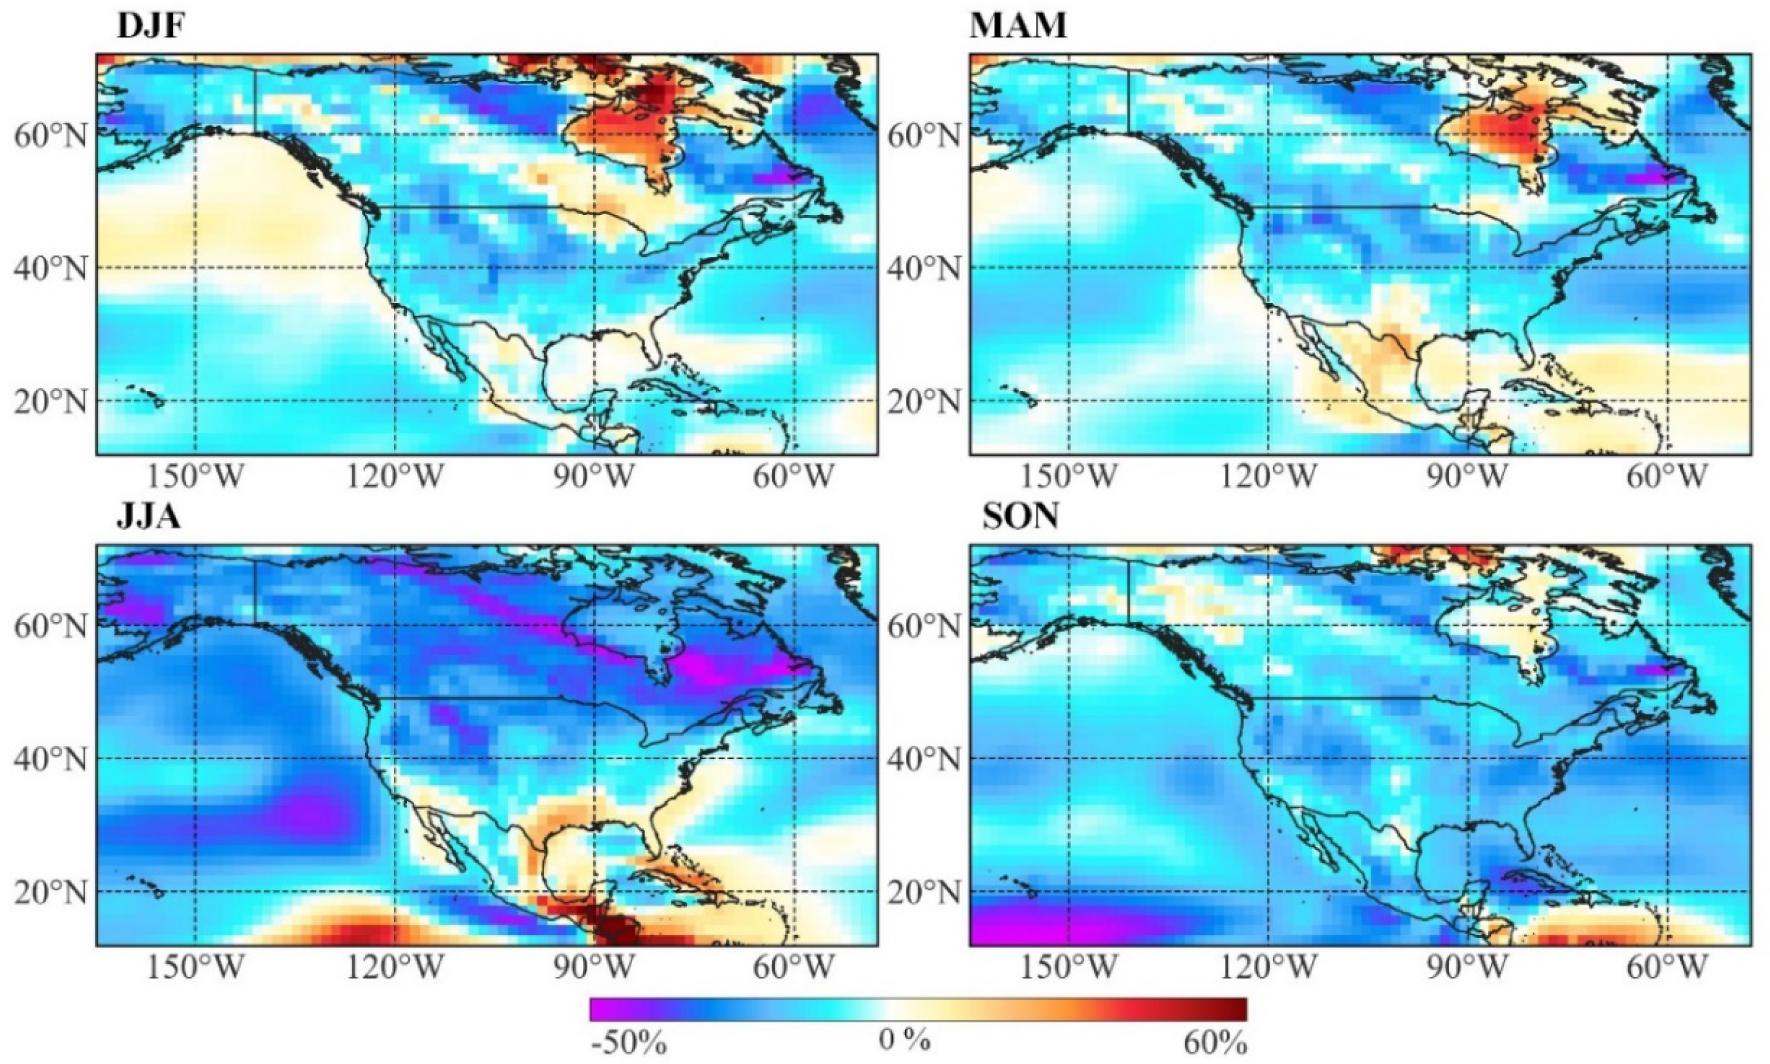
Changes in this scenario that are consistent throughout the year include the general decline anticipated in the US mainland and Canada – in the regions of Quebec and Nunavut (40% drop). Regardless of the season, a growth in wind power density is predicted in northern Mexico and Texas.
Projections according to SSP5-8.5 (Figure 5) anticipate changes with a much more pronounced seasonal character. Notably, a widespread decrease in wind resources (over 50%) is predicted in JJA in the US and Canada, particularly prominent, again, in the provinces of Quebec and Nunavut. In the same period, remarkable growth (surpassing 60%) is predicted to occur in Central America. In JJA and SON, important decreases are predicted across the Pacific, including Hawaii. Finally, the strong growth of wind resources predicted in Hudson Bay (Figure 1) is concentrated in the DJF and MAM periods.
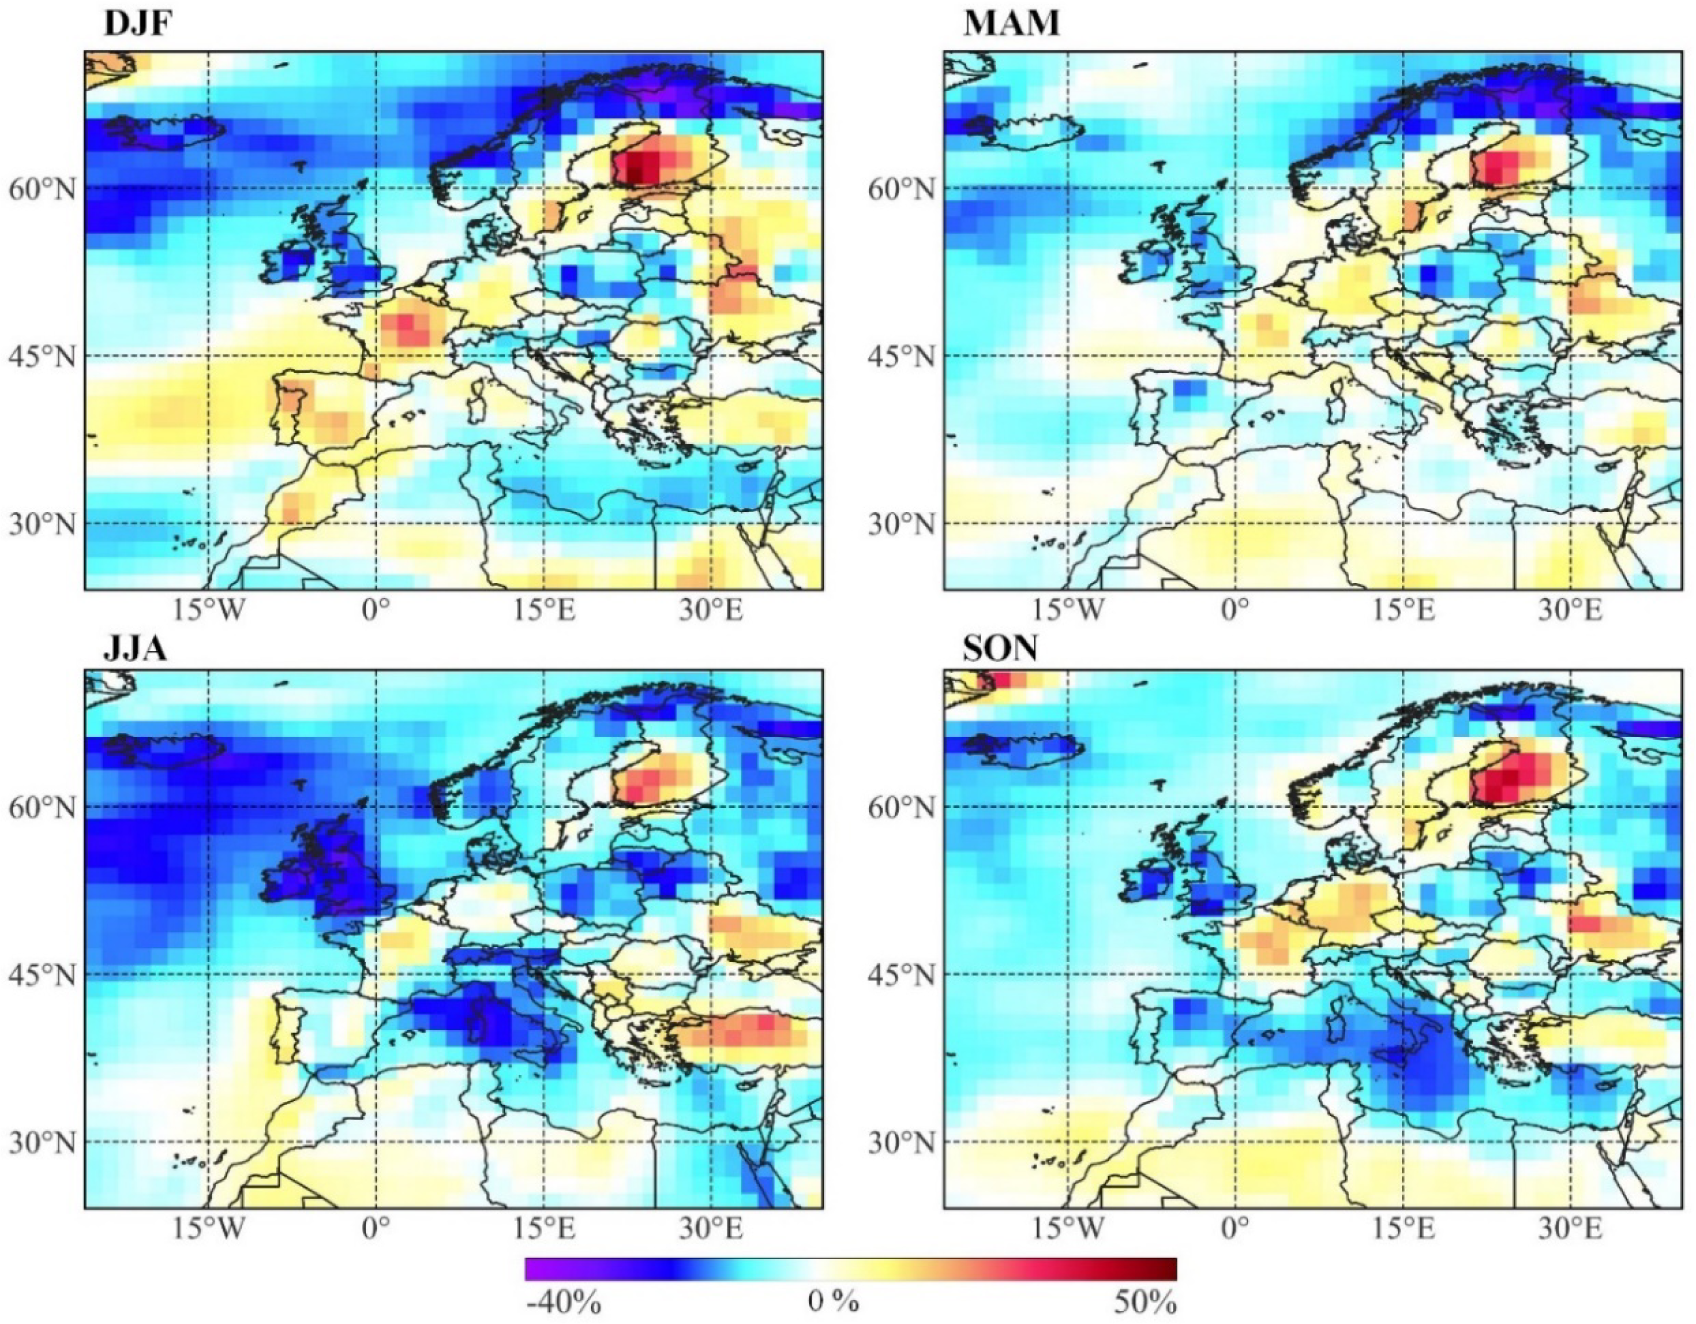
In Europe, the seasonality of changes is less marked than in North America. However, the SSP2-4.5 anticipates increases (10-15%) in the Iberian Peninsula in DJF and JJA, but decreases in MAM and SON (Figure 7). Seasonality can also be found in the Central Mediterranean, with important decreases (25%) during JJA and SON, but negligible changes in other periods.
Nonetheless, changes present projected during the whole year are predicted in multiple regions in SSP2-4.5. This is the case, most notably, of West Finland (growth >40%), Central and Western Europe (20% increases) and Ireland, the UK and the northernmost parts of Norway and Finland (decreases in the range of 10-30%).
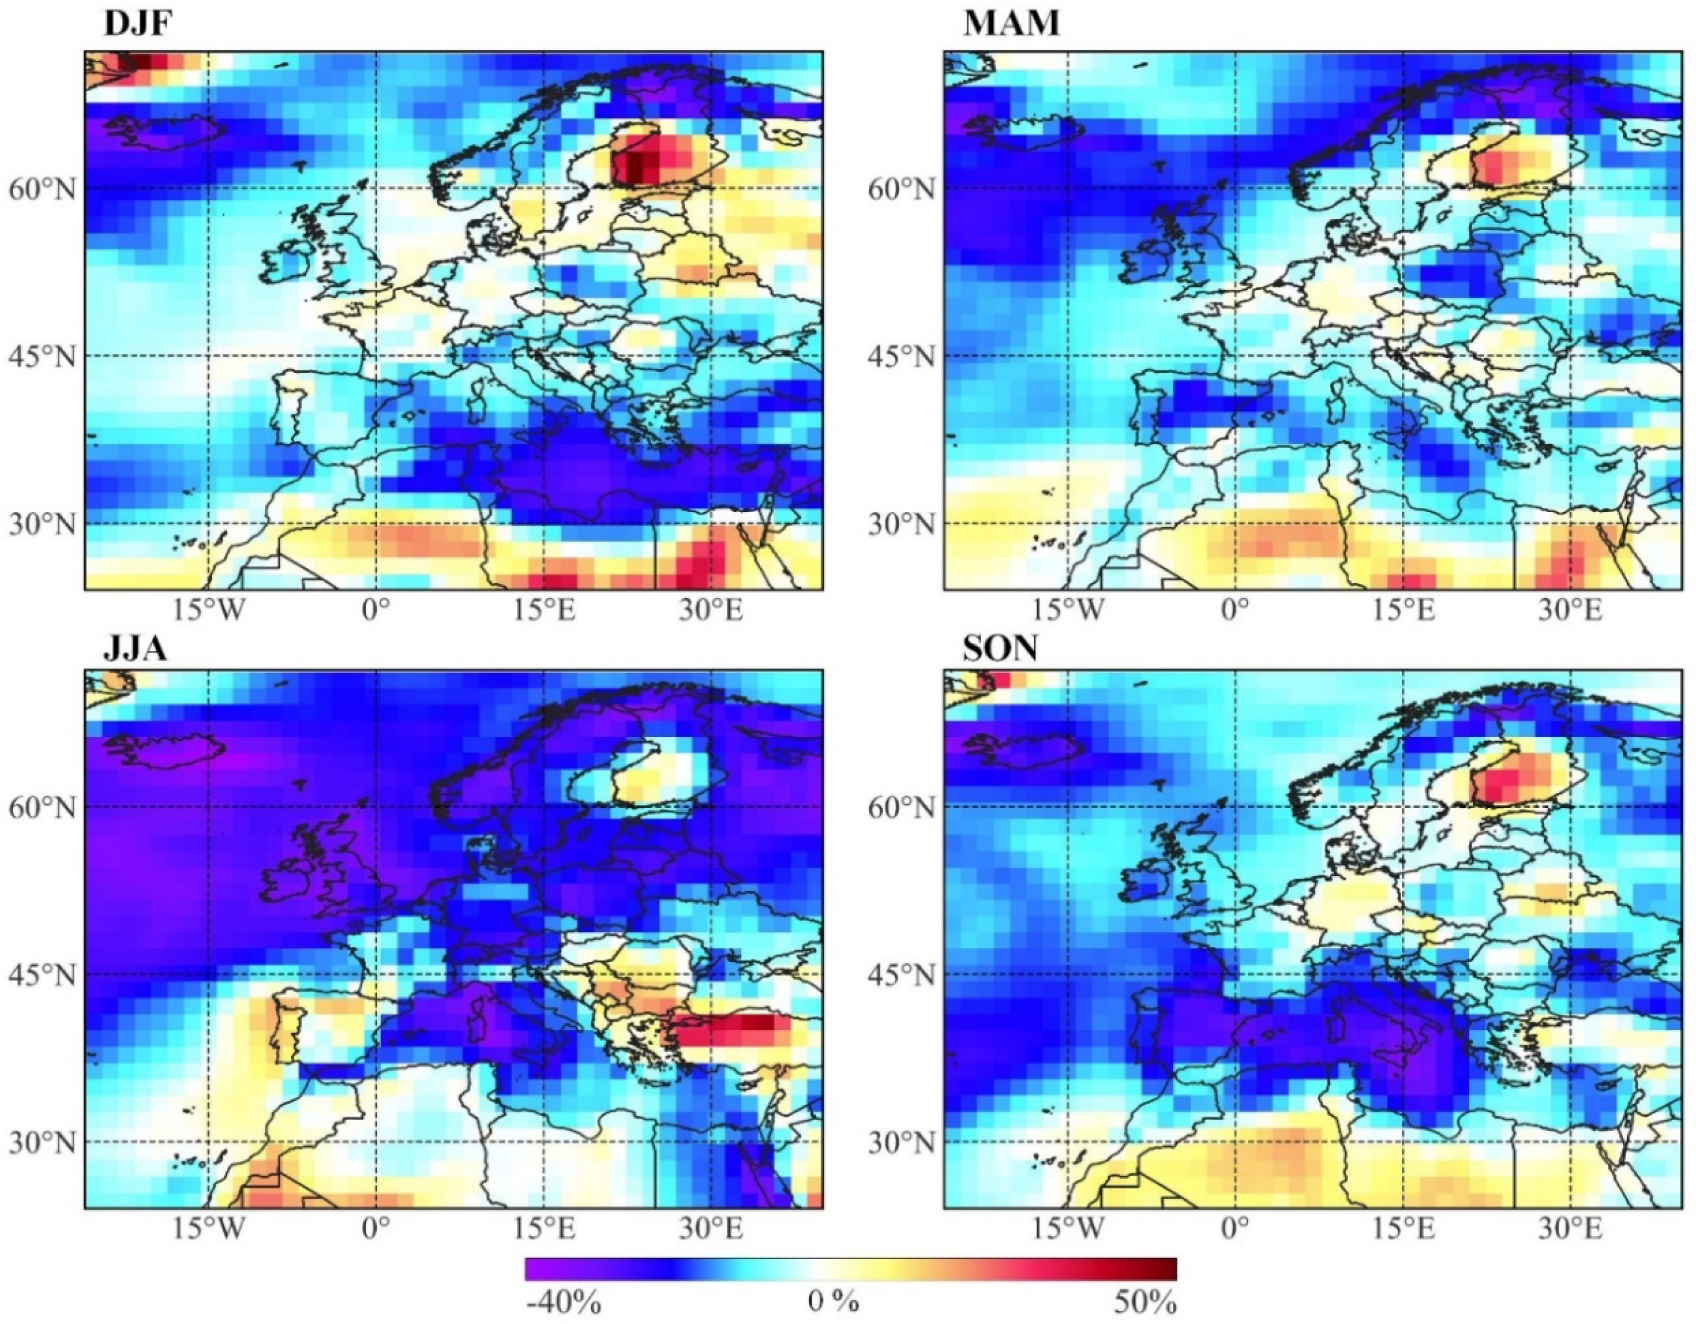
Similarly to North America, SSP5-8.5 anticipates in Europe much stronger seasonal changes than SSP2-4.5 (Figure 8). The scenario with augmented emissions predicts decreases in wind power density in latitudes in the range of 45°N and 60°N in the Atlantic Ocean and Central Europe in JJA (up to 35%). This remarkable increase, however, is of a much lesser magnitude for the rest of the year. In stark contrast, the Iberian and Balkan Peninsulas present the opposite trend – a widespread growth in wind resources exclusively in JJA of approx. 15%. Changes that appear during the entire year are exclusively located in Central Mediterranean (35% drop) and SW Finland (40% increase).
Europe, historical (2005-2014) seasonal wind power density
The results reveal a clear picture of an overall drop in wind resources across North America and Europe, two of the primary markets for wind energy. This decline aligns with the generalised drop in wind energy across the Northern Hemisphere as anticipated by previous climate scenarios [64]. This phenomenon may be attributed to polar amplification induced by climate change, which might result in diminished temperature gradients between the Polar Regions and mid-latitudes of the Northern Hemisphere. Nonetheless, anticipated changes are greatly amplified under the novel climate scenarios.
Despite this general trend, there is no doubt that the impact on wind resources differs notably between North America and Europe, and between regions in each continent. These differences have implications for the wind energy industry, given the bearing of wind energy resources on the LCOE. Therefore, future projects should consider the regional tendencies in order for the great benefits of wind energy [65] to be realised. Regional downscaling of climate projections could shed light on the local dynamics that contribute to the spatial variability of the resource.
Importantly, a continuous assessment of wind resources is crucial to determining whether their evolution aligns with climate projections [66]. The results indicate changes between past-present conditions (2005-2014) and the long-term future (2091-2100); it is noteworthy that this timescale (approx. 85 years) is considerable compared to the average lifetime of an energy project. Hence, a continuous assessment of wind resources may facilitate the adaptation of the wind energy industry to the evolving nature of these resources.
Europe, long-term (2091-2100) evolution of seasonal wind power density. Climate change scenario SSP2-4.5
This work evaluated and compared the trends of wind energy resources in the long-term future in Europe and North America using a multi-model ensemble of different models developed in the frame of the CMIP6. Changes to wind resources were studied considering two of the latest climate scenarios, the Shared Socioeconomic Pathways (SSPs). Specifically, SSP2-4.5 and SSP5-8.5.
Importantly, it became apparent that the more complex narratives of the SSPs result in greater changes in the projected wind climate than other works using previous scenarios. The results indicate distinct trends in both regions. In Europe, a widespread, substantial decrease in wind resources (~15%) is predicted in the long-term, following the SSP5.8-5, roughly equivalent to an annual reduction of 0.2%. In North America, whereas an overall decline in wind resources is also predicted, it appeared concentrated in specific regions, notably in Canada (particularly in the provinces of Quebec and Nunavut) and Alaska. Additionally, changes in wind resources in North America exhibited pronounced seasonality, with notable increases exceeding 60% and decreases exceeding 50%. Conversely, the changes in Europe were of lesser magnitude but more consistent throughout the year.
Discrepancies were observed between climate scenarios in Europe, particularly in regions of Central Europe, e.g., France, Germany, Austria, Czech Republic. However, discrepancies between scenarios are not substantial in North America. Despite these varying trends, both regions exhibited noteworthy, isolated increases, including West Finland in Europe and Hudson Bay, Texas and southern Mexico in North America.
Europe, long-term (2091-2100) evolution of seasonal wind power density. Climate change scenario SSP5-8.5
These results point to significant shifts in wind resources, which may be expected to affect the wind industry and the share of wind energy in the energy mix. For instance, if wind energy density is reduced by ~50%, as projected in some areas of North America, wind energy production may be expected to decrease by a similar order of magnitude relative to what it would have been without climate change. Given that the income of wind farms depends on the energy produced and sold to the grid, climate change might imperil the economic viability of existing or planned wind farms in certain areas. Conversely, some areas may see larger wind energy density values in future and, therefore, enhanced economic viability.
These results may be useful to the wind industry in planning new developments – the reason being that, all else equal, new capacity should preferably be directed towards regions where wind resources are projected to grow or, at the very least, remain unchanged under climate change. As time passes and climate-change effects materialise, these considerations will gain relevance for the wind sector and, more generally, the formulation of energy policies.
The high-level comparison between wind projection in North America and Europe carried out in this work highlighted significant differences in both regions. Importantly, the spatial variability of changes projected in North America is much greater than in Europe. However, this study inherits the limitations of the spatial resolution of models. In this sense, North America is revealed to be a much more important objective of future downscaling initiatives, so as to understand the local dynamics behind this marked spatial variability.
This research was supported by the European Union's Horizon 2020 European Green Deal (ILIAD project, H2020-LC-GD-2020-4, No. 101037643).
The authors gratefully acknowledge the work of the agencies and groups involved in the CMIP6 and the Earth System Grid Federation (ESGF), for producing and making openly available the outputs of the models. The authors are also grateful to the ECMWF for the ERA-5 reanalysis products employed in this work.
| P | wind power density | [kg/s3] |
| U | wind speed | [m/s] |
| ρ | air density | [kg/m3] |
| CMIP | Coupled Model Intercomparison Project |
| ECMWF | European Centre for Medium-Range Weather Forecast |
| K-S | Kolmogorov-Smirnov |
| LCOE | Levelized Cost of Energy |
- GWEC|GLOBAL WIND REPORT 2023, 2023, https://gwec.net/globalwindreport2023., OnlineAvailable
- ,
Site selection of floating offshore wind through the levelised cost of energy: A case study in Ireland ,Energy Conversion and Management , Vol. 266 ,pp 115802 , 2022, https://doi.org/https://doi.org/10.1016/j.enconman.2022.115802 - ,
A novel hybrid wind-wave energy converter for jacket-frame substructures ,Energies , Vol. 11 (33), 2018, Art - Physical model tests on spar buoy for offshore floating wind energy converion, 2020,
- ,
Techno-economic assessment of far-offshore hydrogen-carrying energy vectors off the Iberian Peninsula ,Energy Conversion and Management , Vol. 300 ,pp 117915 , 2024, https://doi.org/https://doi.org/10.1016/j.enconman.2023.117915 - ,
Sustainability assessment of innovative energy technologies–Hydrogen from wind power as a fuel for mobility applications ,Journal of Sustainable Development of Energy, Water and Environment Systems , Vol. 9 (3),pp 1–21 , 2021 - ,
Power extraction in regular and random waves from an OWC in hybrid wind-wave energy systems ,Ocean Engineering , Vol. 191 ,pp 106519 , 2019, https://doi.org/https://doi.org/10.1016/j.oceaneng.2019.106519 - ,
Energy management of a hybrid photovoltaic-wind system with battery storage: a case report ,Journal of Sustainable Development of Energy, Water and Environment Systems , Vol. 7 (3),pp 399–415 , 2019 - ,
Co-located wind and wave energy farms: Uniformly distributed arrays ,Energy , Vol. 113 ,pp 497–508 , 2016, https://doi.org/https://doi.org/10.1016/j.energy.2016.07.069 - Global wind energy resources decline under climate change, 2023,
- ,
Climate change and vulnerabilities of the European energy balance ,Journal of Sustainable Development of Energy, Water and Environment Systems , Vol. 3 (1),pp 106–117 , 2015 - ,
Multi-parameter analysis and mapping of the levelised cost of energy from floating offshore wind in the Mediterranean Sea ,Energy Conversion and Management , Vol. 243 ,pp 114416 , 2021, https://doi.org/https://doi.org/10.1016/j.enconman.2021.114416 - ,
Techno-economic assessment of potential zones for offshore wind energy: A methodology ,Science of The Total Environment , Vol. 909 ,pp 168585 , 2024, https://doi.org/https://doi.org/10.1016/j.scitotenv.2023.168585 - ,
Mapping of the levelised cost of energy for floating offshore wind in the European Atlantic ,Renewable and Sustainable Energy Reviews , Vol. 154 ,pp 111889 , 2022, https://doi.org/https://doi.org/10.1016/j.rser.2021.111889 - , Wind energy handbook, 2011
- ,
Impact of climate change on the backup infrastructure of highly renewable electricity systems ,Journal of Sustainable Development of Energy, Water and Environment Systems , Vol. 6 (4),pp 710–724 , 2018, https://doi.org/https://doi.org/10.13044/j.sdewes.d6.0209 - ,
Development of onshore wind turbine fleet counteracts climate change-induced reduction in global capacity factor ,Nature Energy , Vol. 7 (7),pp 608–619 , 2022, https://doi.org/https://doi.org/10.1038/s41560-022-01056-z - ,
European climate in the late twenty-first century: regional simulations with two driving global models and two forcing scenarios ,Climate dynamics , Vol. 22 (1),pp 13–31 , 2004, https://doi.org/https://doi.org/10.1007/s00382-003-0365-x - ,
Potential climate change impact on wind energy resources in northern Europe: analyses using a regional climate model ,Climate Dynamics , Vol. 25 (7–8),pp 815–835 , 2005, https://doi.org/https://doi.org/10.1007/s00382-005-0072-x - ,
Global Climate Model projected changes in 10 m wind speed and direction due to anthropogenic climate change ,Atmospheric Science Letters , Vol. 12 (4),pp 325–333 , 2011, https://doi.org/https://doi.org/10.1002/asl.341 - ,
Dynamical downscaling of climate change impacts on wind energy resources in the contiguous United States by using a limited-area model with scale-selective data assimilation ,Advances in Meteorology , Vol. 2014 , 2014, https://doi.org/https://doi.org/10.1155/2014/897246 - ,
Changes in Surface Wind Speed over North America from CMIP5 Model Projections and Implications for Wind Energy ,Advances in Meteorology , Vol. 2014 ,pp 292768 , 2014, https://doi.org/https://doi.org/10.1155/2014/292768 - ,
Potential impacts of climate change on European wind energy resource under the CMIP5 future climate projections ,Renewable Energy , Vol. 101 ,pp 29–40 , 2017, https://doi.org/https://doi.org/10.1016/j.renene.2016.08.036 - ,
Future changes of wind energy potentials over Europe in a large CMIP5 multi-model ensemble ,International Journal of Climatology , Vol. 36 (2),pp 783–796 , 2016, https://doi.org/https://doi.org/10.1002/joc.4382 - ,
The next generation of scenarios for climate change research and assessment ,Nature , Vol. 463 (7282),pp 747-756 , 2010, https://doi.org/https://doi.org/10.1038/nature08823 - ,
Overview of the Coupled Model Intercomparison Project Phase 6 (CMIP6) experimental design and organization ,Geoscientific Model Development , Vol. 9 (5),pp 1937-1958 , 2016, https://doi.org/https://doi.org/10.5194/gmd-9-1937-2016 - ,
The shared socioeconomic pathways and their energy, land use, and greenhouse gas emissions implications: an overview ,Global Environmental Change , Vol. 42 ,pp 153-168 , 2017, https://doi.org/https://doi.org/10.1016/j.gloenvcha.2016.05.009 - ,
Evaluation and projection of surface wind speed over China based on CMIP6 GCMs ,Journal of Geophysical Research: Atmospheres , Vol. 125 (22),pp e2020 , 2020, https://doi.org/https://doi.org/10.1029/2020JD033611, JD033611 - ,
Future projections of offshore wind energy resources in China using CMIP6 simulations and a deep learning-based downscaling method ,Energy , Vol. 217 ,pp 119321 , 2021, https://doi.org/https://doi.org/10.1016/j.energy.2020.119321 - ,
Optimized hybrid ensemble technique for CMIP6 wind data projections under different climate-change scenarios. Case study: United Kingdom ,Science of The Total Environment , Vol. 826 ,pp 154124 , 2022, https://doi.org/https://doi.org/10.1016/j.scitotenv.2022.154124 - Evolution of offshore wind resources in Northern Europe under climate change, 2023,
- ,
Evolution of the European offshore renewable energy resource under multiple climate change scenarios and forecasting horizons via CMIP6 ,Energy Conversion and Management , Vol. 301 ,pp 118058 , 2024, https://doi.org/https://doi.org/10.1016/j.enconman.2023.118058 - ,
Future changes in wind energy resource over the Northwest Passage based on the CMIP6 climate projections ,International Journal of Energy Research , Vol. 45 (1),pp 920–937 , 2021, https://doi.org/https://doi.org/10.1002/er.5997 - Impacts of climate change on wind energy potential in Australasia and South-East Asia following the Shared Socioeconomic Pathways, 2023,
- ,
The use of the multi-model ensemble in probabilistic climate projections ,Philosophical transactions of the royal society A: mathematical, physical and engineering sciences , Vol. 365 (1857),pp 2053–2075 , 2007, https://doi.org/https://doi.org/10.1098/rsta.2007.2076 - ,
How well do CMIP5 Earth System Models simulate present climate conditions in Europe and Africa? ,Climate dynamics , Vol. 41 (3–4),pp 803–817 , 2013, https://doi.org/https://doi.org/10.1007/s00382-013-1742-8 - ,
First-and second-order conservative remapping schemes for grids in spherical coordinates ,Monthly Weather Review , Vol. 127 (9),pp 2204–2210 , 1999, https://doi.org/https://doi.org/10.1175/1520-0493(1999)127<2204:FASOCR>2.0.CO;2 - ,
Climate change impacts on wind energy resources in North America based on the CMIP6 projections ,Science of The Total Environment , Vol. 806 ,pp 150580 , 2022, https://doi.org/https://doi.org/10.1016/j.scitotenv.2021.150580 - NCC NorESM2-MM model output prepared for CMIP6 CMIP’. Earth System Grid Federation, 2019,
- NCAR CESM2-WACCM model output prepared for CMIP6 ScenarioMIP’. Earth System Grid Federation, 2019,
- ,
EC-Earth-Consortium EC-Earth3 model output prepared for CMIP6 ScenarioMIP ,Earth System Grid Federation , 2019, https://doi.org/https://doi.org/10.22033/ESGF/CMIP6.251 - NOAA-GFDL GFDL-ESM4 model output prepared for CMIP6 ScenarioMIP, 2018,
- NOAA-GFDL GFDL-CM4 model output prepared for CMIP6 ScenarioMIP, 2018,
- CSIRO-ARCCSS ACCESS-CM2 model output prepared for CMIP6 ScenarioMIP, 2019,
- IPSL IPSL-CM6A-LR model output prepared for CMIP6 ScenarioMIP, 2019,
- CAS FGOALS-f3-L model output prepared for CMIP6 ScenarioMIP, 2019,
- DKRZ MPI-ESM1.2-HR model output prepared for CMIP6 ScenarioMIP, 2019,
- AWI AWI-CM1.1MR model output prepared for CMIP6 ScenarioMIP, 2019,
- CCCma CanESM5 model output prepared for CMIP6 ScenarioMIP, 2019,
- BCC BCC-CSM2MR model output prepared for CMIP6 ScenarioMIP, 2019,
- ,
NIMS-KMA KACE1.0-G model output prepared for CMIP6 ScenarioMIP ,Earth System Grid Federation , 2019, https://doi.org/https://doi.org/10.22033/ESGF/CMIP6.2242 - ,
MPI-M MPI-ESM1.2-LR model output prepared for CMIP6 ScenarioMIP ssp585 ,Earth System Grid Federation , 2019, https://doi.org/https://doi.org/10.22033/ESGF/CMIP6.6705 - ,
MPI-M MPI-ESM1.2-LR model output prepared for CMIP6 ScenarioMIP ssp245 ,Earth System Grid Federation , 2019, https://doi.org/https://doi.org/10.22033/ESGF/CMIP6.6693 - MRI MRI-ESM2.0 model output prepared for CMIP6 ScenarioMIP, 2019,
- MIROC MIROC6 model output prepared for CMIP6 ScenarioMIP, 2019,
- INM INM-CM5-0 model output prepared for CMIP6 ScenarioMIP ssp245, 2019,
- INM INM-CM5-0 model output prepared for CMIP6 ScenarioMIP ssp585, 2019,
- INM INM-CM4-8 model output prepared for CMIP6 ScenarioMIP ssp245, 2019,
- ,
Wind resource evolution in Europe under different scenarios of climate change characterised by the novel Shared Socioeconomic Pathways ,Energy Conversion and Management , Vol. 234 ,pp 113961 , 2021, https://doi.org/https://doi.org/10.1016/j.enconman.2021.113961 - ,
Climate-change impacts on offshore wind resources in the Mediterranean Sea ,Energy Conversion and Management , Vol. 291 ,pp 117231 , 2023, https://doi.org/https://doi.org/10.1016/j.enconman.2023.117231 - ,
Regional changes in wind energy potential over Europe using regional climate model ensemble projections ,Journal of Applied Meteorology and Climatology , Vol. 52 (4),pp 903-917 , 2013, https://doi.org/https://doi.org/10.1175/JAMC-D-12-086.1 - ,
Assessing climate change impacts on the near-term stability of the wind energy resource over the United States ,Proceedings of the National Academy of Sciences , Vol. 108 (20),pp 8167-8171 , 2011, https://doi.org/https://doi.org/10.1073/pnas.1019388108 - ,
On the suitability of offshore wind energy resource in the United States of America for the 21st century ,Applied Energy , Vol. 262 ,pp 114537 , 2020, https://doi.org/https://doi.org/10.1016/j.apenergy.2020.114537 - ,
Southward shift of the global wind energy resource under high carbon dioxide emissions ,Nature Geoscience , Vol. 11 (1),pp 38-43 , 2018, https://doi.org/https://doi.org/10.1038/s41561-017-0029-9 - ,
Socio-economic benefits of wind power in Brazil ,Journal of Sustainable Development of Energy, Water and Environment Systems , Vol. 1 (1),pp 27-40 , 2013, https://doi.org/https://doi.org/10.13044/j.sdewes.2013.01.0003 - ,
Wind resource assessment and forecast planning with neural networks ,Journal of Sustainable Development of Energy, Water and Environment Systems , Vol. 2 (2),pp 174-190 , 2014, https://doi.org/https://doi.org/10.13044/j.sdewes.2014.02.0015