From the onset of civilization, energy has been utilized or harnessed in various ways. Meanwhile, fossil fuels are the most dominant energy source for electricity generation. In recent times, however, the environmental impacts of those finite energy sources have escalated, calling for the search for environmentally friendly energy sources. Hence, renewable energy technologies and resources have become popular scientific fields in the twenty-first century. Furthermore, it is common knowledge that renewable energy sources replenish themselves spontaneously as they are being used. Such sources of energy include wind, biomass, mini- and micro-hydro, sun, and wave energy [1]. Consequently, these environmentally friendly technologies require little maintenance in harnessing. A notable example is solar photovoltaic (PV) technology.
Depending on wavelength and bandgap energy, the solar electromagnetic spectrum can be divided into three distinct zones such as; the ultraviolet region comprises 5% of the spectrum, with wavelengths below 400 nanometres, while the visible region of the spectrum covers 40% from 400 nanometres to 780 nanometres and infrared (IR) region that covers 50% of the solar spectrum spanning from 700 nanometres to 2500 nanometres, x-rays, gamma rays and radio waves constitute 5% of the remaining spectrum [2]. Solar PV is one of the many inventions that allows solar energy conversion to electricity the average panel conversion efficiency has grown from 15% to well over 22% as a result of the numerous breakthroughs made in solar technology in recent years, which is considered to be low and requires an upgrade [3]. Consequentially, manufacturing highly efficient PV using currently available materials may not be feasible, so the optimum technique is to enhance the amount of solar radiation collected and reduce solar panel temperatures. Solar cells have a multiphase current-voltage (I-V) signifier that changes with irradiation and temperature. On an I-V or power-voltage (P-V) graph, there is one unique point, which is termed the highest power point, the maximum power point (MPP). The MPP defines the point at which the I-V quotient for all of the PV panels is maximum and the module/array runs at peak efficiency. It operates at peak efficiency and generates maximum output power. The MPP's location can be identified using search algorithms or computation models, etc. MPP tracking is crucial to the performance of the photovoltaic modules, because the maximum power points and load characteristics are mismatched, to achieve optimal solar cell utilization [4]. In off-grid or battery systems, MPP tracking (MPPT) approaches are used to locate the MPP in all environmental situations and convert the PV system output to the battery or load voltage. The MPPT charge controller boosts system efficiency by 30% [5], and in so doing, there is additional energy gain. This is accomplished by monitoring the PV modules' highest power point, and then converting the voltage at this highest power point to battery voltage, thus increasing the current delivered to the battery.
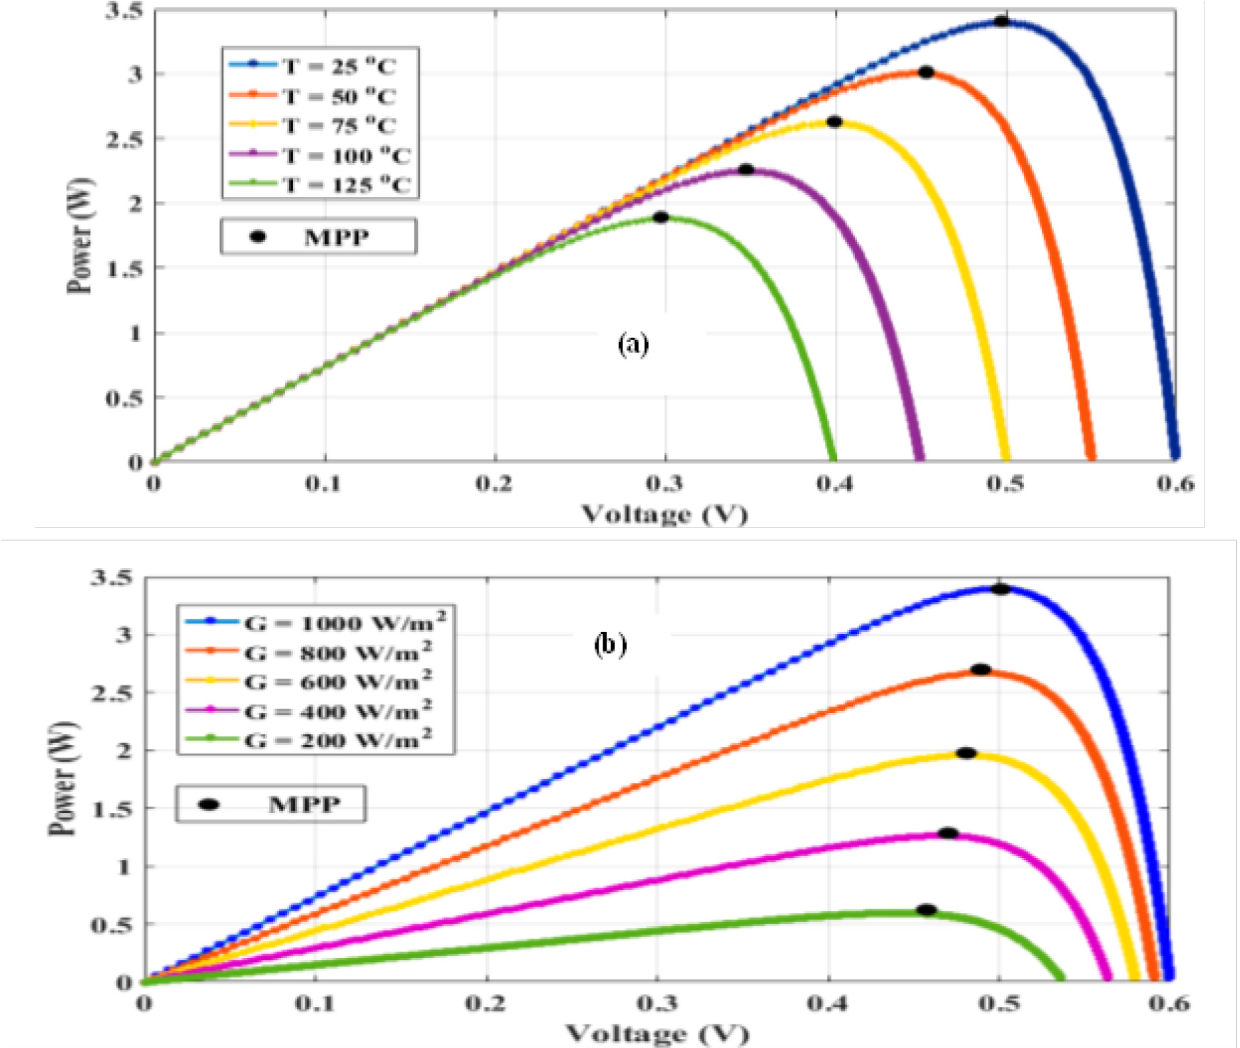
The multi-peak partial shading output curves in PV arrays are always fluctuating, necessitating the creation of a method for properly tracking the genuine output curve. Moreover, depending on the cell temperature and fill factor, the MPPT system efficiency changes, as the PV cell temperatures rise, the MPP shifts inward towards the battery voltage range (11.5 V - 14.4 V), naturally reducing the need to convert PV’s MPP to the load voltage. For each irradiance and temperature condition, therefore, a PV module’s I-V characterization graph and maximum power point are distinct [6]. Total energy drops as the solar panel temperature rises, concerning the constantly changing climatic situation, it is crucial to maintain the solar cell at a low temperature and guarantee that it is running at its highest power point to increase its efficiency. Figure 1 shows the effect of irradiance and temperature variations on the P-V properties of solar panels.
P-V curve for temperature and irradiance variation [adapted from [7]]
Making use of a tracking algorithm for a maximum power point, MPPT controllers are primarily employed to locate and extract the highest energy available from PV modules under circumstances of variable temperature and solar irradiation over a certain period. To properly track the PV modules' highest power point, numerous strategies have been devised. Many MPPT algorithms suffer some setbacks due to their slow tracking by which effective utilization is reduced [4]. Slow tracking is a process that may result in a decrease in effectiveness since the PV system may not be running at peak power during the time interval between updates, this could mean that the system isn't generating as much power as it could be under ideal circumstances. This decrease in efficiency may result in less energy generated, which could have an effect on the PV system's overall performance and efficiency. There are several algorithms for MPPT controls such as incremental conductance (In Cond.) [4], fuzzy logic control, hill climbing or perturb and observe (P&O), [8], artificial neural network (ANN), with backpropagation techniques, open circuit voltage control (OCVC), short circuit current control (SCCC), ant colony optimization (ACO), and genetic algorithm (GA) techniques [8]. A substantial study on the evaluation of thermal interface materials in mediating PV cell temperature mismatch in photovoltaic thermoelectric generator (PV-TEG), power generation was carried out [9], Thermoelectric generators, also known as Seebeck generators, are solid state devices that use the Seebeck effect to directly convert heat into electrical energy. the research was conducted to proffer the best cooling thermal interface material (TIM) under air and water-cooled environments using aluminium honeycomb cooling panels as the contacts medium. The investigation done, it reveals that with air cooling bare cells exhibited a temperature variation of ± 8.7%, whereas under water cooling they exhibited a temperature variance of ± 5.58% and voltage variance of ± 19.77% when the PV-TIM- TEG system was used. This showed a considerable reduction in PV cell temperature fluctuation, thereby improving the TEG output voltage. Advanced studies on the investigation of MPPT techniques under uniform and non-uniform solar irradiation conditions a retrospection was conducted [10], the research was based on the classifications of online, offline, and hybrid optimization of MPPT algorithms under uniform and non-uniform irradiance conditions. The investigation done, shows clearly that the majority of conventional MPPT algorithms help track the global maximum power point (GMPP) under typical sun irradiation settings. However, they are ineffective in obtaining accurate GMPP under quickly changing and partial shading conditions. A detailed study on the MPPT techniques for photovoltaic applications was conducted [11], the research was done to investigate the various MPPT techniques to carry out comparisons between them for future research relating to solar power optimization. The result shows that to achieve high-quality performance from the MPPT algorithms, incremental conductance (IC) and P&O may be the best alternatives. A comparison study on MPPT performance on isolated and non-isolated DC-DC converters by using a new approach was conducted [12], the research was conducted to examine the response time of the buck-boost converters topologies under uniform irradiation conditions. From the investigation done, the findings demonstrated that the buck converters have strong tracking capability under low irradiance situations since MPPT capability grows with a wide range of load resistance values.
The open loop MPPT technique consists of the artificial neural network, fractional short-circuit current, fractional open circuit voltage, and fuzzy logic methods. The fractional short-circuit current method demonstrates that the estimated maximum power point current is proportional to the short circuit current of the PV modules. Its accuracy and tracking efficiency depend on a constant, K given that Impp ≈ KIsc. Tracking efficiency is the efficiency of an MPPT to track the PV module's output, comparing it to the battery voltage, and determining the optimal power output for charging the battery. It then converts that output to the optimal voltage to deliver maximum charging current to the battery. The periodic measurement of open circuit voltage is done by measuring Voc and then adjusting/fixing Vmpp. However, this technique is easy and inexpensive to incorporate but has the drawback of having low tracking efficiency.
Backpropagation is used as a pattern classifier or in a nonlinear overlaid input network to provide a universal approximation to nonlinear input and output connection in artificial neural networks, which are supplements to standard modelling approaches [13]. Reference signals, such as the reference voltages or the duty cycle signal are produced by ANN and are utilized to control the energy transformer to run near or at MPP. The fuzzy logic method (FL), can operate with erroneous inputs and does not require a perfect mathematical model, it has quick convergence and can deal with nonlinearities, to monitor MPP. The mistake is determined using temperature, irradiation, or instantaneous quantities such as energy and voltage [13]. To operate at or close to MPP, this approach can be used either in a closed loop or in an open loop. The hill climbing technique, perturbation, and observation technique approach share equal fundamental concepts to arrive at MPP. The bottom line however is that there exist inherent shortcomings in the various tracking mechanisms due to the variations of MPP with irradiance and temperature.
Various comparisons of charge controllers on PV panel performance were documented [14]. The experimental study was carried out to know the influence of charge controllers on PV performance and from the analysis done, the presented results showed that charge controllers have different algorithms and operating principles that change the performance of the PV panel. A comparative study of MPPT and PWM solar charge controllers and their integrated systems has also been investigated [15]. The research was done to develop a conceptual model that will integrate the MPPT and PWM technologies to balance the storage backup as well as the load, to utilize the complete solar energy that is generated.
A detailed investigation of simplified phase-shift PWM-based feed-forward distributed MPPT methods for grid-connected cascade PV inverters was also documented [16]. This research was based on employing a feed-forward control method for extracting the MPP of various modules by adapting the percentage distribution of the module. From the analysis done, the outcome demonstrated the distributed MPPT’s capabilities to extract MPP from each PV module under normal and partial shade situations.
A detailed review of MPPT and PWM solar charge controllers was investigated and from the review carried out, MPPT charge controllers show superiority over PWM charge controllers [5]. Performance comparison between PWM and MPPT charge controllers has also been investigated though the experiments were not performed simultaneously but in similar environmental conditions [17]. From the results obtained, the MPPT charge controller efficiency exceeded that of the PWM charge controller by 15.4%, despite the PWM charge controller having slightly favourable environmental conditions over the MPPT charge controller. The authors in [18], present a study on improving the performance of photovoltaic panels using a direct water cooling system. Five series of measurements were made the first four series were done in a lab, and the fifth series was done in an actual setting. According to the experiment and analysis, the PV module's performance can be decreased by 10% in real-world settings when its temperature is raised from 27 to 55 °C. Furthermore, there is an increase in output power ranging from 3.5% to 12.0% upon employing the direct water-cooling system (DWC) in a laboratory setting. It has been found that a 12.7%–13.7% increase in generated energy is feasible with regard to weather conditions. A study on energy flow management in a smart microgrid based on photovoltaic energy supplying multiple load was documented by [19], particle swamp optimisation was used as the optimisation technique in order to effectively conserve energy while limiting manufacturing and operating costs. Given the low cost of power generated. The study's and experiments' findings suggest that this strategy would enable more people, especially those with low incomes living in rural areas, to have universal access to electrical energy. In addition, the genset-related exploitation costs and greenhouse gas emissions have decreased significantly, as indicated by the maximum renewable factor (MRF) value and the operator has the option to expand energy generation at its locations in proportion to the demand from the local population. The authors in [20] presented a novel design of hybrid single slope solar distiller with photovoltaic powered thermoelectric system. The study was conducted to provide clean water without using fossil fuels, which is environmentally friendly. Distilled water output is significantly increased by the use of thermoelectric modules because part of the latent heat in the vapor is recovered and pumped back into the saline water, the concept is more energy efficient than a traditional solar distiller. The hybrid single slope solar distiller with PV driven thermoelectric design gives an astounding 672% production improvement when compared to conventional distillers, according to the experimentation and analysis done. In addition, a computational model was created to simulate the recommended distiller behaviour and demonstrated a satisfactory agreement with the experimental results.
The majority of the literature on MPPT centres on an algorithm, a comparison of MPPT and PWM charge controllers, MPPT and PWM charge controller reviews, and the effect of shading and non-shading environmental conditions. Little or no studies have been done or carried out on field experimentation on the significance of market-ready MPPT under high-temperature field conditions. The majority of recorded performance data are based on laboratory simulations this gave the rationale for this study. Therefore, this study sought to investigate the actual significance of an MPPT on the effectiveness of solar panels in delivering generated power to the battery bank under moderate- to high-temperature field conditions.
The experimentation utilizes polycrystalline silicon modules, The choice of polycrystalline modules was informed by what is locally being used by the industry especially in solar home systems (SHSs), due to its cost and low GHG emissions as compared to the monocrystalline PV modules. The hardware interconnections of the components included the current sensor (ACS 712), voltage sensor (resistor voltage divider configuration), three (3) 50 watts polycrystalline silicon PV modules, three charge controllers (two 12 V, 30 A MPPTs and a 12 V, 30 A PWM charge controllers), data logger (RIGOL M300), battery, CSS220 direct contacts thermocouples and an Arduino AT-Mega board. All the sensor outputs were connected to analogue channels of the Arduino mega and the output was sent to the computer through the USB plugged into the Arduino. The ground connection being the reference (0 V) potential is synchronized for all the sensors and Arduino Mega. The configuration shown in Figure 2 comprises three panels, two (2) MPPT charge controllers of different makes, and one PWM charge controller, which are connected to the PV modules.
Experimental setup: (a) Circuit Diagram, (b) Parameter log on M300, (c) Temperature and Irradiance probe, (d) Battery & Charge Controller Setups, and (e) Module setups
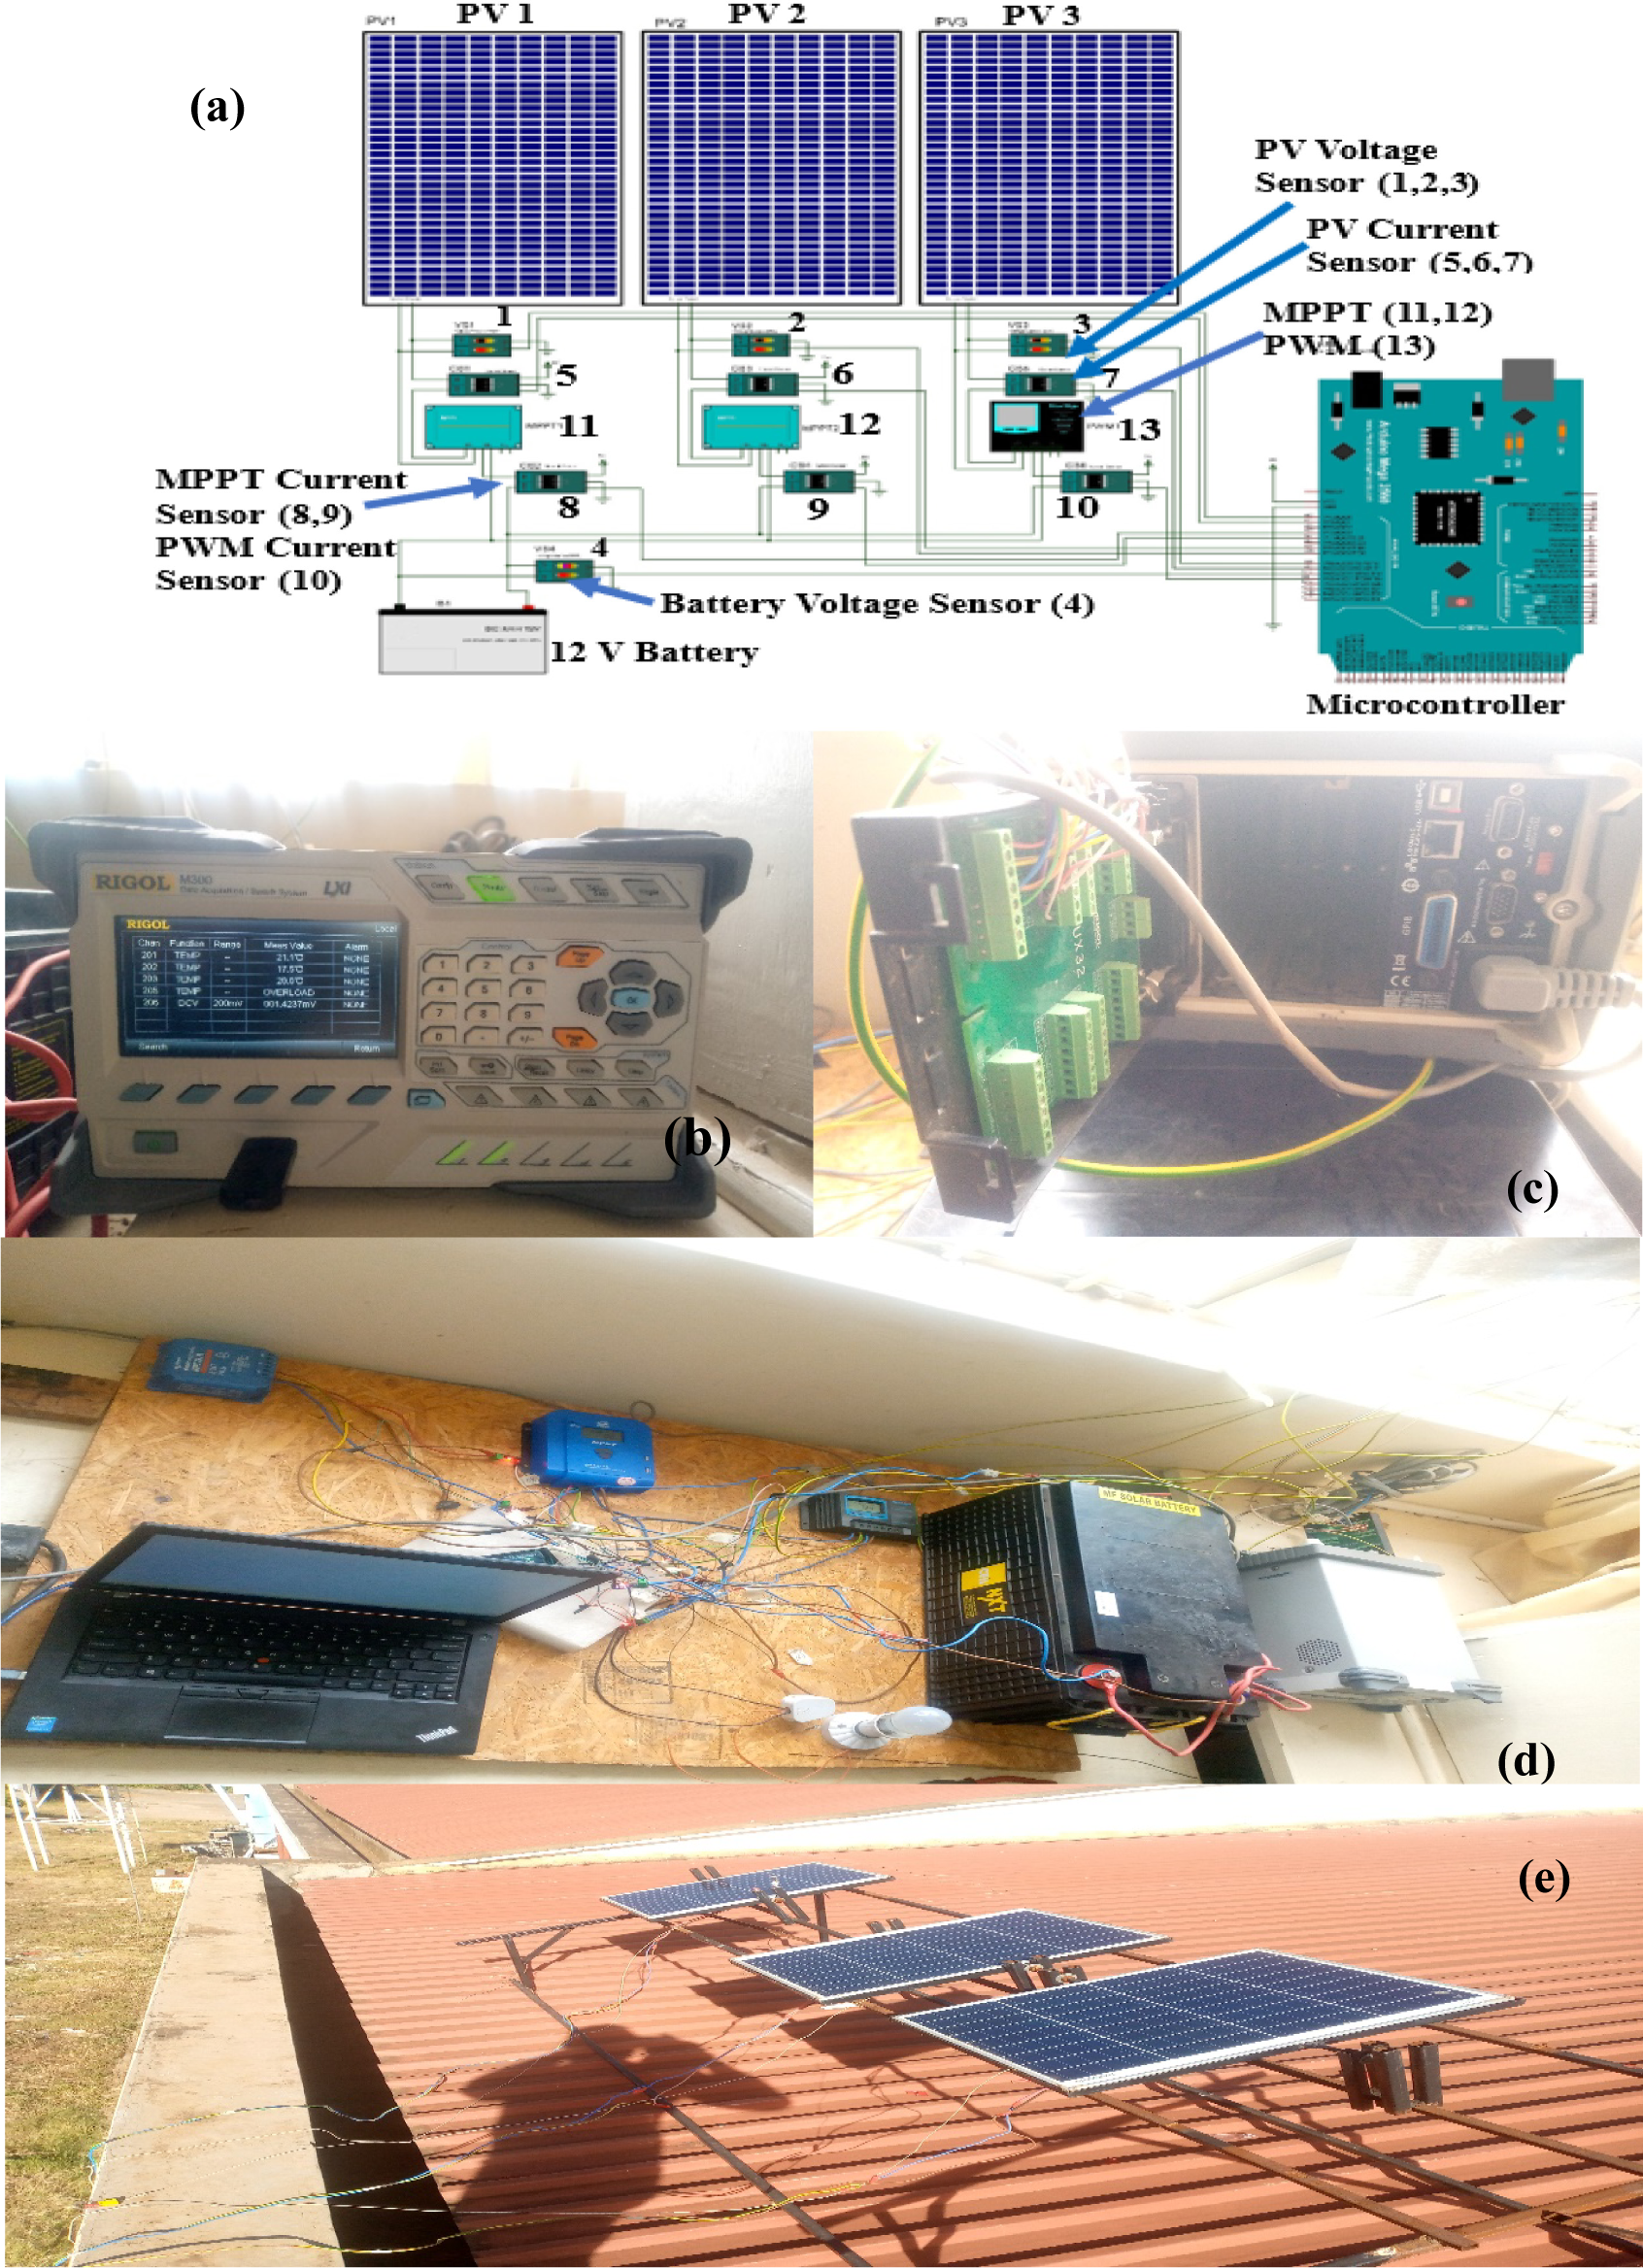
The data logger (RIGOL M300) recorded the photovoltaic array’s temperature using CSS220 direct contact thermocouples. The logger also recorded the irradiance values through the connected pyranometer on its input channel. The PV output current was measured using the ACS712 analogue to digital current sensor module which is connected to the Arduino AT- mega digital input pin, and the measured values were recorded on the laptop through the Arduino AT- mega USB port. The voltage signals were measured using the resistor-voltage divider method, and the measured values were recorded in the same process as those of the current values.
For ease of presentation and interpretation, the analogue data were transformed into digital form by the Arduino AT-Mega. Here, a Pseudocode was written for the smooth running and operation of the Arduino. It is usually written in plain language and does not include specific syntax or programming constructs. In writing the pseudocode, firstly, the variables for current and voltage for all panels were named, variables to hold raw data from analogue to digital converter were also named, and connection pins were defined. The pins for output/input were set, serial communication was initialized, functions that calculate the current and voltage were defined, and finally, commands were given to read raw data from all sensors and calculate the values of current for each MPPT and PWM charge controller and battery voltage.
PV cell temperature, solar irradiance, MPPT, and PWM charging currents, and voltage were measured at 10-second intervals for 4 hours (10:00 AM – 2:00 PM) daily, at the School of Engineering, Kenyatta University main campus, Nairobi, Kenya. Two MPPT controllers of different models and a PWM controller were connected separately to three (3) 50 W PV modules and their battery output terminals connected to a single 12 V battery, to have a uniform voltage since the charge controller output current is based on the load voltage. Four CSS220 direct contact thermocouples were used, three (3) were fixed to the solar panel back sheet using thermal glue to take cell temperature readings, and the remaining thermocouple was kept hanging for ambient temperature measurements. All four thermocouples including the terminal of the pyranometer were connected to the data logger (RIGOL M300) for recording and temporary storage of temperature and irradiance readings. DC voltages and current were recorded using Arduino AT-mega through the voltage divider resistor and ACS712 current sensor modules as shown in Figure 2.
Furthermore, the effect of temperature on MPP was briefly modelled and simulated to observe the behaviour using the employed PV module parameters. Data were collected at predetermined time intervals for three months, months of November, December, and January to observe the trends as local ambient temperatures rose.
Temperature plays a major role in the performance of the photovoltaic module, as high cell temperatures above the STC value of 25 °C would affect the performance of the PV module negatively. According to the datasheet of a 50 W polycrystalline PV module, the temperature coefficient of -0.31 % implies that, for every degree rise in cell temperature, the Voc (21.6 V) reduces by 0.067 V/°C). At the same coefficient, Vmpp (17.8 V) reduces by 0.05518 V.
In trying to match the best time of the year to study the effects of high-temperature conditions, the hottest period was considered favourable. Figure 3 presents the annual temperature profile of Nairobi which shows the months in which warm or cool temperatures are experienced.
Nairobi Temperature Profile [Adapted from [21]]
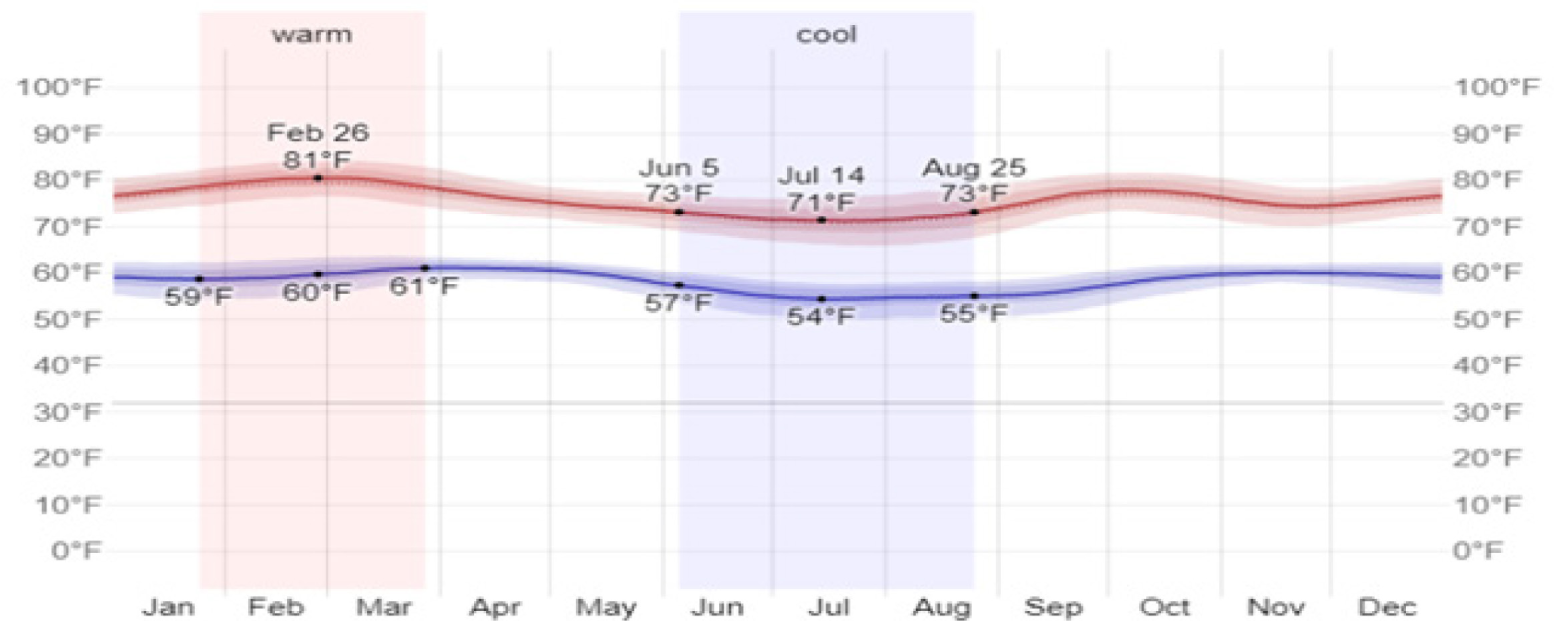
From the information presented in the figure, it shows that warm temperatures are experienced from January to March, and cool temperature from June – August, while April, May, September, October, November, and December falls under month with moderate temperatures. According to the temperature profiles, January has an average ambient temperature of 80 °F (26.7 °C), November 74 °F (23.9 °C), and December 76 °F (24.7 °C), respectively. This served to establish the temperatures at which the significance of the MPPT becomes negligible.
Figure 4 presents the cell and ambient temperature values of the PV modules for the experiment carried out concerning their month.
Temperatures: (a) November, (b) December, (c) January
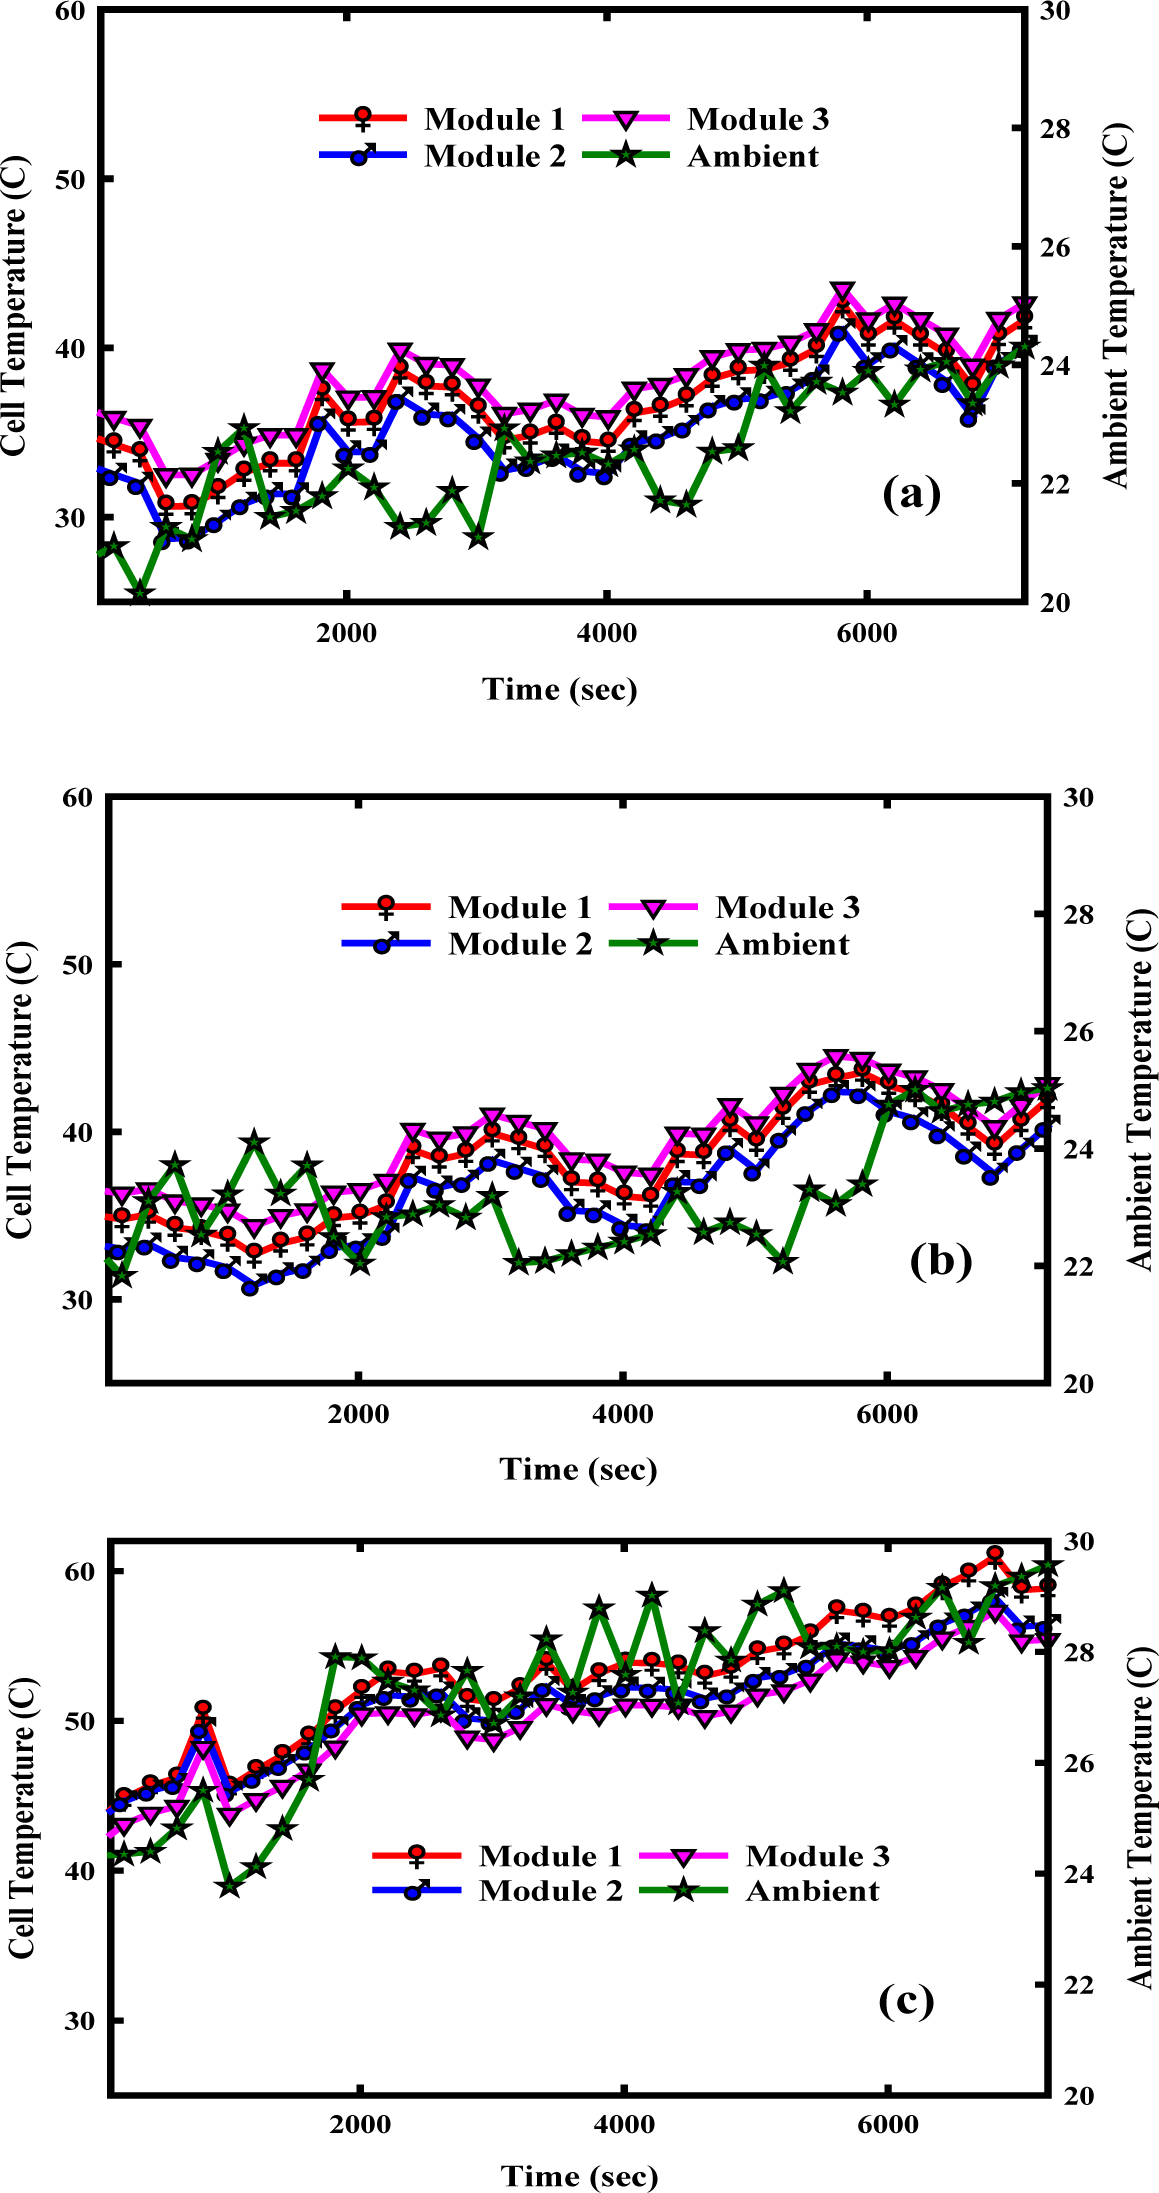
Figure 4 shows the trends of cell temperature for the three modules for the month in which the experiment was carried out. As informed by the ambient temperature trends in the study site, an increase in ambient temperatures gives rise to an increase in the PV cell temperature. Figure 4a representing the month of November has a maximum ambient temperature of 24.3 °C, and maximum individual cell temperatures of 42.6 °C, 41.6 °C, and 42.1 °C, respectively. Figure 4b representing the month of December, has a maximum ambient temperature of 25.0 °C, and the maximum cell temperature for individual modules are 43.5 °C, 42.9 °C and 43.2 °C, respectively. Figure 4c representing the month of January, which is known for having high temperatures, had a maximum ambient temperature of 29.6 °C, and while the maximum cell temperature obtained on the individual modules are 61.0 °C, 60.5 °C, and 59.7 °C, respectively. This shows that January accounts for the month with the highest ambient and cell temperatures among the months of the experiments. Furthermore, the ambient temperature in December is slightly higher than that of November by a factor of 0.69 °C implying that, the month of December is slightly hotter than November.
Figure 5 demonstrates the effect of high cell temperature on PV maximum power point, The I-V and P-V curves show the effect of rising cell temperature on a 50 W polycrystalline PV module, having a Voc of 21.6 V DC and an Isc of 3.2 A DC, respectively. It shows clearly that, as cell temperature increases, the MPP of a PV module shifts inward and the Vmpp starts decreasing gradually towards the battery voltage region.
Simulated results illustrating the effect of rising cell temperature on MPP: (a) I - V Curve, (b) P - V Curve
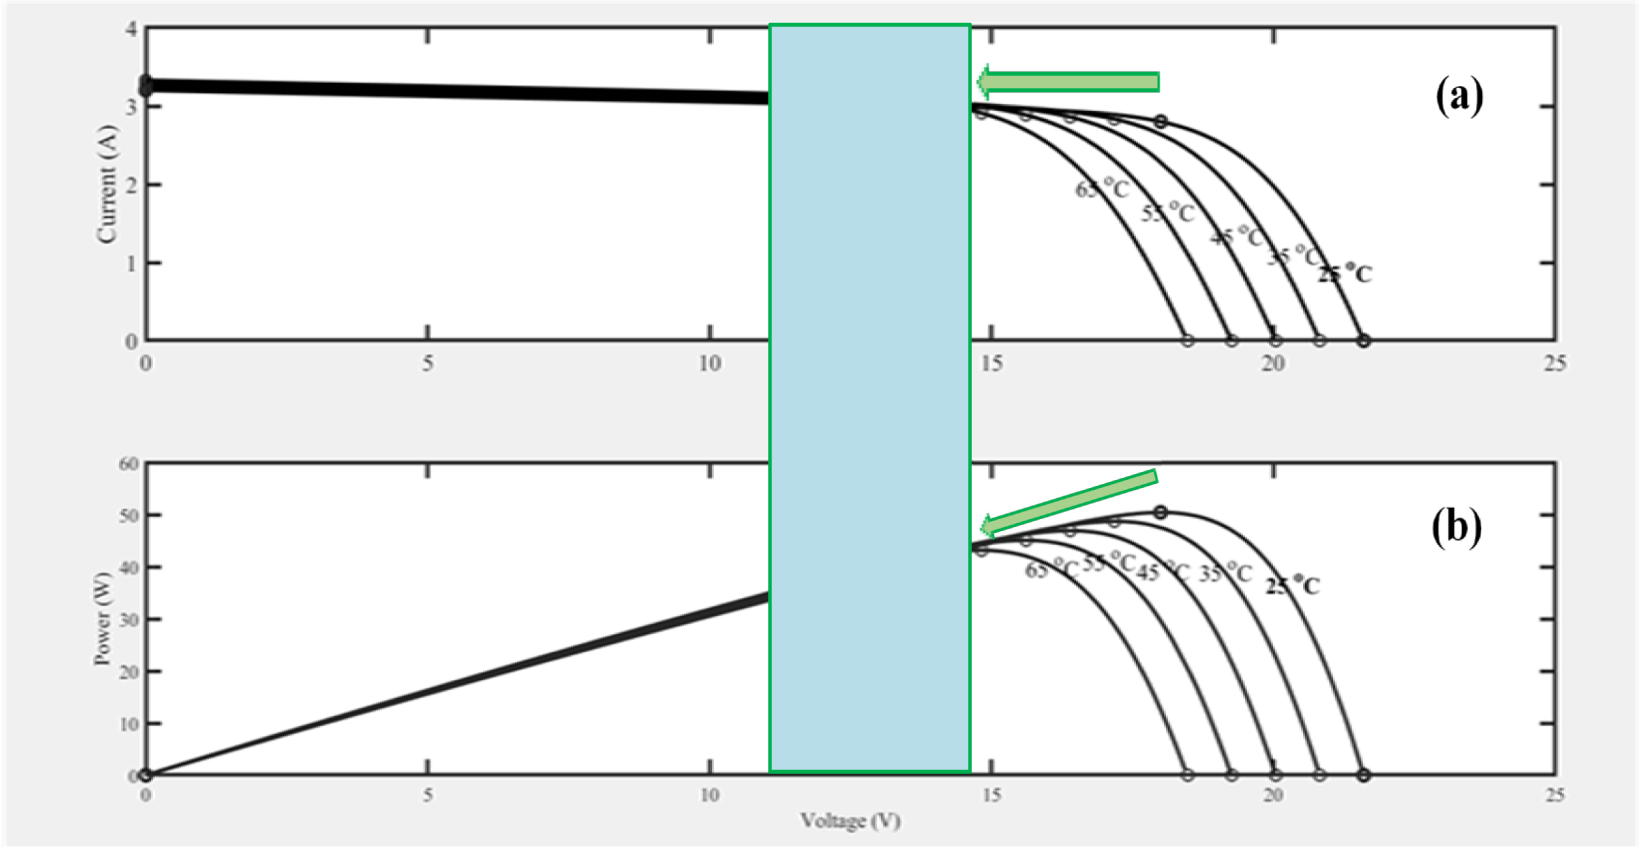
As shown in Figure 5 increase in temperature, causes a decrease in the voltage at the maximum power point (Vmpp) and a slight increase in the current at the maximum power point (Impp), which results in shifting the maximum power point (MPP) inwards. This rise in cell temperature also affects the output power as shown in the power and voltage (P-V) curve of Figure 5a. The simulated I-V and P-V curve of Figure 5b is in agreement with the available literature. Under standard test conditions (STC), the effect of increasing cell temperature on the output performance of PV modules can be predicted mathematically given a set of temperatures and irradiance.
At STC of G = 1000 W/m2, T = 25 °C and air mass (AM) = 1.5.
(1)
Given a 50 W module with a temperature voltage coefficient of -0.31%, the coefficient can be interpreted as shown in eq. (2) and can further be expressed mathematically as in eq. (3) [22]:
(2)
(3)
Vref - reference voltage (V), Tref - reference temperature (°C), T - measured temperature (°C), Vmpp - voltage at maximum power point (V), µVmpp - temperature coefficient of Vmpp (%/°C). At STC Vmpp for a 50 W module = 17.8 V, and Impp = 2.81 A. The temperature coefficient for the current is 0.05 %/°C.
Table 1 shows the mathematically tabulated values of Vmpp (V), Impp (A), and Pmpp (W) as a result of the effect of a rise in cell temperature. The results of power indicate a loss of 10.6% at cell temperatures of 65 °C.
Calculated values of the effect of temperature rise on MPP
Temperature [°C] |
Imp [A] |
Vmp [V] |
Pmp [W] |
|---|---|---|---|
| 25 | 2.8 | 17.8 | 50.0 |
| 35 | 2.8 | 17.3 | 48.7 |
| 45 | 2.8 | 16.7 | 47.4 |
| 55 | 2.9 | 16.1 | 46.0 |
| 65 | 2.9 | 15.6 | 44.7 |
In the experimental study, the effect of moderate and high cell temperatures on the performance of the MPPT charge controller was investigated, using a PWM charge controller as a reference charge controller. As stated earlier, high cell temperatures reduce the performance of MPPT charge controllers and at moderate temperatures, better performance is expected [5]. Figure 6 presents the experimental results for the two MPPTs and a PWM simultaneously performed under varying environmental conditions, during November, December, and January. The month of November and December is known for having moderate temperatures and irradiance as compared to January, which has high temperatures and solar irradiance as stated in the Nairobi climatic data profile [21].
Variation of power output with temperature
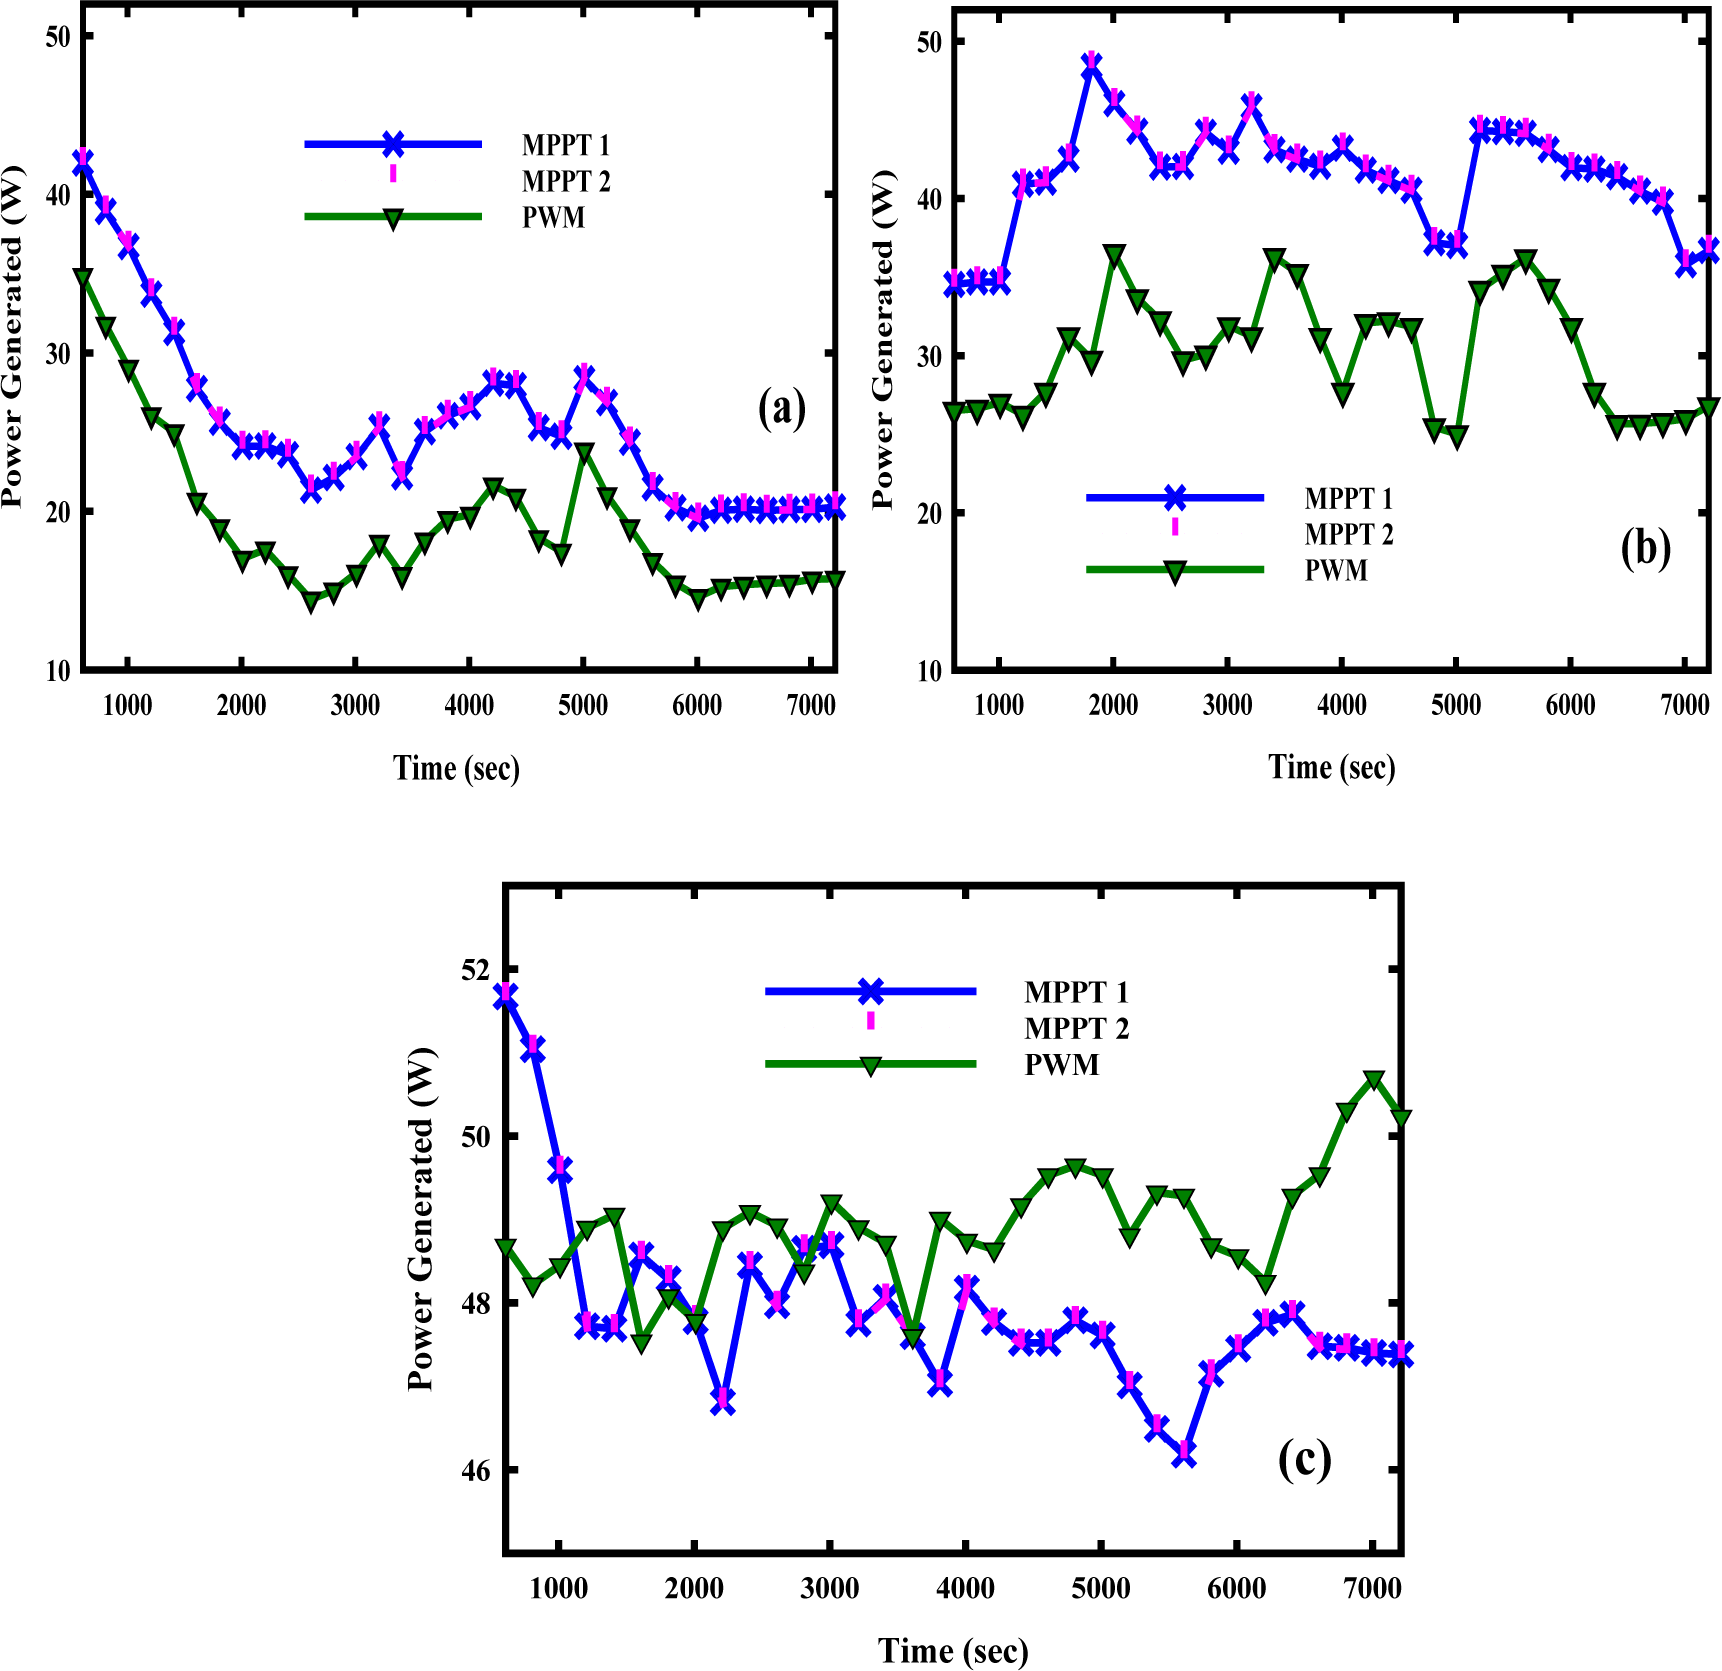
In the figures the effect of irradiance is standardized and the plots were normalized by equating the output currents to those obtained at 1 kW/m2. The trends shown hence are only a result of differences in cell temperatures. The power generated is plotted against time intervals. From the trends shown in the figure, the two MPPTs have indistinguishable performances, resulting in an overlap in their plots. Following the trends shown in Figure 6a the average power generated by the MPPTs is 34.51 W and 34.49 W, and that generated by the PWM charge controller is 19.83 W. Based on the average power generated for November, the MPPT charge controllers have a 27.02% additional power over the PWM charge controller. In Figure 6b the average power generated by the MPPT charge controllers is 45.88 W and 45.87 W, and that generated by the PWM charge controller is 26.72 W, the MPPTs charge controllers have a 26.4% additional power over the PWM charge controller for the month. Despite the two months falling under months with moderate temperatures, the power generated in December is higher than that of November because December has higher solar irradiance than November. Furthermore, the percentage of additional power between the MPPT and the PWM charge controller is higher in November, because the ambient temperatures are slightly higher in December than in November. In the case of Figure 6c, the average power generated in January by the MPPTs charge controllers is 49.10 W and 49.08 W, and that generated by the PWM charge controller is 48.77 W. The MPPTs charge controllers have an additional power of 0.34% over the PWM charge controller. These results show clearly that there is a decrease in the MPPTs’ additional power over the PWM in January than the other two months due to the reported high cell temperatures. This is expected because, from the available literature MPPT charge controllers are 30 to 40% more efficient than the PWM charge controllers at low temperature [23]. With high cell temperatures, MPPTs are unable to track the maximum power point (MPP) of the photovoltaic modules [6], which results in decreased performance efficiency. Furthermore, the MPP point shifts closer to the battery voltage making no significant difference.
Figure 7 presents the results of cumulative energy generated every week in each month for the two MPPT charge controllers and a PWM charge controller, under moderate and high-temperature field conditions. The difference in performance between MPPT and the PWM charge controllers is shown as a percentage for every week for the three months. Additionally, the effects of ambient temperatures which result in increased PV module’s cell temperature consequently affecting the performance of the MPPT, [5], [23] are verified.
Energy Generated under Moderate and High- Temperature Conditions (a) November, (b) December representing moderate temperature case, and (c) January for the high temperature cases
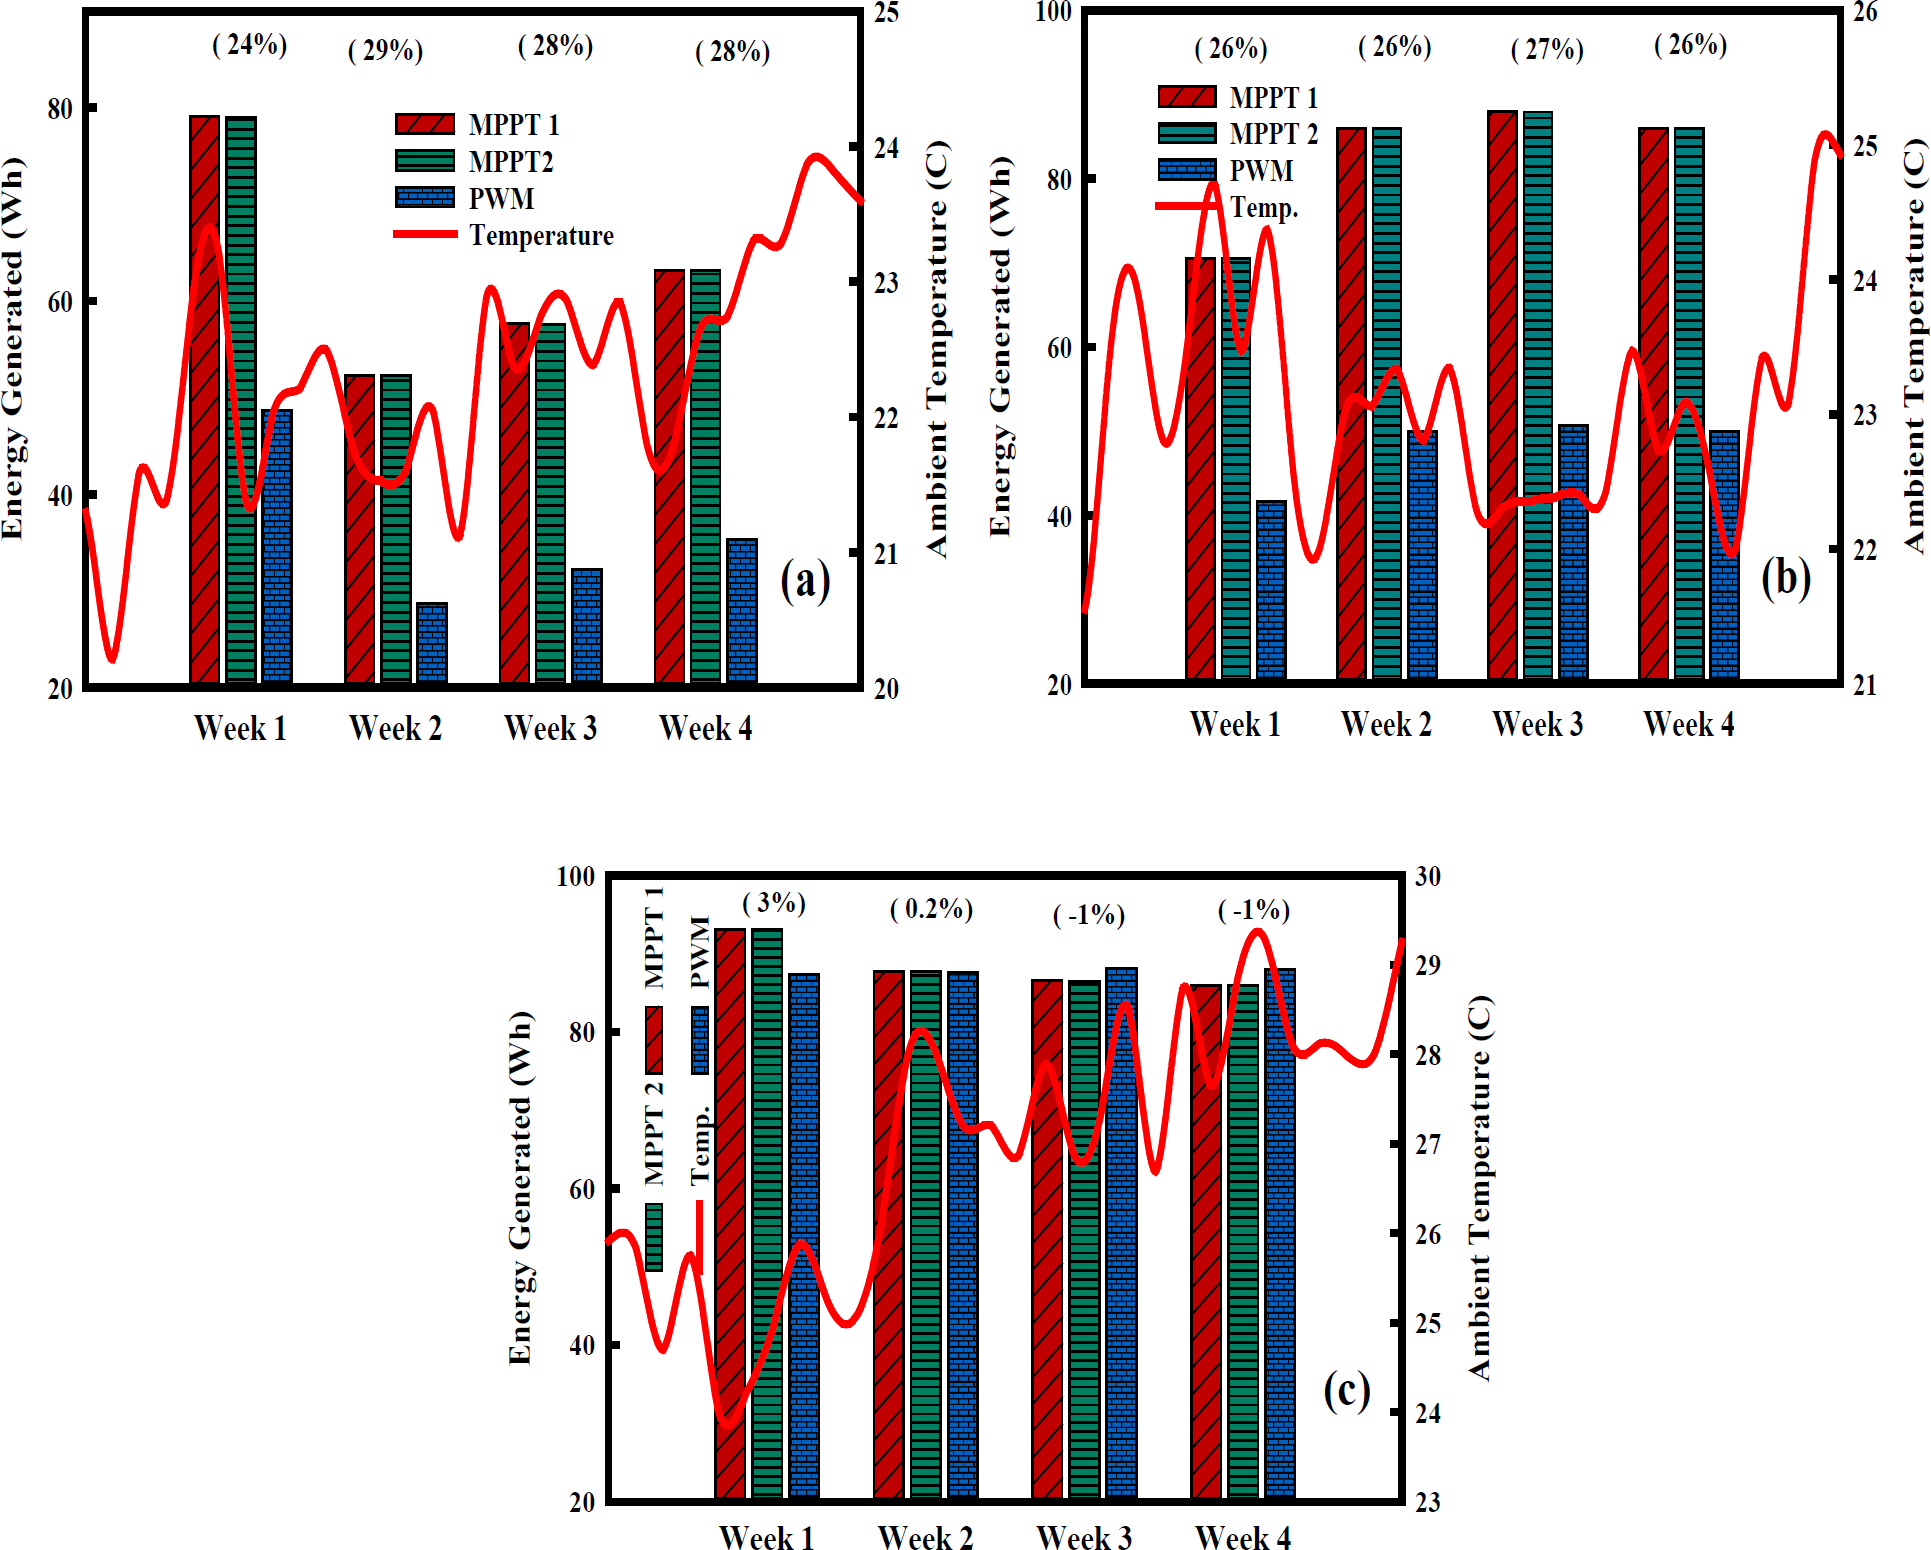
From the analysis of Figure 7a representing the month of moderate temperatures, week 1 has the highest amount of generated energy, because it accounted for the week with high solar irradiance compared to the other weeks of that month. This may also imply slightly higher cell temperatures and hence a lower additional efficiency. Similar trends are observed in weeks 2, 3, and 4 where the additional efficiency from the MPPTs is 29%, 28%, and 28%, respectively.
From the analysis of Figure 7b week 3 has the highest amount of generated energy because it accounted for the week with high solar irradiance and lowest ambient temperatures compared to the other weeks of that month. The performance of the MPPTs charge controllers at moderate temperatures concurs with the study of [5].
On the other hand, Figure 7c represents January the month with high-temperature conditions and irradiance. This month generated the highest amount of energy than the other two months due to its high solar irradiance. As shown, week 1 has the highest amount of generated energy. Furthermore, it has the highest percentage of additional energy from the MPPT charge controllers. Weeks 3 and 4 recorded the lowest amount of energy generated by the MPPT charge controllers throughout the weeks in January because those weeks had the highest ambient temperatures. In those weeks, the PWM charge controller surprisingly had an additional energy efficiency of 1% over the MPPT charge controllers. The presented results show clearly that high ambient temperatures affect the performance of MPPT charge controllers, which concurs with the study of [23]. It is important to further mention that the modules used in this experiment were the standard 36-cell modules where the PV voltage is matched to the 12 V battery. Otherwise, the MPPT would still yield additional advantages when/if modules with a higher number of cells (higher voltage) are concerned.
The performance of the MPPT charge controller under moderate and high-temperature conditions was investigated. Two MPPT charge controllers of different models were investigated and a PWM charge controller was used as the reference, to be able to ascertain the changes that occurred in the performance of the MPPT charge controller as temperatures increased. Under moderate temperatures, the MPPT charge controllers delivered close to 30% more energy than the PWM charge controller, which was in agreement with the available literature. Under high temperatures, the performance of MPPT charge controllers gradually declined as cell temperatures rose. At cell temperatures of 52 °C, the MPPT significantly lost its additional advantage and efficiency as its performance decreased to equal that of the PWM charge controller. From the experiments carried out and the analysis made, the impact of the MPPT becomes insignificant at high temperatures especially those experienced in tropical regions. Therefore, for small systems such as solar home systems (SHS) where standard PV modules are employed in remote areas with relatively high temperatures, the costs of ordinary PWM against the MPPT are an important factor of consideration.
The authors declare no known conflict of interest as to the publication of this article.
This study was supported by the Federal Ministry for Economic Cooperation and Development (BMZ) through the financing accorded to AH for his master study (Grant Ref. 91813306). The authors also express their gratitude to the Department of Energy, Gas and Petroleum Engineering of Kenyatta University for providing research facilities.
| AC | Alternating Current |
| ACO | Ant Colony Optimization |
| ANFIS | Adaptive Neuro-Fuzzy Inference System |
| CS | Computer Simulation |
| DC | Direct Current |
| DPSO | Discrete Particle Swarm Optimization |
| DWC | Direct Water Cooling |
| FLC | Fuzzy Logic Control |
| GA | Genetic Algorithm |
| GMPP | Global Maximum Power Point |
| GP | Global Peak |
| HC | Hill Climbing |
| IC | Integrated Circuit |
| In Cond. | Incremental Conductance |
| SCC | Short Circuit Current |
| IR | Infrared Region |
| LMPP | Local Maximum Power Point |
| MATLAB | Matrix Laboratory |
| MPP | Maximum Power Point |
| MPPT | Maximum Power Point Tracking |
| MPSO | Modified Particle Swarm Optimization |
| MRE | Mean Relative Error |
| MRF | Maximum Renewable Factor |
| OCVC | Open Circuit Voltage Control |
| PI | Power and Current |
| PV | Photovoltaic |
| PSC | Partial Shading Conditions |
| P&O | Perturbation and Observation |
| PWM | Pulse Width Modulation |
| RBFNN | Radial Basis Function Neural Network |
| TEG | Thermoelectric Generator |
- ,
Implementation of the novel temperature controller and incremental conductance MPPT algorithm for indoor photovoltaic system ,Sol. Energy , Vol. 163 ,pp 235–242 , 2018, https://doi.org/https://doi.org/10.1016/j.solener.2018.02.018 - ,
Electromagnetic spectrum analysis and its influence on the photoelectric conversion efficiency of solar cells ,J. Nanosci. Nanotechnol. , Vol. 16 (6),pp 6037–6043 , 2016, https://doi.org/https://doi.org/10.1166/jnn.2016.12386 - ,
Development and comparison of an improved incremental conductance algorithm for tracking the MPP of a solar PV panel ,IEEE Trans. Sustain. Energy , Vol. 7 (4),pp 1421–1429 , 2016, https://doi.org/https://doi.org/10.1109/TSTE.2016.2556678 - ,
A comprehensive comparison of different MPPT techniques for photovoltaic systems ,Sol. Energy , Vol. 112 ,pp 1–11 , 2015, https://doi.org/https://doi.org/10.1016/j.solener.2014.11.010 - ,
Solar Charge Controllers using MPPT and PWM: A Review ,ADBU J. Electr. Electron. Eng. , Vol. 2 (1),pp 1–4 , 2018 - , Combining PV MPPT algorithm based on temperature measurement with a PV cooling system, Int. Conf. Signal Process. Commun. Power Embed. Syst. SCOPES 2016 - Proc., 2017
- ,
Meta-heuristic optimization techniques used for maximum power point tracking in solar pv system ,Electron. , Vol. 10 (19),pp 1–57 , 2021, https://doi.org/https://doi.org/10.3390/electronics10192419 - ,
Study of Maximum Power Point Tracking (MPPT) Techniques in a Solar Photovoltaic Array ,GRD J. Eng. , Vol. 2 , 2017 - ,
Evaluation of thermal interface materials in mediating PV cell temperature mismatch in PV–TEG power generation ,Energy Reports , Vol. 7 ,pp 1636–1650 , 2021, https://doi.org/https://doi.org/10.1016/j.egyr.2021.03.015 - ,
Investigation of MPPT Techniques under Uniform and Non-Uniform Solar Irradiation Condition-A Retrospection ,IEEE Access , Vol. 8 ,pp 127368–127392 , 2020, https://doi.org/https://doi.org/10.1109/ACCESS.2020.3007710 - ,
MPPT techniques for photovoltaic applications ,Renewable and Sustainable Energy Reviews , Vol. 25 ,pp 793–813 , 2013, https://doi.org/https://doi.org/10.1016/j.rser.2013.05.022 - ,
Comparisons of MPPT performances of isolated and non-isolated DC-DC converters by using a new approach ,Renew. Sustain. Energy Rev. , Vol. 60 ,pp 1100–1113 , 2016, https://doi.org/https://doi.org/10.1016/j.rser.2016.01.128 - ,
Review of the best MPPT algorithms for control of PV sources: RUCA tracking algorithm ,ICINCO 2017 - Proc. 14th Int. Conf. Informatics Control. Autom. Robot. , Vol. 1 ,pp 318–325 , 2017, https://doi.org/https://doi.org/10.5220/0006461503180325 - ,
Comparison of Charge Controllers on PV Panel Performance: An Experimental Study ,Int. J. Adv. Electron. Electr. Eng. , Vol. 3 (3),pp 121–125 , 2014 - , A Comparative Study of MPPT and PWM Solar Charge Controllers and their Integrated System, in Journal of Physics: Conference Series, 2020
- ,
A simplified phase-shift PWM-based feedforward distributed MPPT method for grid-connected cascaded PV inverters ,Sol. Energy , Vol. 187 ,pp 1–12 , 2019, https://doi.org/https://doi.org/10.1016/j.solener.2019.05.021 - ,
Performance comparison between PWM and MPPT charge controllers ,Sci. Tech. , Vol. 24 (1),pp 6 , 2019, https://doi.org/https://doi.org/10.22517/23447214.20681 - , Improving the Performance of Photovoltaic Panels Using a Direct Water Cooling System, 20222023
- , Energy Flow Management in a Smart Microgrid Based on Photovoltaic Energy Supplying Multiple Loads, 2024
- , Novel Design of Hybrid Single Slope Solar Distiller with Photovoltaic Powered Thermoelectric System, 2024
- , Nairobi Climate Profile: Full Technical Version, IIED, KCL, 2017
- , A MPPT approach based on temperature measurements applied in PV systems, 2010 9th IEEE/IAS Int. Conf. Ind. Appl. INDUSCON, 20102010
- ,
Solar Charge Controller ,Int. J. Acad. Res. Dev. , Vol. 2 (6),pp 994–1001 , 2017


