The need to reduce energy costs has become increasingly important for enterprises due to rising energy prices in recent years. According to the German Association of Energy and Water Industries (BDEW) price analysis for Germany, electricity prices for industrial customers increased by 75% between 2013 and 2023 [1]. However, recent studies indicate that there is still a high potential for energy savings in the industrial sector [2]. Some studies identified untapped potential for cost-effective energy savings in non-energy intensive industries (cf. International Energy Agency-IEA & Organization for Economic Co-operation and Development-OECD (2018) [3]) and specifically in small and medium-sized enterprises (SMEs) (cf. Institute for Resource Efficiency and Energy Strategies-IREES (2013) [4] and PricewaterhouseCoopers-PwC (2015) [5]). SMEs are defined by the European Union (EU) directive 2003/361/EG by quantitative factors (number of employees (< 250), annual turnover (< 50 M€) and annual balance sum (< 43 M€) [6]. In-depth energy system analyses and high quality energy audits have been proved to be valuable tools to address the untapped potential in enterprises [7].
Individually, SMEs consume small amounts of energy but collectively their energy demand is profound. According to IEA estimates, SMEs consume more than 13% of total global energy demand [8]. In total, more than 22.5 million companies in the EU-27 are SMEs, representing 99.8% of all companies [9]. Although being such important actors in terms of their energy use and potential for energy savings, SMEs are largely overlooked by current energy efficiency policy in the EU [10]. With the introduction of the Energy Efficiency Directive (EED, 2012/27/EU) in 2012, the European Commission (EC) requires Member States to oblige large companies to regularly conduct mandatory energy audits unless they implement an energy management system and encourage SMEs to also undergo energy audits [11]. However, as there is no obligation to conduct energy audits in SMEs, a large energy reduction potential remains untapped.
Albeit a wide range of cost-effective energy efficiency measures are available (cf. [12]), their implementation is lacking due to SME-specific barriers. Fawcett & Hampton (2020) [10] conclude with two overarching findings that are particularly relevant to SMEs regardless of sector: First, energy management functions are often concentrated on one single of very few individuals. Thus, individual beliefs and values of these persons are particularly important for SMEs’ energy management decisions. Second, SMEs tend to have less time and technical skills to consider energy efficiency opportunities and process relevant information [10]. Additionally, SMEs often do not have access to or use basic energy data (cf. [13]) nor do they have sufficient information on their energy costs [14]. Without using state of the art sensors and meters to monitor and control their energy consumption, SMEs are “data poor” and lack transparency on their energy and load flows [13]. Thus, solutions that address the energy efficiency potential of SMEs should improve an SMEs’ information base, in order for them to take appropriate measures [15].
In this context, digital technologies open up new opportunities [16]. On the basis of technology screening conducted in the research project “Smart Technologies for Enterprises”, Smart Metering and energy monitoring systems were identified as the most promising solutions for SMEs [17]. They enable the collection, visualization and analysis of energy consumption data. Energy consumption data allows SMEs to assess and quantify their savings potential and understand their energy costs. In their energy audit approach for SMEs, Fresner et al. [18] conclude that linking the consumption to its drivers develops an understanding of the origin of energy consumption, the priorities and the potential for reduction. Hein et al. (2018) [19] highlighted that the use of measurement systems can significantly improve energy audits by providing SMEs with an easily accessible visualisation of consumption and representation of key cost drivers.
However, the use of measurement systems requires time and effort. In the context of energy audits, consultants therefore prefer to calculate efficiency measures using projection methods rather than collecting data with a measurement system [19]. Consequently, the systematic and effective use of measurement systems to analyse energy systems can overcome the time / effort barrier and improve the quality of energy audits [20].
Therefore, energy system analysis with mobile measuring technology was identified as a specific solution for SMEs, among other things, due to low installation effort and costs [15]. The use of mobile measuring systems enables the collection and analysis of sub-sectional energy consumption data, such as electrical sub-distributions (SDs) and consumption groups (CGs). The selected mobile measurement technology is specified for electrical power measurements. Mobile measurements with submetering of heat power are far more complex in terms of installation effort [19]. Heat supply systems are also more heterogeneous in terms of the technical structure (gas boilers, district heat connection, etc.). Electricity distribution systems, on the other hand, are more comparable across all sectors (cf. [20]). For this reason, the focus has been on electricity-based analyses using mobile measurement technology to develop a generic measurement and analysis approach.
Based on a generic measurement concept outlined in [20], mobile measurement technology can systematically disaggregate load flows of SMEs’ electrical power systems. Once collected in a short-term measurement, submetering data offers substantial benefits in terms of in-depth analyses compared to stationary metering (i.e. with a smart meter) of total consumption. The use of mobile measurement technology in grocery stores (cf. [21]) indicated potential for benchmark analyses and the determination of energy performance indicators (EnPIs). However, previous research has shown that the effective analysis of submetering data is challenging due to the lack of standardized concepts and the limited measurement period [15]. As a result, the submetering datasets just provide status quo information on the energetic condition of the measuring points. Long-term effects and seasonal influences on electricity consumption cannot be derived, as the measurement period varies between one and three weeks.
Literature review shows that there is little research on the effective and systematic data analysis of submetering data based on mobile measurement technology. Existing load profile analysis guidelines focus on the total load and longer time series (i.e. annual consumption data) (cf. [22]). Mechanisms to disaggregate the total load into specific consumption groups (e.g. using AI-based algorithms) have so far been limited to applications in the residential sector (cf. [23]), as the consumption structure of SMEs is too diverse to apply any kind of disaggregation algorithm. Thus, the use of measurement technology to collect submetering data is necessary to perform any kind of consumption disaggregation analysis in SMEs.
This study aims to develop a standardized approach to data analysis using mobile measurement technology in SMEs. Therefore, the present research is framed by the following research questions:
Which data analyses are relevant for a systematic data analysis concept? What are the indicators that trigger these data analyses?
To what extent is the data analysis process generalisable? What are the limitations?
As the data analysis is significantly influenced by the applied measurement concept (cf. [20]), no comparable datasets are available in the literature. Therefore, this research focuses on the analysis of empirically collected submetering data from selected case studies by adopting a qualitative and explorative approach.
The paper is structured as follows. In the next section, the basics of the applied measurement concept are described, the characteristics of the collected submetering data are pointed out, and the main methodical steps towards a standardized data analysis concept are developed. In the results section, based on data analysis approaches from existing research, several systematic data analyses are developed. Furthermore, indicators that trigger each data analysis as well as related limitations are discussed. Finally, the conclusion summarizes the findings of the present research and suggests approaches for future research.
The presentation of the methodology is structured as follows. Firstly, the basics of the applied measurement concept are described. Secondly, characteristics of the empirically collected submetering data are pointed out. Finally, methodological approach towards a standardized data analysis concept is developed.
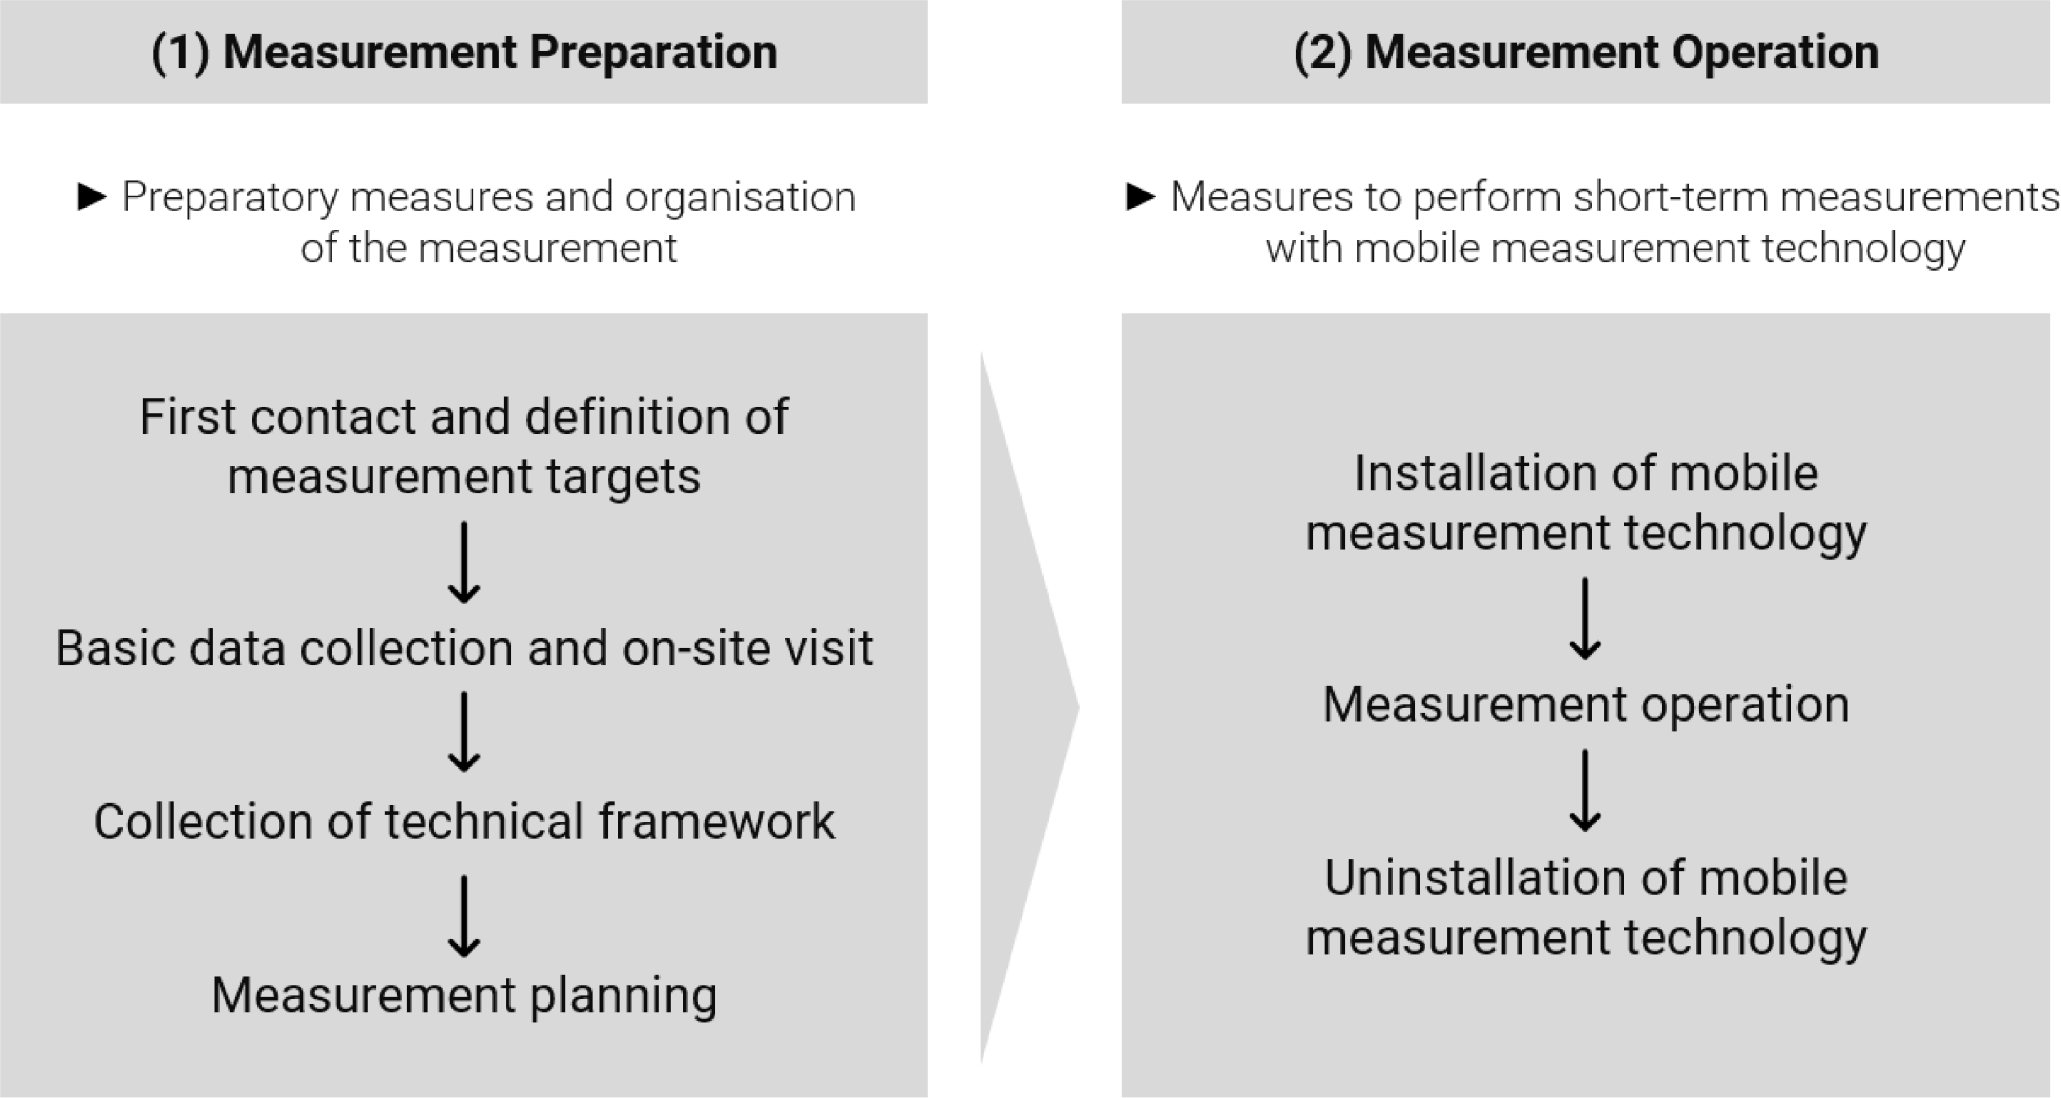
The measurement concept provides a generic methodological framework to use mobile measurement technology for the energy system analysis of enterprises. Accordingly, it ensures the systematic and efficient collection of submetering data for subsequent data analyses. A detailed step-by-step process of data collection linked to the applied measurement concept is provided in [20]. The concept can be divided into two main sections, each of which has several sub-sections. Figure 1 illustrates the measurement concept with the main sections Measurement Preparation (1) and Measurement Operation (2). While step (1) covers preparatory and organizational measures related to the measurement, step (2) describes measures to perform short-term measurements with mobile measurement technology.
Measurement concept to ensure an efficient and systematic use of mobile measurement technology for the energy system analysis (adopted and further developed from [20])
The mobile measurement technology is temporarily installed; that is, short-term measurements are conducted for up to three weeks. Due to this time limitation, it is important to consider operational processes during the measurement (e.g. high order volume leading to high consumption). In addition, data validation is necessary to ensure reliable data for the subsequent analysis process. As a further technical requirement, remote access to the submetering data ensures plausibility checks during the measurement and facilitates data export from a Structured Query Language (SQL)-server [21].
The applied mobile measurement technology was selected based on specific criteria (cf. detailed criteria evaluation in [15]). First, the more consumers are measured in parallel, the more effective the disaggregation of consumption. Therefore, a measurement case was selected that allows the parallel measurement of up to six three-phase consumers. Second, electrical power systems in enterprises are often divided into several physically separated sub-distributions. Accordingly, the measurement system consists of three measurement cases, raising the maximum number of parallel measurable consumers to 18. As a result, the measurement system is flexible in its range of applications – an important aspect when dealing with the heterogeneous application field of SMEs [16].
Three-phase electrical consumers can be measured inductively without interrupting the power supply system by installing Rogowski coils or split-core current transformers on each phase. The conductor current (primary side) induces a proportional current signal on the secondary side of the transducer [24]. This signal is then transferred to the measurement controller and converted into digital data. Additionally, the voltage signal is tapped from the enterprises’ electricity network. Thus, the average active power consumption Pavg in a time period T equals the product of voltage (U), current (I) and power factor φ (cosine of the phase angle between current and voltage) [25]:
(1)
The total power consumption of a three-phase consumer can be calculated by adding the active power consumption of the three phases [26]. The measurement system records the data per second and stores it into databases on an SQL-server (assuming stable data reception). Aggregated data is also recorded to facilitate data access (e.g. 15-minute averages).
Concerning measurement priorities, Pareto principle is applied; that is, consumers responsible for 80 % of the total electricity consumption are identified [27]. The measurement concept thus follows a top-down approach. Starting at the low voltage main-distribution (LVMD), the load flows of connected sub-distributions (SDs) and consumption-groups (CGs) are measured. This allows to structure electrical power systems into specific levels as illustrated in Figure 2. Whereas data series of sites or areas usually represent a mix of different electrical consumers, CGs supply technical devices with identical characteristics or intended use. Thus, the most detailed information on consumption behavior can be obtained from a single measured consumer (e.g. a supply air motor in a ventilation system).
Breakdown of company structure and corresponding levels of the electrical distribution
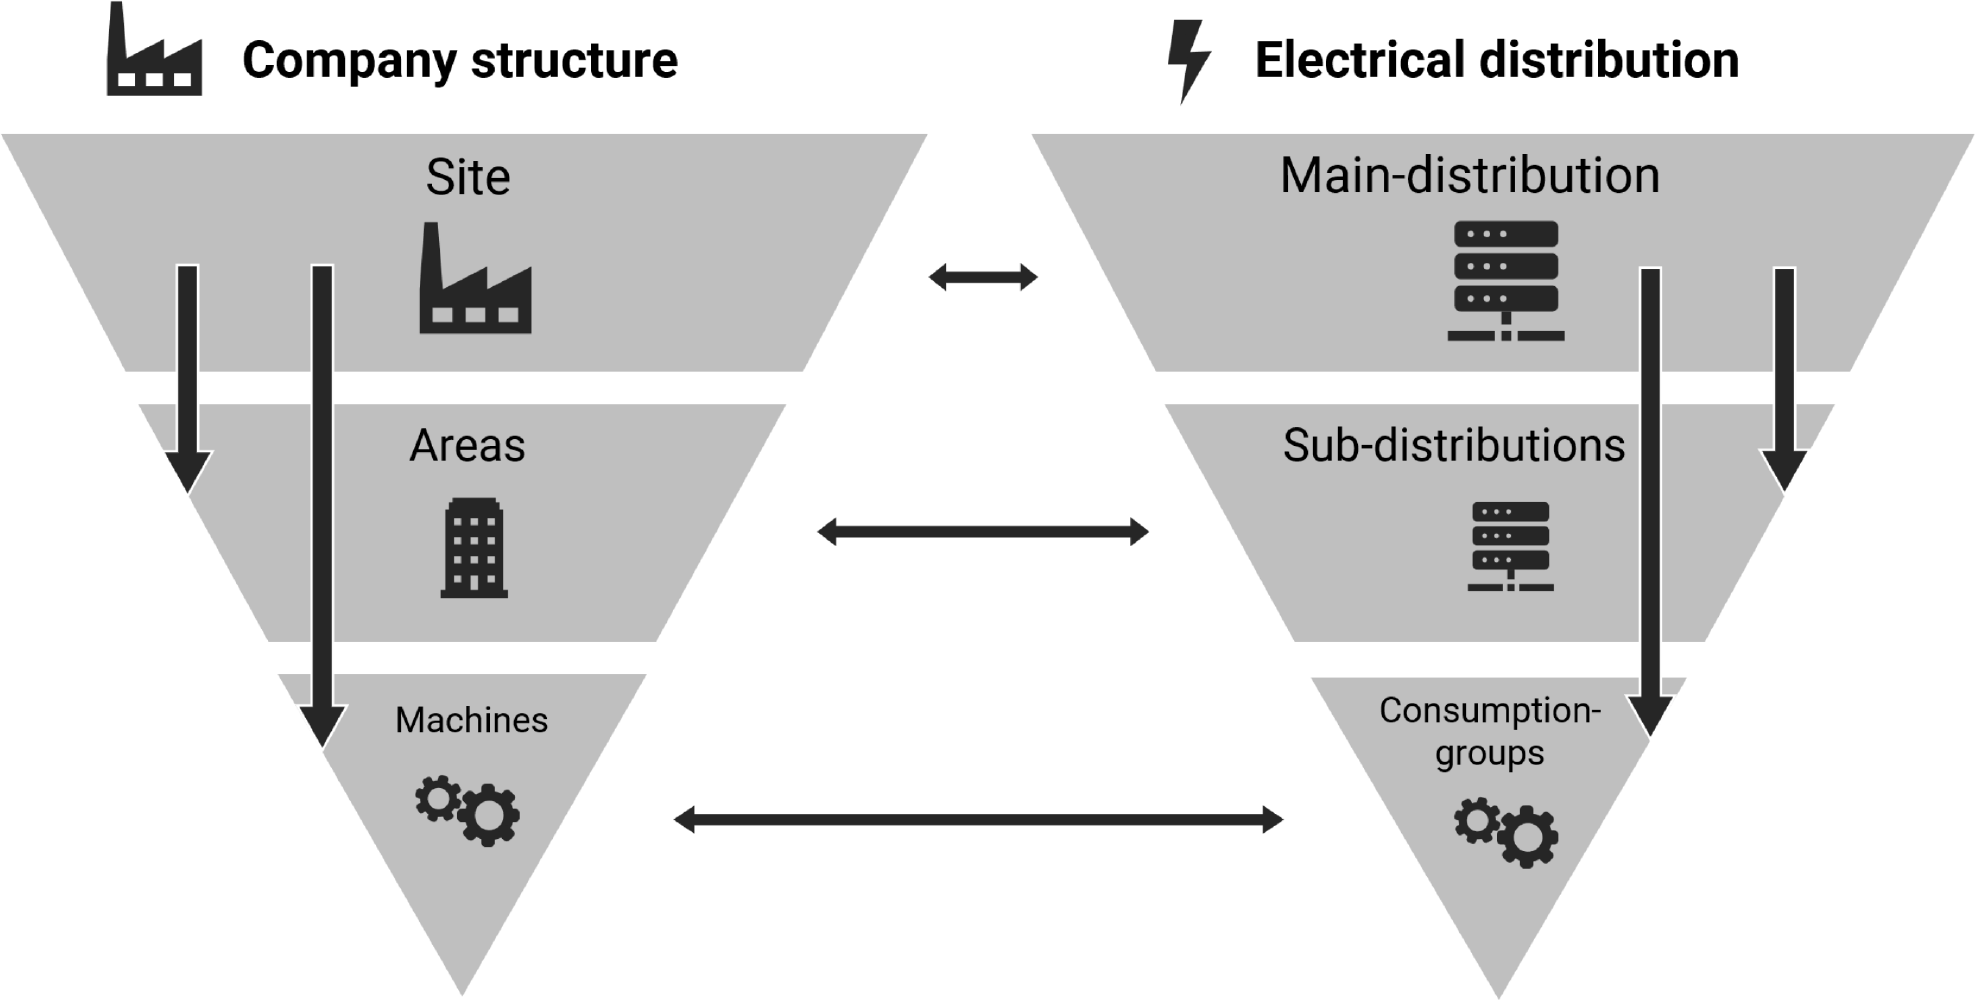
The measurement concept aims to disaggregate the electrical distribution of each level as well as possible. Therefore, both input load flows (e.g. the total load flow of a main distribution) and output load flows (e.g. several SDs or CGs) of each level are measured simultaneously. Taking these measurement principles into account, a prepared submetering dataset is formatted as shown in Table 1. Therein, time stamp describes the duration of the measurement from start date (t1) to the end (t2). For the application of the standardized data analyses to be developed, a measurement resolution of 15 minutes is set as standard. The other columns contain the active power data P of n measured main-distributions (MDs), sub-distributions (SDs) and consumption-groups (CGs). The prepared submetering dataset thus contains both input load flow and several output load flows recorded in parallel.
Formatting of a prepared submetering dataset
| time stamp | MDn (kW) | SDn (kW) | … | CGn (kW) |
|---|---|---|---|---|
| t1 | PMD (t1) | PSD (t1) | … | PCG (t1) |
| … | … | … | … | … |
| t2 | PMD (t2) | PSD (t2) | … | PCG (t2) |
Due to the limited measurement period, the submetering data just represent a snapshot of the current energetic condition of the enterprise. Therefore, data validation is necessary before the data analysis process. This can be done either by comparing the submetering data with the utility’s registered metering data (historical data and data during measurement period), or by relating the sum of the output load flows to the input load flow at each measurement location in the hierarchical structure of the electrical distribution (cf. Figure 2). The developed data analyses show individual options for data validation in the results section.
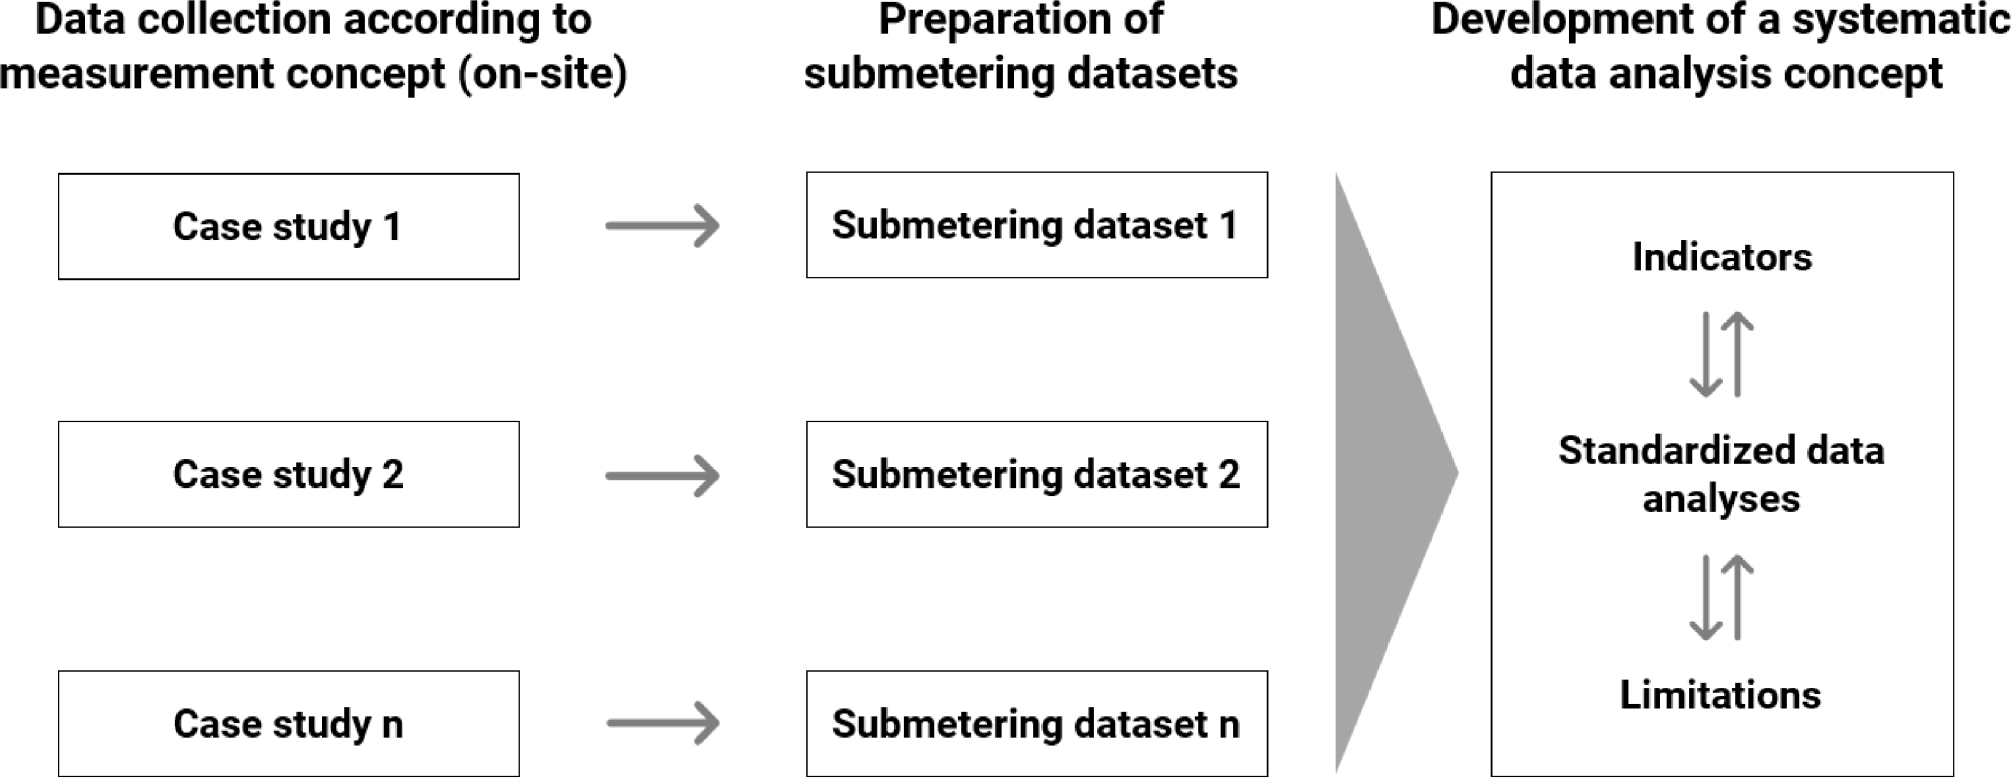
Three main methodological steps are necessary to explore the research questions. Firstly, a series of short-term measurements carried out in enterprises serve as case studies. That is, mobile measurements in office buildings, metalworking industries and ventilation systems are included in this study. Secondly, based on the conducted case studies, submetering datasets are prepared. In a third step, standardized data analyses are developed. Finally, indicators and limitations related to the data analyses are explored and discussed. Figure 3 illustrates the method of the present research.
Method to develop a systematic data analysis concept
The presentation of the results is structured as follows. First, each data analysis is shortly motivated, i.e. by highlighting its general applicability and importance. Second, a procedure for data processing and visualization of the respective analysis is presented. That is, on the basis of prepared submetering datasets from case studies, the analyses are carried out exemplarily. Finally, options for data validation are presented for the respective analyses.
Results point to four standardized data analyses. Consumption disaggregation, base load disaggregation and peak load disaggregation are disaggregation analyses that allocate the total consumption and the active power of the base load and peak load to the measured distributions and electrical consumers. Load profile characterization allows to describe the operating conditions and behavior of electrical distributions and electrical consumers.
The submetering datasets allow to disaggregate the total consumption (e.g. of a main distribution or sub-distribution) to individual sections (e.g. building blocks, electrical SDs or CGs). Thus, a basic understanding of the origin of energy consumption is created (cf. [18]). Furthermore, consumption disaggregation aims to identify significant energy users (SEUs), i.e. sections, areas or consumers that account for a large share of total consumption. These areas can then be targeted to identify inefficiencies and define appropriate measures.
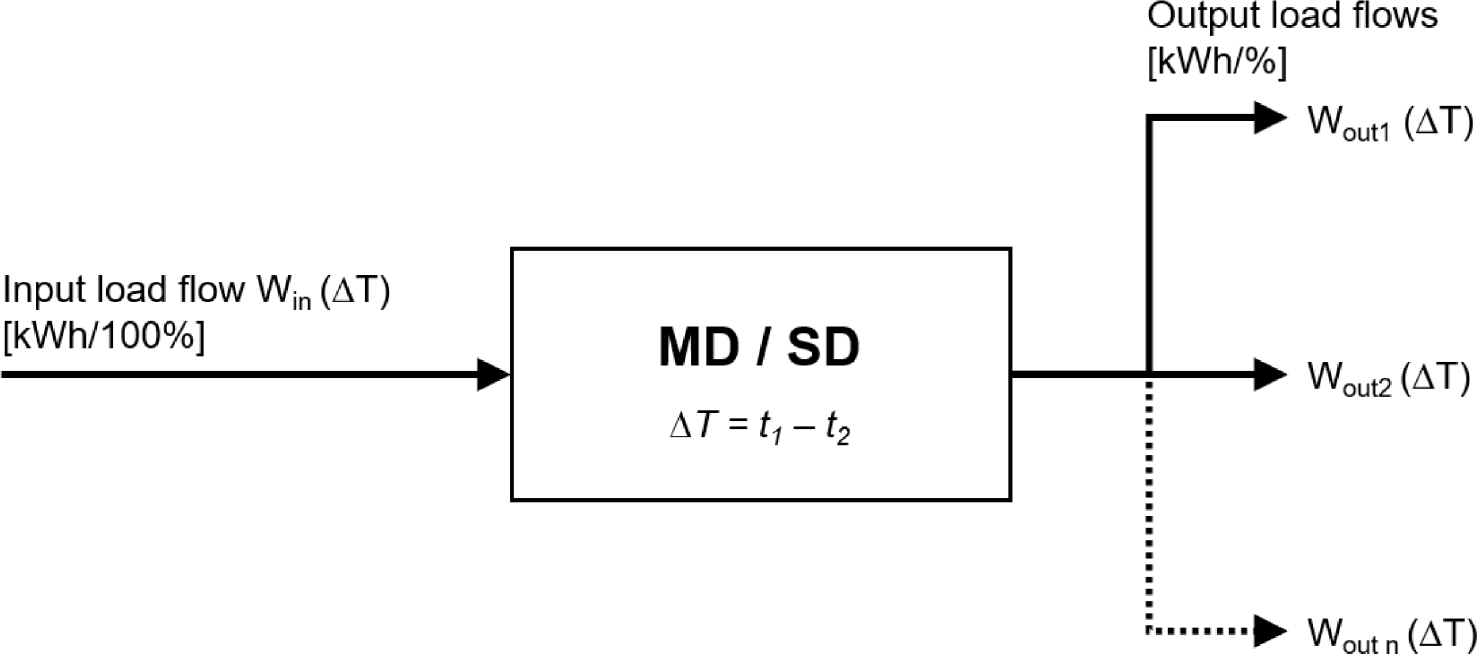
Based on the measurement concept presented, consumption disaggregation can be implemented as follows. At a measured electrical main-distribution (MD) or sub-distribution (SD), the input load flow and several output load flows are measured in parallel. In a time period ∆T (e.g. usually a reference week from the measurement period), the energy consumption of the input load flow Win is allocated to the output load flows Wout n. This can be done in absolute terms (kilowatt hour, kWh) or as a percentage of the input load flow, which is equal to 100%. The basic principle of consumption disaggregation is illustrated in Figure 4.
Basic principle of consumption disaggregation
According to the top-down measurement principle, consumption disaggregation starts at the low voltage main-distribution (LVMD) (cf. Figure 2). From this level, further main-distributions, sub-distributions and consumption-groups are measured. Any further disaggregation of consumption usually requires additional measurements and time. Therefore, the cost-benefit ratio of each additional measurement must be considered when planning the measurement campaign.
Figure 5 visualizes exemplarily the results of consumption disaggregation for an office building using a Sankey diagram. Alternatively, pie charts can be used to illustrate the distribution of load flows. This case study covered the measurement of the building’s main-distribution and its disaggregation to connected SDs and CGs. Thus, several SDs, which supply different areas of the building, and CGs such as server, heating, refrigeration and elevator could be measured. The analysis covers a period of one reference week from the submetering dataset. Accordingly, the total consumption of the main-distribution in the reference week (18,743 kWh) is disaggregated to the recorded measurement points. By disaggregating to almost 100% of the total consumption, this example represents a best-case scenario for this type of analysis.
Consumption disaggregation at the main distribution of an office building visualized in a Sankey diagram
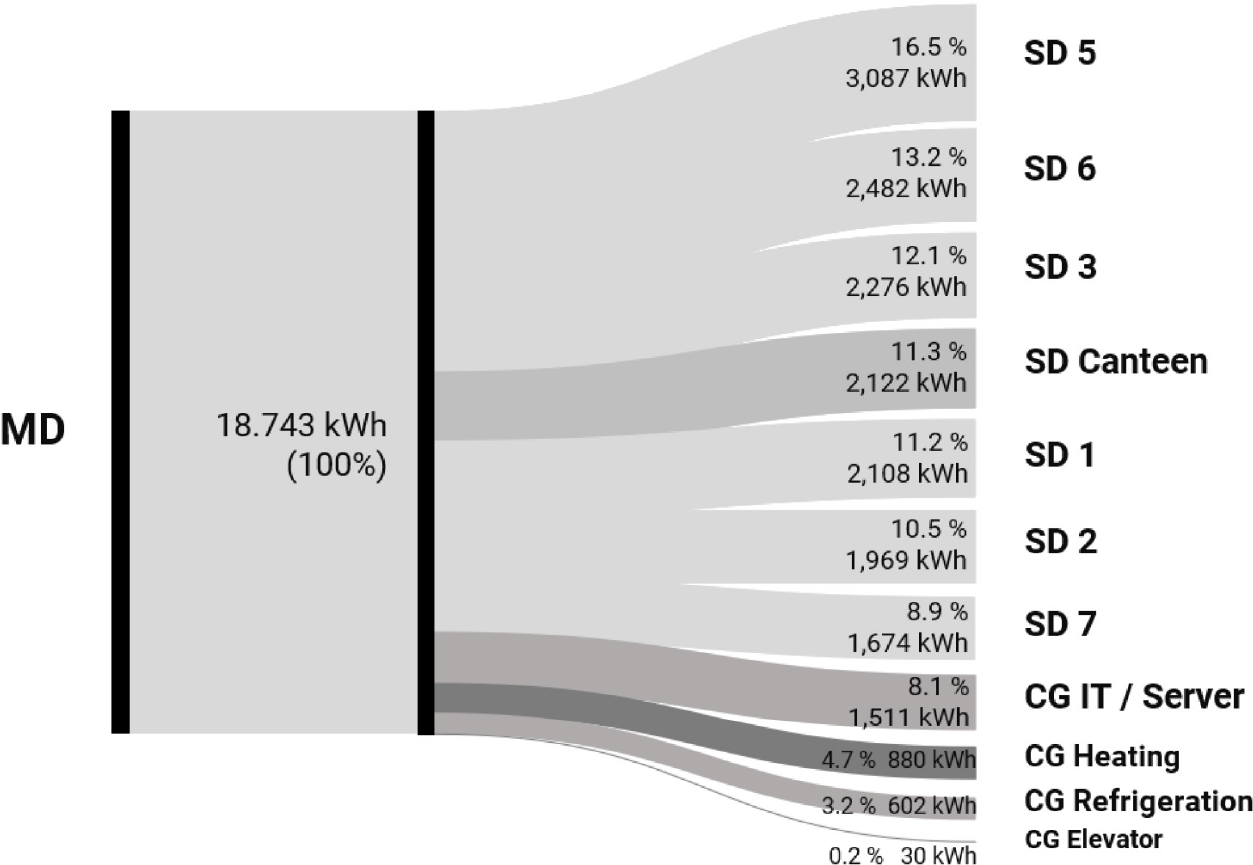
To validate the measurement data, the power consumption of the measured input data series (reference week) was compared with the mean weekly power consumption of historical registered metering data. The results show a deviation of 1.7 % between the measured reference week and the historical mean weekly power consumption, indicating that the defined reference week represents a typical operating behavior of the measurement object. A comparison of the measured power consumption of the reference week with registered metering data during the measurement period shows a deviation of 3.4 %. Since this is within the measurement accuracy of the measurement system, it can be assumed that the measurement data is plausible to apply consumption disaggregation to the dataset.
Base load is defined as the permanent minimum load in electric power systems [15]. Thus, there’s a strong economic incentive to reduce base load consumption. Typical base load consumption occurs during off-peak hours, e.g. at night or weekends. However, this depends on the specific operations of the enterprise. As an initial step to reduce base load consumption, consumers responsible for base load consumption must be identified. Data collection and visualization with mobile measurement technology can provide detailed information on base load consumption [15]. Thus, base load disaggregation represents a standardized data analysis for short-term measurements.
In a similar approach to consumption disaggregation, the total base load of a measured level (e.g. MD or SD) is disaggregated (Figure 6). This can be done in a standardized way as follows. First, the average base load of the input load flow Pbase_input and the output load flows Pbase_output are read visually or calculated with a tool. A time range of a reference week or the entire measurement period can be used. Second, both absolute values and percentage shares of each sub-distribution or consumption-group can be visualized as part of the total base load of the input load flow. The individual values and shares can then be used to identify electrical consumers responsible for base load consumption.
Basic principle of base load disaggregation
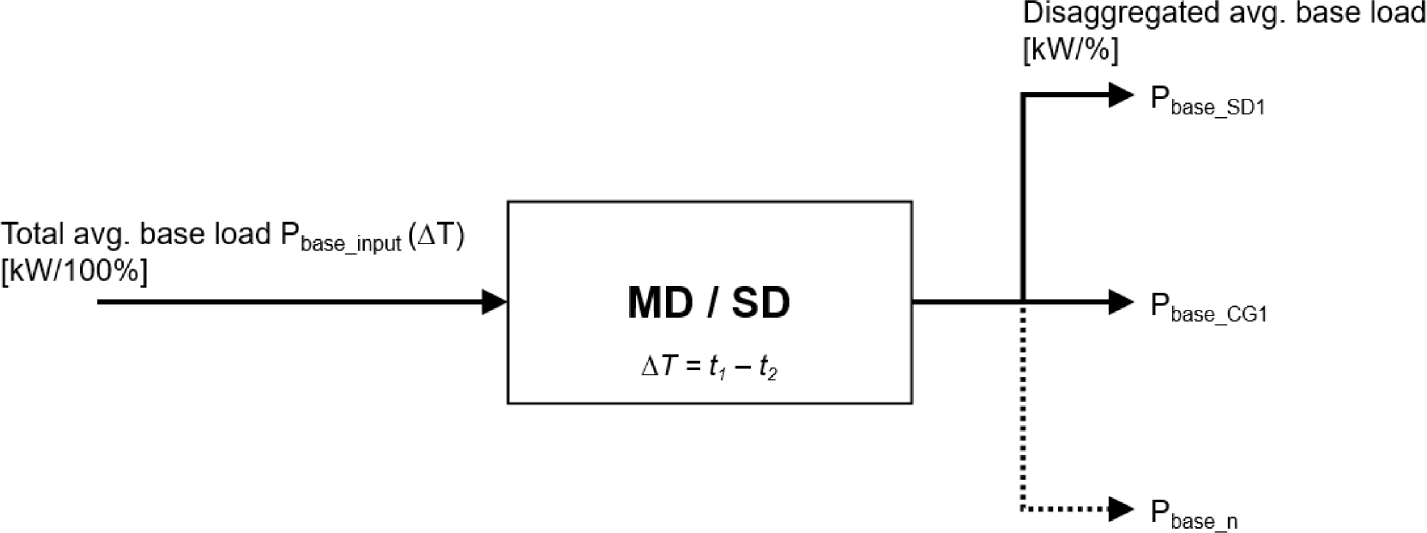
Figure 7 shows exemplarily the results of base load disaggregation in an office building using pie charts. The analysis showed that approx. 55% (26.64 kW) of the total base load can be allocated to the sub-distributions, each of which serves individual areas of the building. Workspaces and office equipment were thus identified as the consumers responsible for most of the total base load consumption. Further relevant base load consumers are the server-room and the refrigeration system responsible for the cooling of the server-room (cf. Figure 7). Base load disaggregation thus provides a first approach to identify relevant base load consumers. In a further step of analysis, load profile characterization can be used to analyse base load consumption in more detail (cf. section load profile characterization).
Base load disaggregation at the main distribution of an office building visualized in pie charts
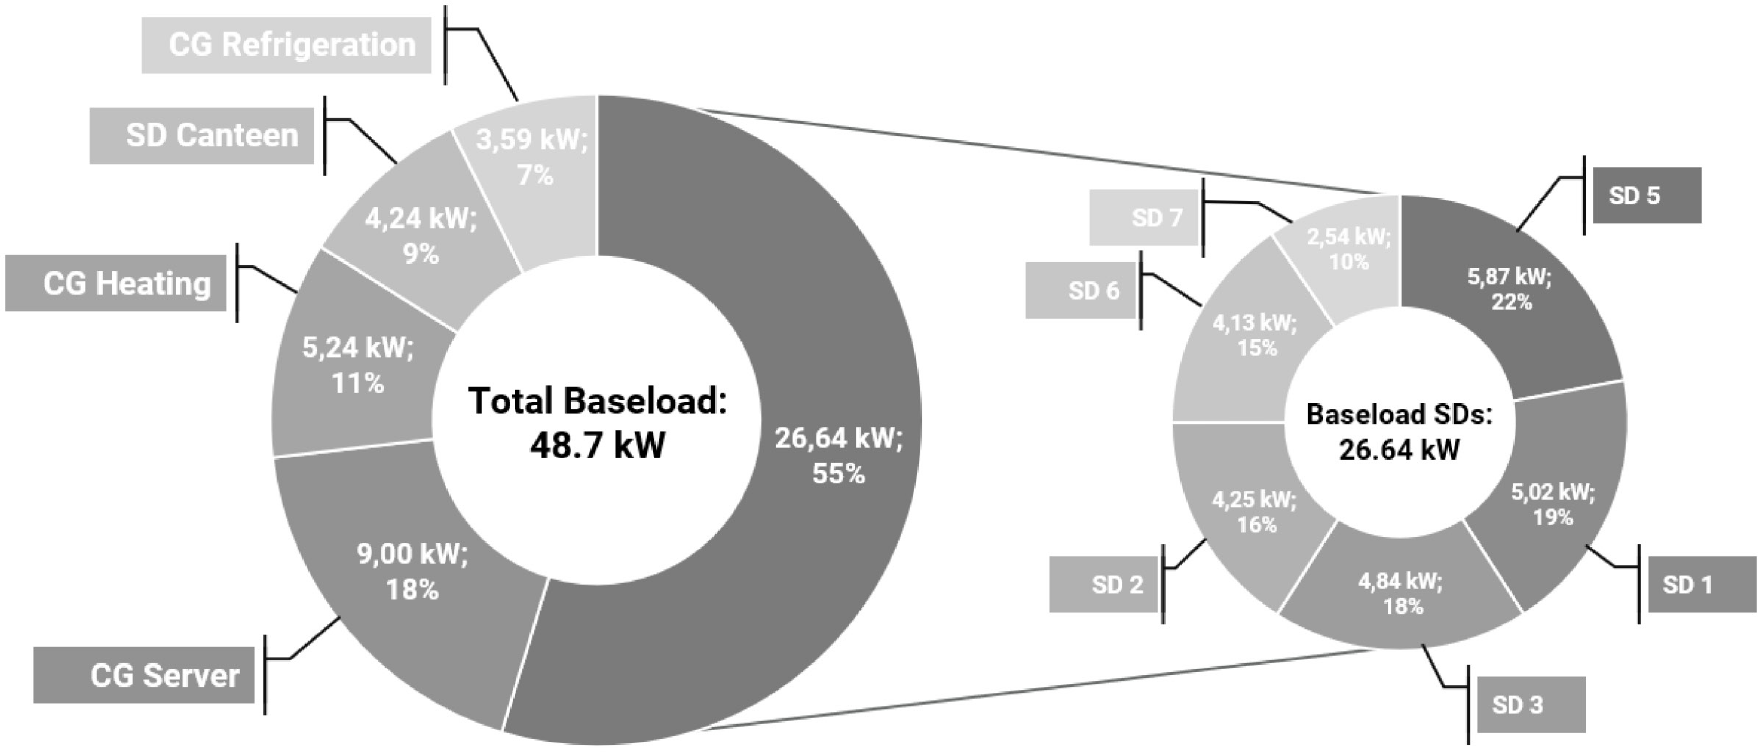
Validation of the measurement data with historical registered metering data from the measurement object indicates that the total base load over the measurement period corresponds to the typical operating conditions of the measurement object (deviation 4.1 %).
In an electric power system, the analysis and reduction of peak loads is particularly important in terms of energy cost savings [15]. In Germany, enterprises with an electricity consumption of more than 100,000 kWh per year are charged with a commodity price (€/kWh) and a capacity charge (€/kW). As the capacity charge depends upon the highest annual energy demand, peak loads have a direct impact on the enterprises’ energy costs. While shifting and reducing peak loads is common practice in enterprises with professional energy management, SMEs have not yet realised their full potential. Thus, the first step is to identify peak loads, i.e. to analyse the time period and frequency of peak loads [28]. In a second step, based on mobile measurement technology and submetering data, peak loads are disaggregated. This allows to identify consumers responsible for peak loads and implement appropriate measures to reduce them.
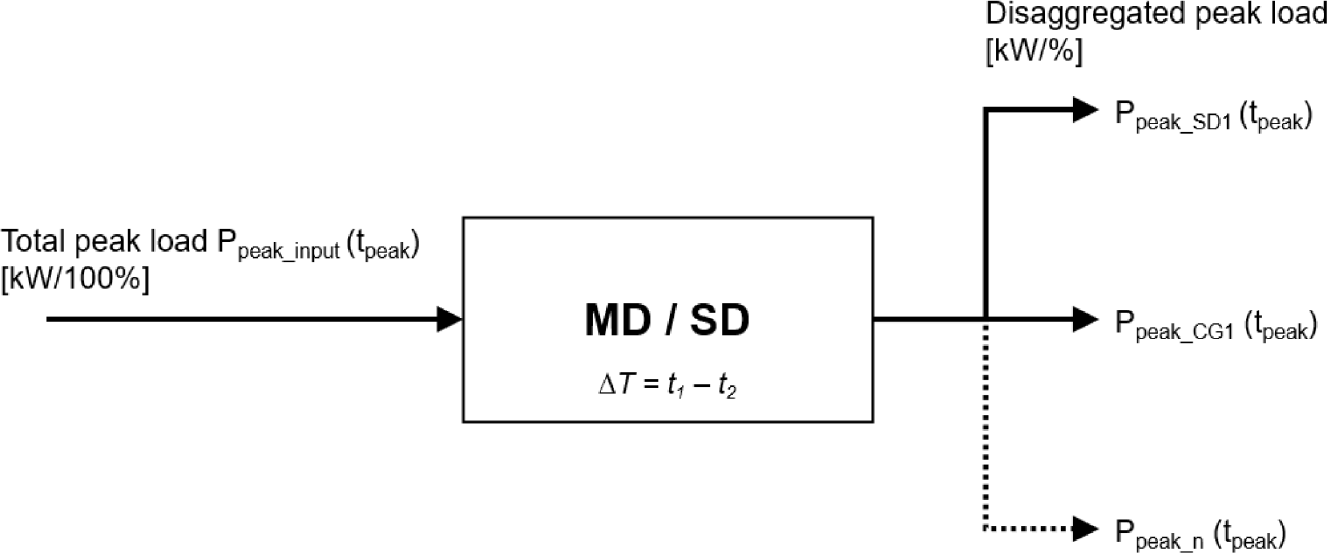
Figure 8 illustrates the basic principle of peak load disaggregation for submetering datasets. The first step is to determine the time tpeak at which the total peak load Ppeak_input of the input load flow of a measured level (e.g. MD, SD) occurred during the short-term measurement. Then the active power of the output load flows Ppeak_n can be disaggregated at time tpeak. To further investigate which sub-distribution or electrical consumer has an increased power consumption at time tpeak, the data immediately before and after the peak load should also be considered. In this way, it is possible to analyse the load gradient of each measuring point that may be responsible for the peak load.
Basic principle of peak load disaggregation
The results of a peak load disaggregation are visualized in a bar chart based on a submetering dataset from a metalworking industry (Figure 9). The peak load (110 kW) of the submetering dataset was recorded at 10:15 am. The bar chart also shows the disaggregation of the loads before and after the occurrence of this peak. Further, the measured sub-distributions and consumption-groups are labelled. In this specific example, peak load can be attributed to an increased load of the compressor and several machines, whereas other consumers such as lighting or the lounge do not have a major impact on the peak load. Accordingly, the consumers responsible for the peak load during the measurement were identified.
Peak load disaggregation at the main distribution of a metalworking industry visualized in a bar chart
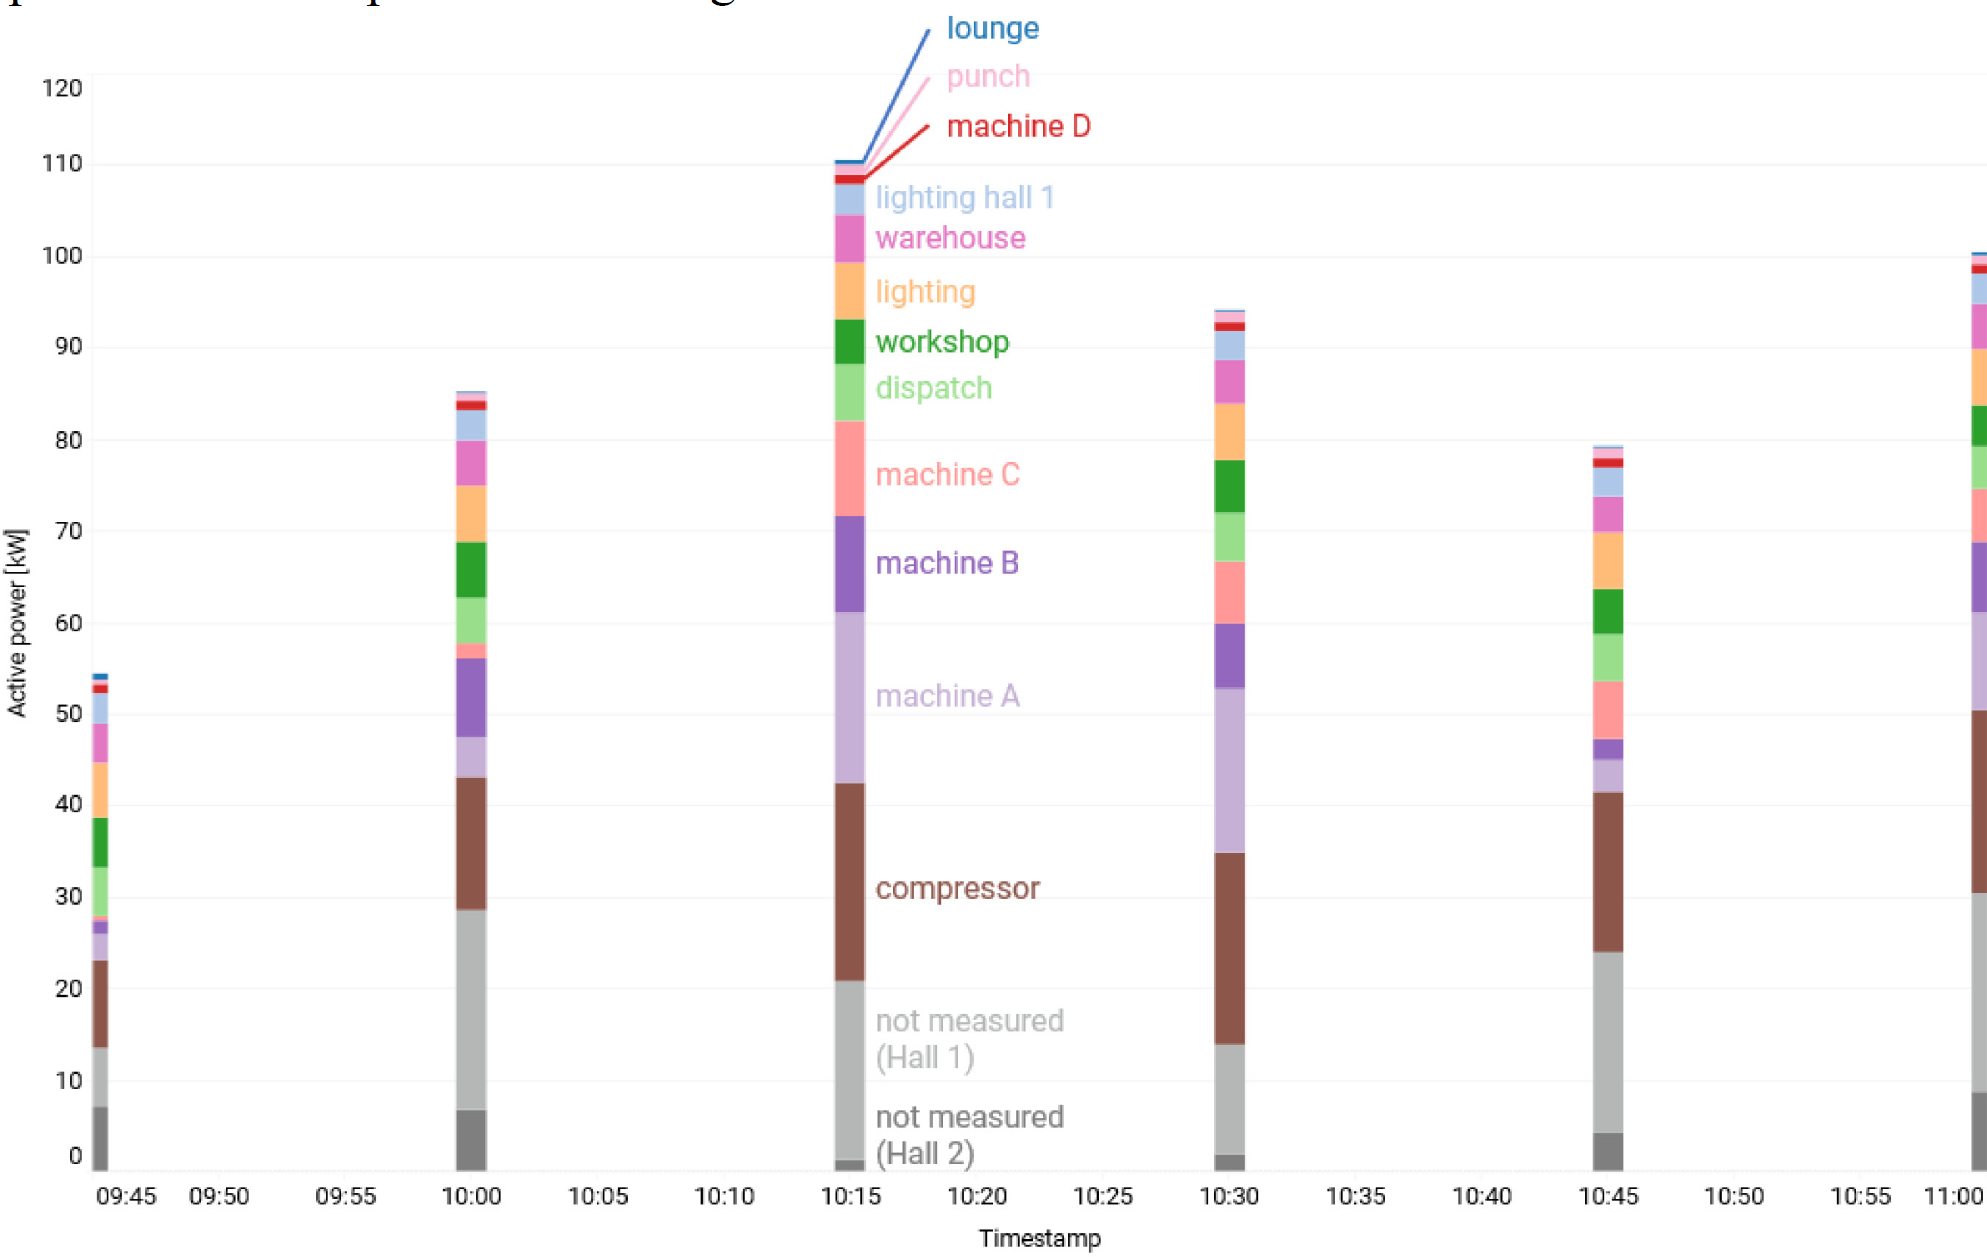
Peak load disaggregation can thus provide a basis for further analysis, such as identifying the flexibility potential of consumers responsible for peak loads.
As just the highest annual peak load is charged in the electricity bill of the energy provider, a comparison between the highest annual peak load (e.g. from historical registered metering data) and the peak loads which occurred during the measurement period is necessary. In the example given in Figure 9, peak loads during the measurement period were about 18 % lower than the highest annual peak load. Nevertheless, peak loads that have occurred can be clearly attributed to electrical consumers, as the example in Figure 9 illustrates.
Due to their temporary usage, mobile measurements provide a snapshot of energy consumption in enterprises. However, previous analyses and case studies indicated that the operating behavior of electrical consumers can be interpreted based on submetering data from short-term measurements [15]. The more precisely the disaggregation of electricity consumption (cf. level structure, Figure 2) the more detailed the analysis of load characteristics [29]. Therefore, the analysis of load characteristics is particularly effective when consumption groups or even single consumers on machine level are measured.
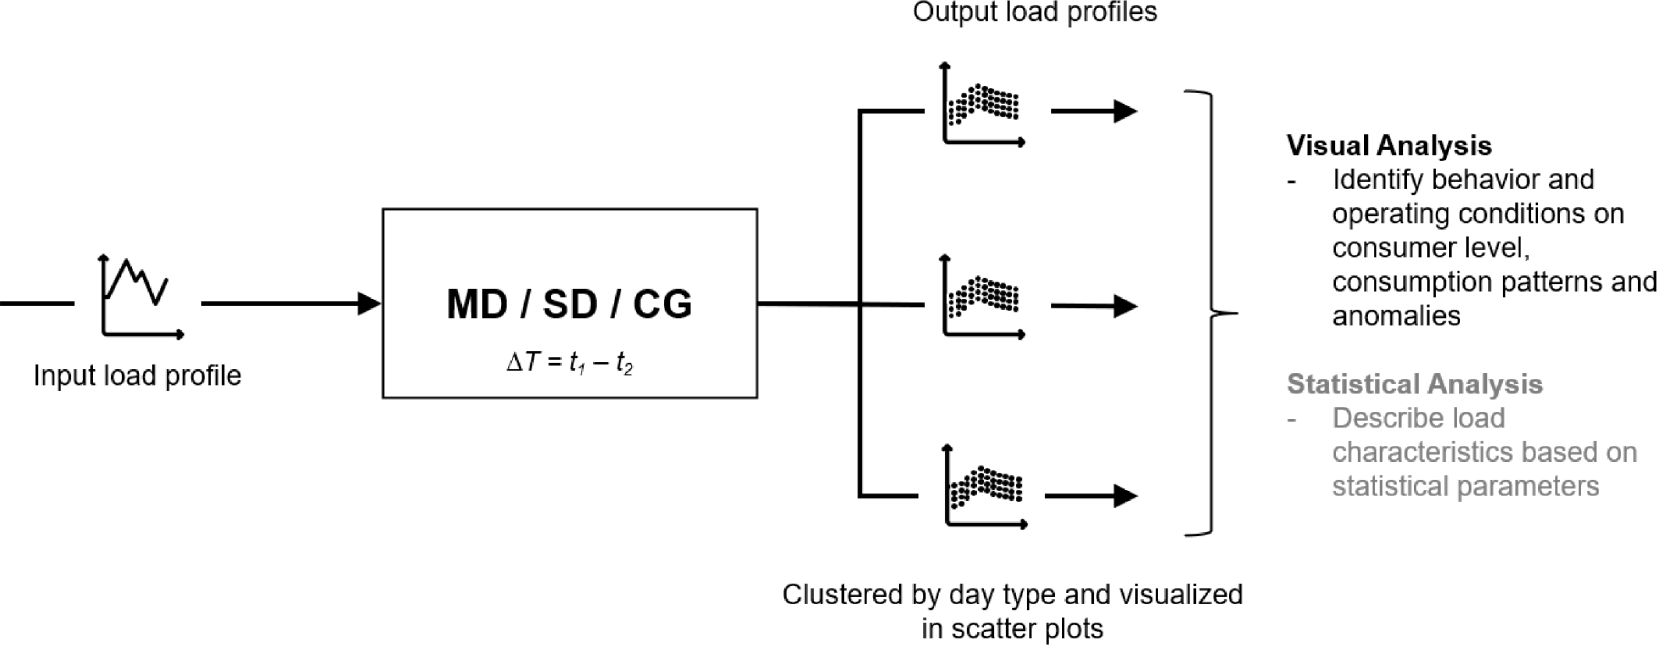
Two steps are required to perform load profile characterization (cf. Figure 10). First, the output load flows of a measured level are clustered by day type and visualized in scatter plots. Clustering is necessary to analyse the operating behavior specifically for each day type cluster (e.g. Monday to Friday vs. Saturday and Sunday). In scatter plots, daily load profiles of each day type cluster are visualized as a set of points. This allows to observe the total dataset of each measured load flow in a single diagram. Subsequently, consumption behavior and operating conditions of the load flows can be analysed through visual observation of the scatter plots. In addition, box plots can illustrate the dispersion of the data at each discrete time value throughout the day. The interquartile range (IQR) can be used as a measure of dispersion of the data at each discrete time value. The IQR [kW] is calculated as the difference between the third quartile Q3 and the first quartile Q1 (2) [30]:
(2)
Thus, 50% of all data points for each discrete time value are always within the IQR. Consumption patterns and anomalies (e.g. outliers) can also be detected based on the IQR calculation. A common approach is to identify the data points outside 1.5 times the IQR as outliers [30]. As the whiskers of the box plot indicate the range Q1 - 1.5 (IQR) and Q3 + 1.5 (IQR), outliers can be detected by visual analysis of the scatter plots.
Basic principle of load profile characterization
Furthermore, scatter plots allow the data series to be categorized by operating and non-operating time. Thus, the behavior of the electrical consumers can be interpreted individually for each timeline. The same applies to the calculation of IQR values as a measure of the average dispersion of the values in the on and off periods.
Statistical analysis of the measurement series has been identified to describe load characteristics based on calculated parameters. Similar to the approach described in Gontarz et al. (2015) [31], load characteristics of sub-distributions and consumption-groups can be described according to these parameters (e.g. constant load vs. controlled constant load vs. variable load). As the statistical analysis is beyond the scope of this paper, future research could address potential and limitations for short-term measurement data.
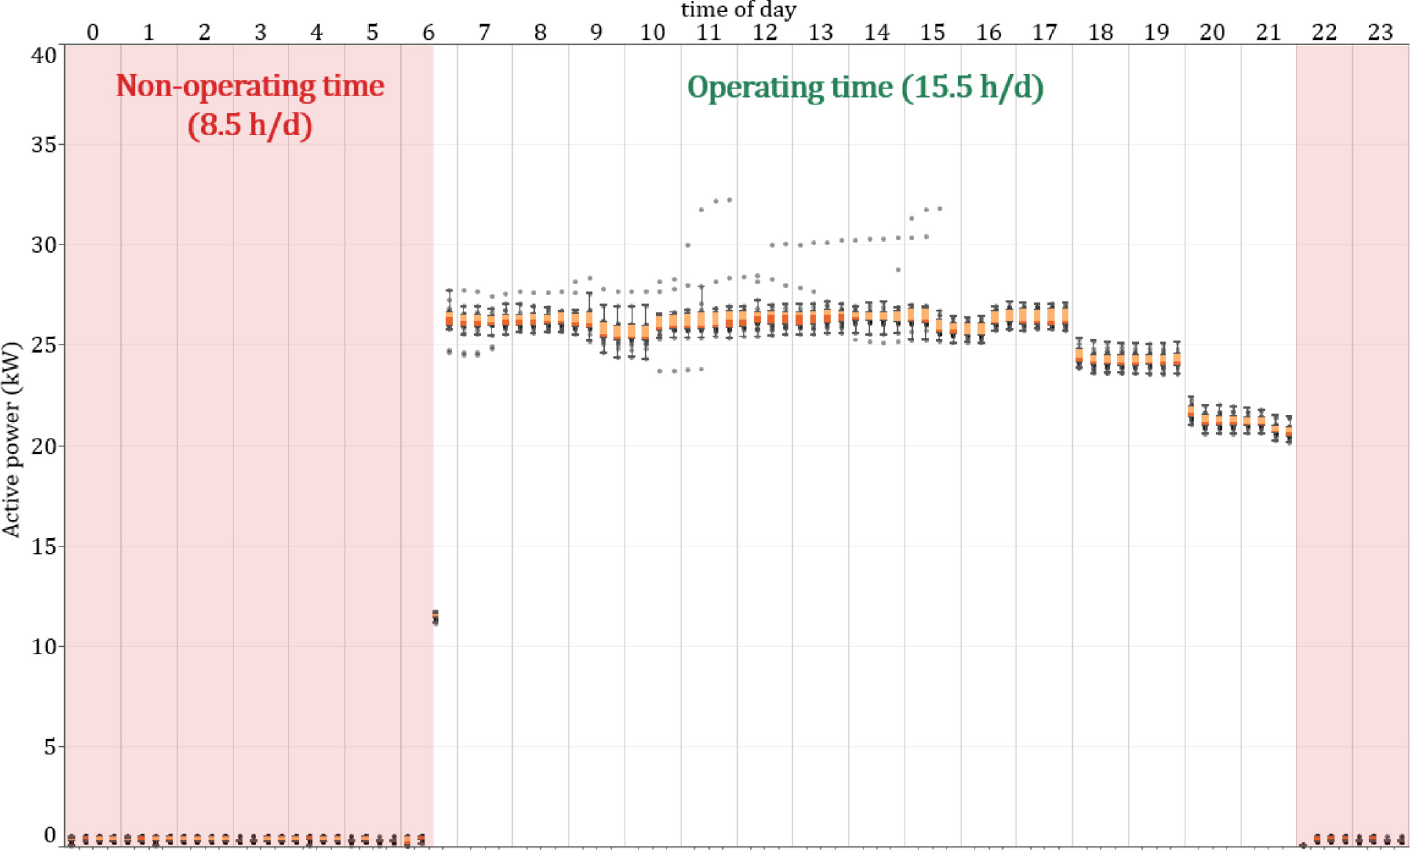
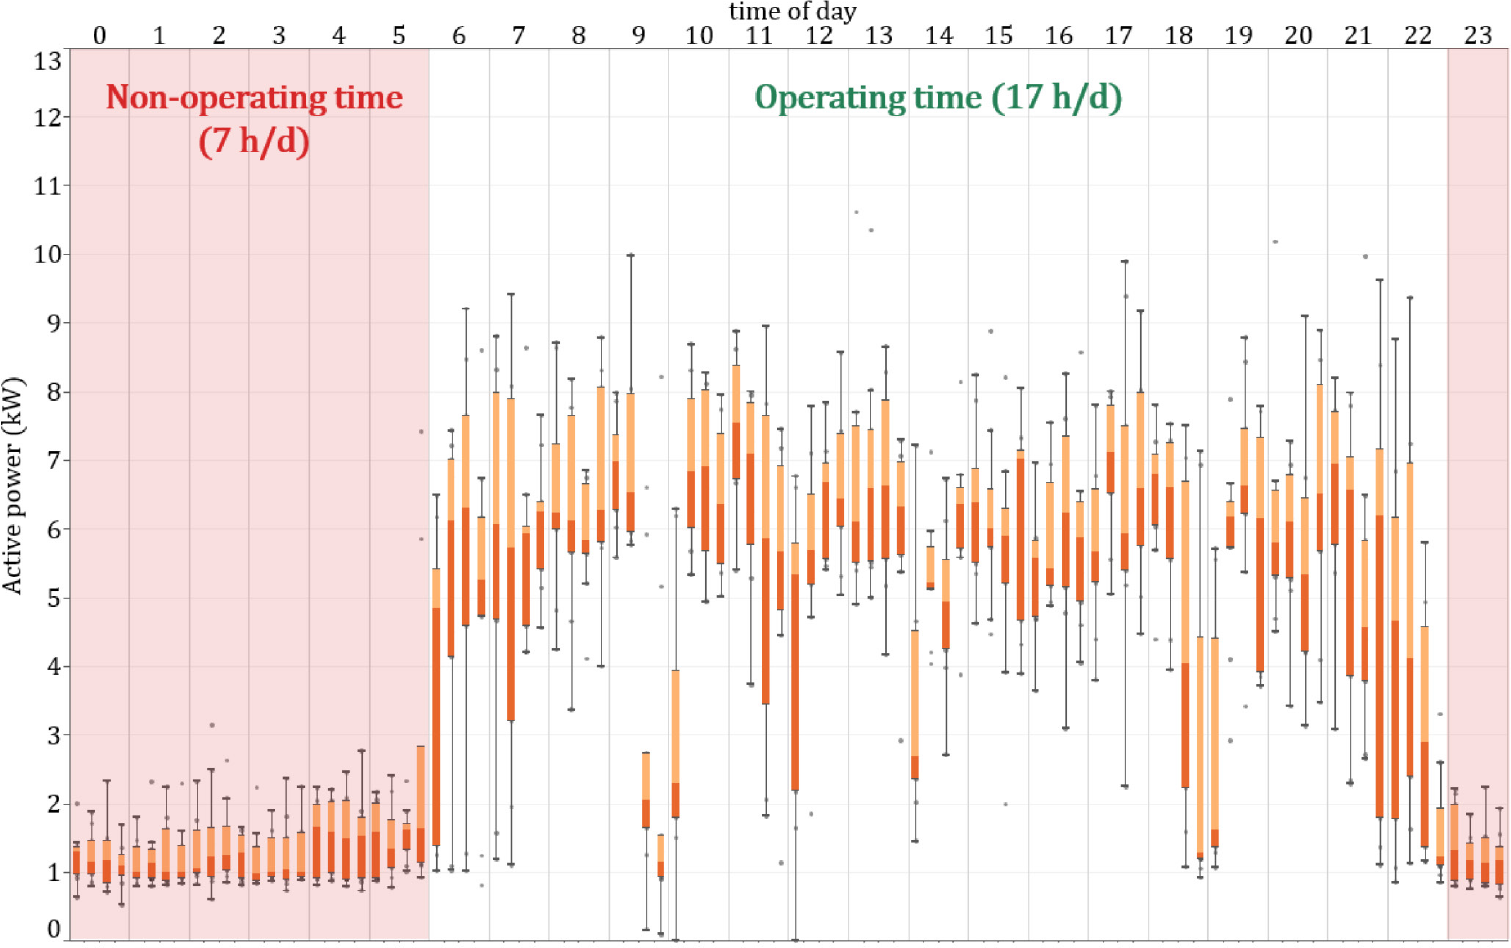
The results of load profile characterization are illustrated based on submetering data of a supply air motor and a compressor (Figure 11 and Figure 12). Therefore, both scatter plots contain all measurement data from the short-term measurements clustered by day type “operating days”.
Visual analysis of the scatter plots allows the following conclusions about consumer behavior and operating conditions. Daily operating time is clearly visible in the scatter plot of the supply air motor (06:30 am to 10:00 pm) (Figure 11). Box plots indicate that the power of the motor does not vary much over time. Thus, consumption behavior can be described as almost constant during the operating time. Visual analysis of the non-operating times shows that the supply air motor is in standby mode with virtually no power consumption.
Load profile characterization of a supply air motor visualized in a scatter plot (18 operating days)
Daily operating time is also visible in the scatter plot of the compressor (06:00 am to 11:00 pm) (Figure 12). Box plots illustrate the cyclical cycling of the compressor during the operating and non-operating time series. Consumption behavior can be described as variable throughout the whole day. Visual analysis of the non-operating time series indicates a base load consumption of approx. 1-2 kW.
Load profile characterization of a compressor visualized in a scatter plot (9 operating days)
The load characteristics of the supply air motor and compressor can also be compared by calculating the mean IQR values (〖IQR〗avg) for operating and non-operating time series. The calculated values are shown in Table 2.
Comparison of IQRavg values of the supply air motor and the compressor during operating and non-operating time series
| Time series | IQRavg Supply air motor [kW] | IQRavg Compressor [kW] |
|---|---|---|
| Operating | 0,63 | 2,06 |
| Non-operating | 0,20 | 0,66 |
On the one hand, the 〖IQR〗avg values indicate a higher dispersion in the operating time series than in the non-operating time series. Furthermore, the 〖IQR〗avg values of the compressor are about three times higher than the supply air motor in both time series. The values shown in Table 2 can serve as indicators to evaluate load characteristics of measured sub-distributions, consumption-groups and single electrical consumers.
To sum up, visual observation allows to draw conclusions about the operating behavior of electrical consumers and sub-distributions. Results indicate that particularly cross-cutting technologies such as ventilation systems, compressed air systems or refrigeration systems can be systematically clustered according to their load characteristics. Assuming a data pool containing various load profiles for each cross-sectoral technology, characteristics and indicators for an efficient consumption behavior can be developed.
Further details of consumption behavior can be analysed by reducing the measurement resolution. However, the application of a more detailed load profile analysis also depends on the individual type of load or consumer measured. For instance, the cycle time of a compressor (compressor switches on and off) is often not visible in the 15-min average values. Thus, it is necessary to analyse the consumption behavior at a lower measurement resolution (e.g. 10-s).
This section discusses the results of the present research. Therefore, the measurement resolution as well as key indicators and limitations of each data analysis are examined. On this basis, a standardized data analysis concept for short-term measurements in SMEs is derived and critically reflected.
Table 3 compares the identified standardized data analyses in terms of three main aspects: Firstly, the required measurement resolution for each data analysis is discussed. Secondly, the key indicators for the data analyses are explained. Thirdly, the limitations of the data analyses are highlighted, whereas both technical and analytical aspects are considered.
Measurement resolution, indicators, and limitations of the standardized data analyses
| Data analysis | Measurement resolution | Indicators | Limitations |
|---|---|---|---|
| Consumption disaggregation | 15-min | Load flows and / or SEUs unknown | Technical: Restricted access to the electrical structure prevents installation of measurement equipment and / or outgoing load flows exceed available measurement equipment Analytical: detection of load flows or SEUs, approaches for diagnosis, no optimization |
| Base load disaggregation | 15-min | Total base load and / or base load consumers unknown | Technical: Restricted access to the electrical structure prevents installation of measurement equipment and / or outgoing load flows exceed available measurement equipment; no base load pre-check possible prior to measurement installationAnalytical: detection of total base load or base load consumers, approaches for diagnosis, no optimization |
| Peak load disaggregation | 15-min | Total peak load and / or peak load consumers unknown | Technical: Restricted access to the electrical structure prevents installation of measurement equipment and / or outgoing load flows exceed available measurement equipment; no peak load pre-check possible prior to measurement installationAnalytical: detection of total peak load or peak load consumers, approaches for diagnosis, no optimization |
| Load profile characterization | 15-min(10-s*) | Consumption behavior and operating conditions unknown | Technical: Restricted access to the electrical structure prevents installation of measurement equipment and / or outgoing load flows exceed available measurement equipment; no peak load pre-check possible prior to measurementAnalytical: detection of inefficiencies, diagnosis of consumption behavior or operating conditions, approaches for optimization |
depending on type of electrical consumer
The standard measurement data resolution for all analyses is 15-min. Load profile characterization may indicate the need for further detailed analyses with a lower measurement data resolution depending on the consumer being measured and its consumption behavior. The use of a unique measurement resolution enables the standardized application of the developed data analyses to a single exported and prepared submetering dataset. Thus, overall efficiency of the analysis is increased.
Consumption disaggregation is a first step for SMEs to create transparency about energy and load flows. Therefore, unknown load flows or SEUs are the key indicator for this data analysis. Limitations are of technical nature: Firstly, there may be limited access to the electrical structure during installation of measurement technology, which prevents the installation of measurement equipment (e.g. current transformers). Secondly, the number of load flows may exceed the number of sensors available. Thus, certain load flows must be excluded from the measurement. Nevertheless, measurement planning should be carried out to maximise the disaggregation of the input load flow. The analysis itself enables the identification of relevant load flows and SEUs. A Diagnosis of consumption behavior and analysis of optimization potential is not possible with this standardized data analysis.
Peak and base load disaggregation are analyses that provide information about the composition of both peak and base load consumption. Therefore, these analyses are triggered by the key indicator that no information is yet available on both peak and base load consumption. The technical limitations are the same as for consumption disaggregation. In contrast to consumption disaggregation, it is not possible to check the amount of peak or base load per load flow during measurement installation. This increases the probability that load flows with less important peak and base loads are measured. From an analytical point of view, both analyses enable the detection of consumers responsible for peak and base load consumption. Approaches for further diagnosis can be developed. However, optimization potential cannot be directly derived from peak and base load analyses.
Load profile characterization provides a deeper insight into the consumption behavior and operating conditions of measured load flows. A lack of information on the behavior of loads or sub-distributions is therefore the key indicator for this analysis. While the technical limitations are the same as for the other data analyses, the analytical aspects allow a diagnosis of consumption behavior and operating conditions. The results of load profile characterization can also serve as a basis for the optimization of electrical consumers or load flows.
In summary, the four data analyses can be combined to a standardized data analysis concept. This concept can be used not only for the analysis of individual cases, but also generically for energy system analyses in the heterogenous field of SMEs. The data analysis concept thus proposes a systematic approach to perform data analysis using mobile measurement technology. All data analyses are dependent on the application of the measurement concept, which describes the systematic collection of submetering datasets. Figure 13 visualizes the concept and arranges the data analyses according to three steps of analysis, from detection through diagnosis to optimization:
Detection: Identification of anomalies in electricity consumption (e.g. relevant consumers, base load and peak load consumers)
Diagnosis: Determination of the causes of identified anomalies (e.g. insufficient control or consumption patterns)
Optimization: Analysis of optimization potential (e.g. optimization of operating hours)
Standardized data analysis concept
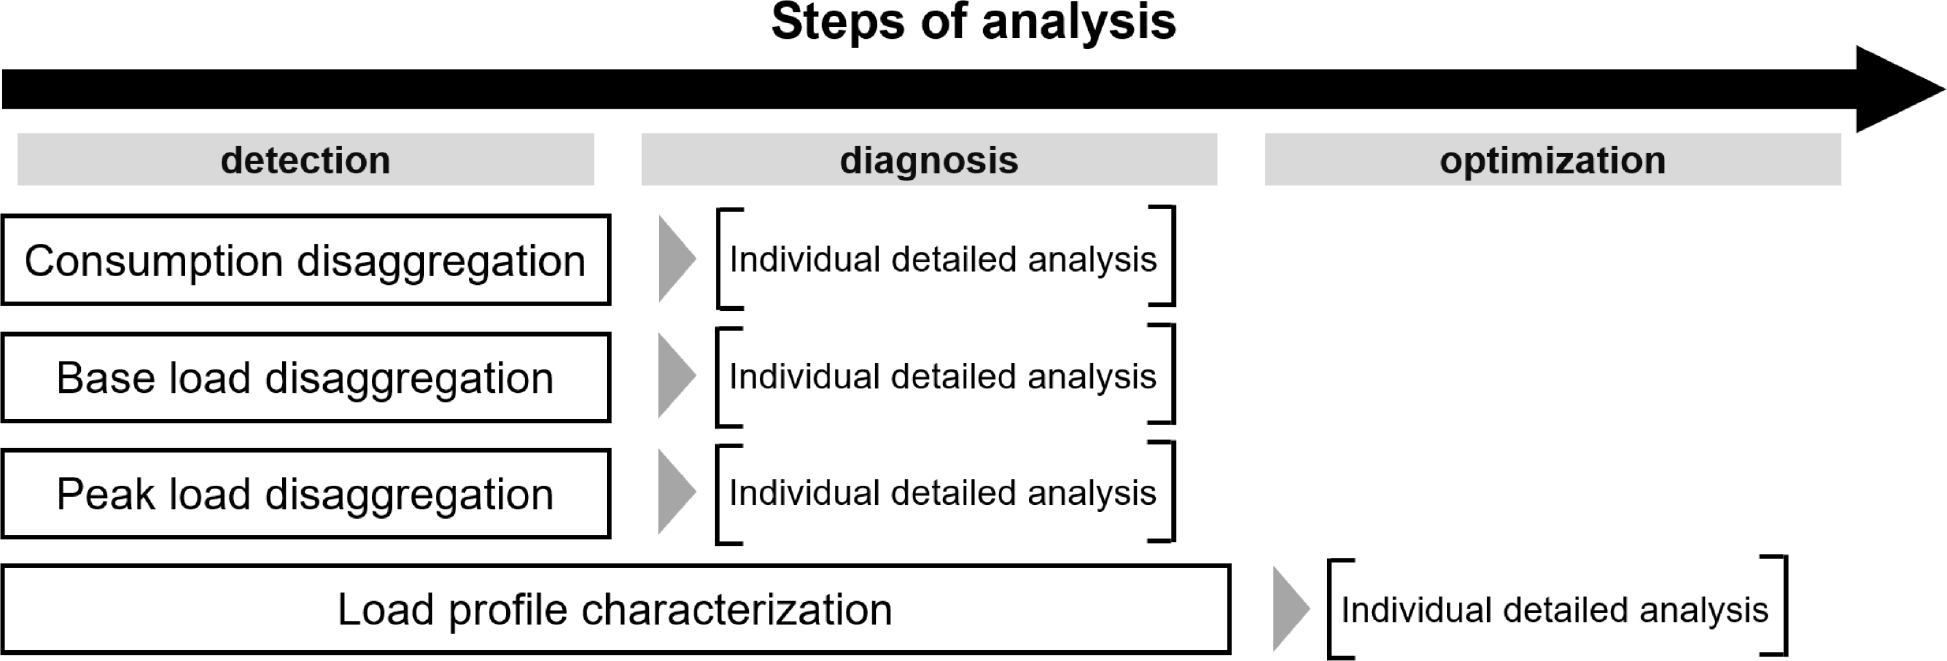
The standardized data analyses include the identification of load flows and consumers causing peak and base loads. They also enable approaches for diagnosis (e.g. evaluation of specific inefficiencies) and the optimization of consumers (e.g. operating conditions). Nevertheless, all analyses also point to aspects that could be considered in further detailed analyses (cf. Figure 13). These analyses cannot be standardized, as they depend on the individual circumstances of the measurement object. Thus, they’re not part of the standardized analysis concept.
The aim of this exploratory study is to develop a standardized data analysis approach using mobile measurement technology in SMEs. In a first step, the characteristics of the submetering datasets were systematically elaborated. In a second step, standardized data analyses were identified based on empirically collected data of selected case studies. In a third and final step, both indicators and limitations of the identified data analyses were discussed.
The results point to four standardized data analyses that can be applied generically in the context of energy system analysis with mobile measurement technology. In detail, consumption disaggregation creates transparency about the energy and load flows, peak and base load disaggregation provide details about electrical consumers responsible for peak and base load consumption. Finally, load profile characterization allows a deeper analysis of the behavior and operating conditions of sub-distributions and single electrical consumers. However, the results of the exploratory study point to both technical and analytical limitations of the identified data analyses. Technically, data analyses are limited by a restricted access to the electrical structure and a maximum number of sensors available. Analytically, most of the analyses can be assigned to the initial step of “detection” (e.g. detection of inefficient consumers). “Diagnosis” and “optimization” represent further steps of analysis, which often require individual detailed analyses for a specific measurement object. However, the application of standardized data analyses delivers indicators that point to these individual detailed analyses.
In conclusion, the present research contributes to the further development of a systematic energy system analysis based on short-term measurements. Thus, the research supports the reduction of energy consumption and environmental impact of SMEs. In future research, it will be necessary to analyse the potential of submetering datasets in detail using statistical methods. In a first step, methods of descriptive statistics can be used to characterize each individual data series on the basis of statistical parameters. These statistical parameters could be used as indicators to distinguish between efficient and inefficient load characteristics as well as to develop specific load profile clusters representing a certain load behavior. In a second step, based on all data series collected in the case studies, an empirical derivation and evaluation of the value ranges of identified statistical parameters can be carried out.
The authors acknowledge the support of the Ministry of Economic Affairs, Industry, Climate Action and Energy of the State of North Rhine-Westphalia (DE) and the progres.nrw -Innovation funding (No. EFO 0031A).
| Pavg | average active power | [kW] |
| Pbase_input | avg. base load of input load flow | [kW] |
| Pbase_n | disaggregated base load | [kW] |
| Ppeak_input | peak load of input load flow | [kW] |
| Ppeak_n | disaggregated peak load | [kW] |
| t | time | [s] |
| Win | input load flow | [kWh] |
| Wout_n | output load flow | [kWh] |
| IQR | interquartile range | [kW] |
| Q0.75 | third quartile | [kW] |
| Q0.25 | first quartile | [kW] |
| IQRavg | average interquartile range | [kW] |
| Greek letters | ||
| φ | power factor | [-] |
| Subscripts and superscripts | ||
| avg | average | |
| n | type of measured output load flow | |
| Abbreviations | ||
| BDEW | German Association of Energy and Water Industries | |
| CG | Consumption Group | |
| EED | Energy Efficiency Directive | |
| EC | European Commission | |
| EnPI | Energy Performance Indicator | |
| EU | European Union | |
| IEA | International Energy Agency | |
| IREES | Institute for Resource Efficiency and Energy Strategies | |
| LVMD | Low Voltage Main Distribution | |
| MD | Main Distribution | |
| OECD | Organization for Economic Co-operation and Development | |
| PwC | PricewaterhouseCoopers | |
| SD | Sub Distribution | |
| SME | Small and medium-sized enterprise | |
| SQL | Structured Query Language | |
- German Association of Energy and Water Industries, BDEW Electricity Price Analysis July 2023: Electricity Prices in Industry, https://www.bdew.de/media/documents/230724_BDEW-Strompreisanalyse_Juli_2023_24.07.2023.pdf
- Brief study on energy efficiency measures in industry: Market-oriented and economical energy-saving potential in industry, 2023, https://deneff.org/wp-content/uploads/2023/04/HSNR-Kurzstudie-EnEffPotentiale-Industrie-2023-03-31.pdf
- , Market Report Series: Energy Efficiency 2018: Analysis and outlooks to 2040, 2018
- Energy consumption of the trade, commerce and services sector in Germany for the years 2007 to 2010: Final report to the Federal Ministry of Economics and Technology (BMWi), 2013, https://www.bmwi.de/Redaktion/DE/Publikationen/Studien/sondererhebung-zur-nutzung-erneuerbarer-energien-im-gdh-sektor-2010.pdf?__blob=publicationFile&v=7
- Energy Transition in the SME Sector, 2015, https://www.pwc.de/de/mittelstand/assets/befragung-energiewende-im-mittelstand.pdf
- Commission Recommendation of 6 May 2003 Concerning the Definition of Micro, Small and Medium-sized Enterprises: 2003/361/EC, 2003, https://eur-lex.europa.eu/legal-content/EN/TXT/?uri=celex%3A32003H0361
- ,
Energy efficiency and the direct and indirect effects of energy audits and implementation support programmes in Germany ,Energy Policy , Vol. 157 ,pp 112486 , 2021, https://doi.org/https://doi.org/10.1016/j.enpol.2021.112486 - Policy Pathway - Accelerating Energy Efficiency in Small and Medium-sized Enterprises, 2015, https://www.iea.org/reports/policy-pathway-accelerating-energy-efficiency-in-small-and-medium-sized-enterprises-2015
- 2021 SME Country Fact Sheet European Union, 2021, https://ec.europa.eu/docsroom/documents/46060
- ,
Why & how energy efficiency policy should address SMEs ,Energy Policy , Vol. 140 ,pp 111337 , 2020, https://doi.org/https://doi.org/10.1016/j.enpol.2020.111337 - Directive 2012/27/EU of the European Parliament and of the Council of 25 October 2012, 2012, https://eur-lex.europa.eu/eli/dir/2012/27/oj
- ,
Beyond barriers – A case study on driving forces for improved energy efficiency in the foundry industries in Finland, France, Germany, Italy, Poland, Spain, and Sweden ,Applied Energy , Vol. 111 ,pp 636–643 , 2013, https://doi.org/https://doi.org/10.1016/j.apenergy.2013.05.036 - ,
Learning from the “data poor”: energy management in understudied organizations ,Journal of Property Investment & Finance , Vol. 32 (4),pp 424–442 , 2014, https://doi.org/https://doi.org/10.1108/JPIF-03-2014-0018 - ,
Energy costs information in manufacturing companies: A systematic literature review ,Journal of Cleaner Production , Vol. 254 ,pp 119927 , 2020, https://doi.org/https://doi.org/10.1016/j.jclepro.2019.119927 - ,
Digitally driven energy management practices in SMEs – exploring potentials and barriers ,Die Unternehmung - Swiss Journal of Business Research and Practice , Vol. 76 (3),pp 360–380 , 2022, https://doi.org/https://doi.org/10.5771/0042-059X-2022-3-360 - , The Potential of Smart Technologies and Micro-Generation in UK SMEs, School of Public Policy, 2017
- "Technology Screening: Smart Technologies for Enterprises," Technology-Screening Research Project "Smart Technologies for Enterprises", 2021, https://epb.bibl.th-koeln.de/frontdoor/index/index/docId/1975
- ,
Energy efficiency in small and medium enterprises: Lessons learned from 280 energy audits across Europe ,Journal of Cleaner Production , Vol. 142 ,pp 1650–1660 , 2017, https://doi.org/https://doi.org/10.1016/j.jclepro.2016.11.126 - The Energy Efficiency Competence Centre East Württemberg - A contribution to the energy transition: (in German), 2018, https://www.tugraz.at/fileadmin/user_upload/Events/Eninnov2018/files/lf/Session_G5/852_LF_Hein.pdf
- ,
Systematic energy data acquisition and evaluation in SME companies through the use of mobile measurement technology: (in German) ,in EnInnov 2020 Tagungsband , 2020 - , Energy efficiency analysis and benchmark in grocery stores: Results of a short-term sub-metering measurement campaign, in 15th SDEWES Conference Cologne 2020
- Load Profile Measurement Guide, 2010, https://tektool.iwu.de/download.php
- Autonomous load disaggregation approach based on active power measurements, https://ieeexplore.ieee.org/abstract/document/7134051
- , Electrical Engineering for Mechanical Engineers. (in German), 2016
- , Measuring Electrical Work and Power, Institute for Energy Economics and Rational Use of Energy (IER), (in German)
- Systematic measurement data acquisition for energy audits with a mobile measuring unit: (in German), 2015, https://www.managee.de/wp-content/uploads/2015/10/07004-2.pdf
- The Second Step Towards Climate Neutrality - Energy Efficiency, https://www.consenzum.de/der-zweite-schritt-zur-klimaneutralitaet-energieefizienz
- Identification of Optimisation Potential in Electrical Energy Systems Based on Load and Generation Profiles: (in German), https://www.tugraz.at/events/eninnov2020/nachlese/download-beitraege/stream-f#c279490
- ,
Approach for a Systematic Energy Data Generation and Evaluation ,Procedia CIRP , Vol. 67 ,pp 63–68 , 2018, https://doi.org/https://doi.org/10.1016/j.procir.2017.12.177 - Quick guide to the load profile analysis tool (ProEnergie project), 2023, https://www.energy-seeds.org/de/schwerpunkte/energiedatenanalyse.html
- ,
Resource Consumption Monitoring in Manufacturing Environments ,Procedia CIRP , Vol. 26 ,pp 264–269 , 2015, https://doi.org/https://doi.org/10.1016/j.procir.2014.07.098


