Ambitious recycling targets for municipal and packaging waste are part of the European Union's circular economy package; these targets include recycling 65% of municipal waste by 2035 [1]. Hence, better waste treatment has become more important in recent years [2], [3]. In addition, heterogeneous waste streams from mixed (commercial and municipal) waste, which are highly variable in their composition and particle size [4], pose a challenge in further processing. Shredders, often the first machines in mechanical waste treatment plants [5], must deal with this heterogeneous and challenging material stream. Large-scale experiments have to be carried out because there is no possibility of downscaling the properties and composition of the mixed heterogeneous waste streams [6]. The heterogeneous composition of waste streams also complicates the (real-time) modelling, particularly the current state detection of material flows [7]. Methods for sensor-based measurement of material flow data, which are used for quality assurance in waste treatment, have already been published (cf. [8], [9]); further research on the use of various sensor technologies for materials characterisation has been presented in two review papers (cf. [10], [11]). Even though sensors are present in some waste treatment plants, they provide hardly any data about the material stream (a.o., sensors for fire protection, machine data). In addition, sensors already installed in some plants for recording volume or mass flows are still missing in other plants.
In some cases, individual machines are equipped with sensors that collect data. However, this collected information is not used, particularly in terms of dynamically operating the machine interaction and plant optimisation. Communication between the individual machines and thus a step towards digitalisation-assisted plant operation is still missing, also because there is currently hardly any real-time information on the load of conveyor belts or the quantities fed to the individual machines, whose performance depends on these quantities [12], [7].
A shredder changes the parameter particle size of the input material (for example, mixed solid waste) for the downstream process. In this process step, waste is shredded and transferred to a specific particle size range, resulting in a material stream suitable for transport, screening and sorting. The selection of the shredder for the respective area of application usually depends on the input material and its properties [13]. The particular shredder and its settings or parameters (a.o., cutting gap, shaft rotation speed, knives) affect the output stream in its particle size distribution [14], throughput capacity, and uniformity [15], [16]. Insufficient attention is paid to the aspect of more steady throughput, especially volume flow. Fluctuations in the material flow can be caused by irregular material discharge of individual machines or discontinuous feeding. They can affect the performance of subsequent machines and the quality of the output material from a machine or a plant [15]. For example, a conveyor belt's high occupancy rate negatively impacts the performance of a subsequent sorting machine [17]. Data from a pilot-scale processing line − Technical Line 4.0 consisting of a shredder, drum screen and an additional machine that recorded volume and mass flow − with mixed solid waste show an overview of the origin and causes of fluctuations [12]. The study [18] also deals, among other things, with the influence of throughput fluctuations on sensor-based sorting machine performance to enable more optimised design and operation of sorting plants. However, the authors [18] recommend further investigation of the fluctuations since the share of acceleration belt area covered by the material was low (<50%) in the tests carried out. Investigations using higher loading densities should therefore be performed. The study [19] states, that a prerequisite for a good sorting sequence is a continuous material volume flow also serving to avoid subsequent overfilling and underfilling conditions. The aspect of smoothing material stream fluctuations and thus conveying conditions has not been given enough attention so far. However, appropriate steps would make considerable capacity potential available in existing treatment plants and, at the same time, improve the quality [15]. Coarse shredders are usually set based on statistical insights in waste treatment plants. Parameters such as shaft rotation speed already pursue dynamic approaches. Programs include certain dynamic behaviour like reversing at regular intervals if, for example, particles get stuck. Nevertheless, the dynamic adjustment of the shredder, e.g., in terms of target shaft rotation speed and controlling the current material flow, has not yet been implemented [6].
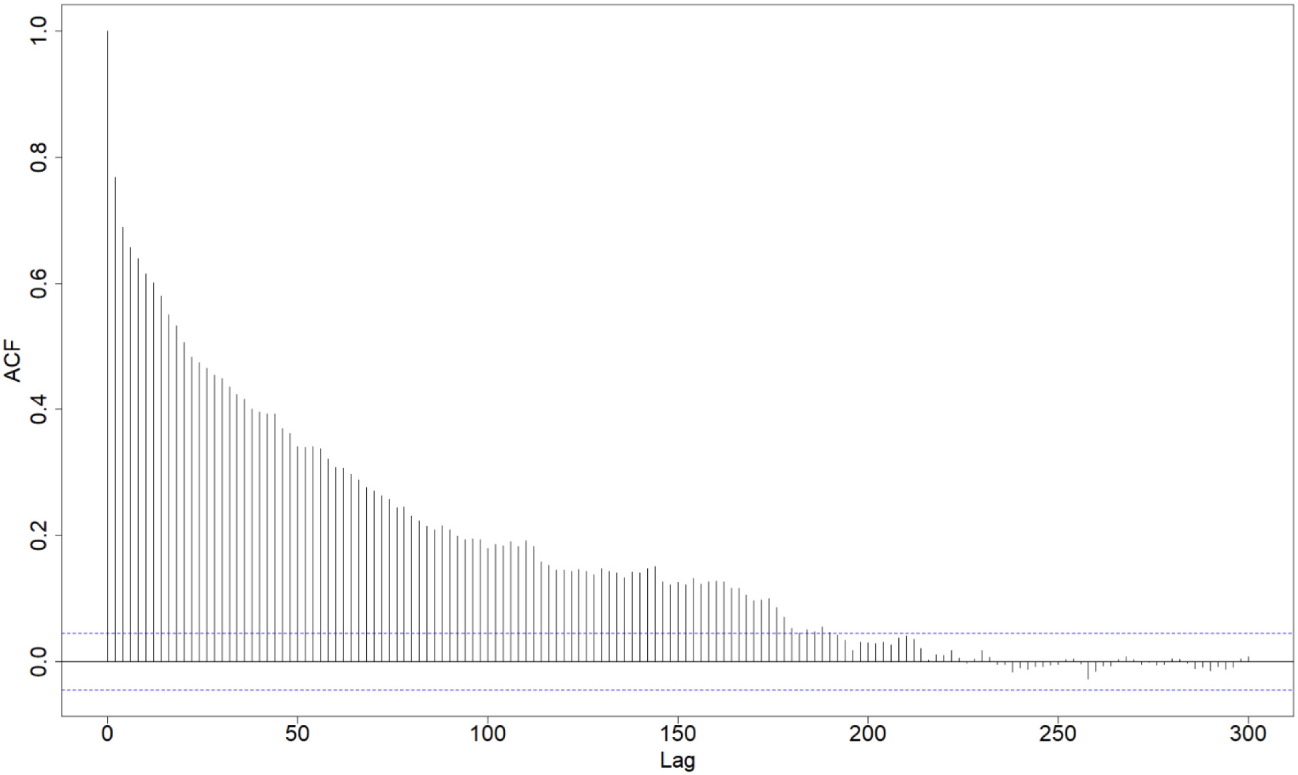
This investigation deals with the problem of the non-uniform throughput performance of shredders. The aim is to improve waste plant processing performance by controlling the shredder's output while avoiding additional machinery or facilities. This study will present data analyses from real-scale experiments to show and quantify the potential of dynamically adjusting shredder parameters to control the output stream. The concept of implementing an output feedback control loop for the shredder originated from insights gained during the ReWaste4.0 project (cf. [20]) − a predecessor of the ReWaste F project (cf. [21]), in which this work is included. The hypothesis, supported by autocorrelations observed in the output flow (cf. Figure 1), was that the processed waste material and the resulting volume flow of a shredder's output are more similar than, on average, within a certain time interval.
First, the basic concept of implementing an output feedback control loop is discussed; the topic of autocorrelation must be addressed. A correlation between two data points (autocorrelation) is usually expressed as an autocorrelation coefficient rk (cf. [22]). The correlation coefficient indicates the distance between two data points under consideration for each value of k, with rk assuming a specific value between −1 and +1 [23].
(1)
These correlation coefficients applied to different lags produce a diagram and an autocorrelation function plot (ACF-plot, cf. Figure 1). An ACF (ordinate) describes the correlation between data points of the time series and the time series offset by one lag (abscissa). The diagram shows that the correlations decrease with increasing lag up to around 175 s. There is no fixed defined value for defining a strong or weak correlation. However, values between 0.3 and 0.5 usually indicate a weak correlation, values between 0.5 and 0.7 indicate a moderate correlation and values greater than 0.7 − a strong correlation [24]. In this example, there is a moderate correlation up to 25 s and a strong correlation only up to 6 s, but there is at least a weak correlation up to approx. 175 s. In conclusion, the idea of an output feedback control loop is born from the existing context.
ACF plot − data from a test series of the ReWaste4.0 project of 2019, the lag given in seconds; shredder settings – shaft rotation speed 80%, cutting tools F, cutting gap closed; mixed commercial waste was comminuted
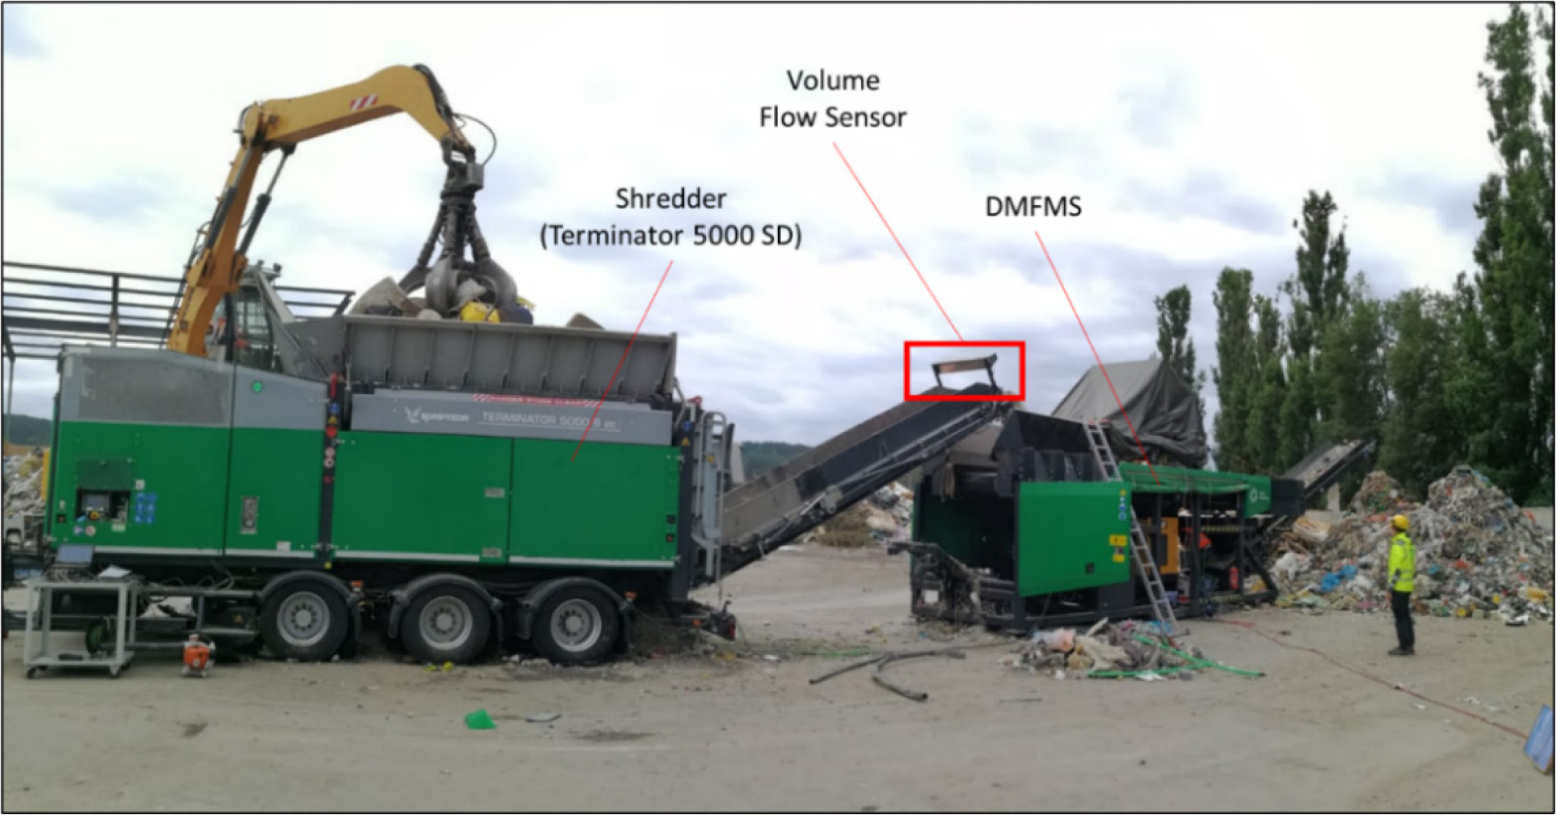
Large-scale tests were conducted to collect meaningful data and information under real conditions. The material comminuted was mixed solid commercial waste from Styria, Austria. The material was continuously fed by a crane or wheel loader to avoid the effects of non-continuous feeding the shredder, so the grinding chamber was always well-filled. The shredder used was a Terminator 5000 SD provided by Komptech GmbH (cf. Figure 2). The comminuted material was transported from the shredder to a Digital Material Flow Monitoring System (DMFMS), a mobile machine from Komptech GmbH, which records the mass and volume flow (described in more detail by [16]). The control of the shredder throughput is to be realised based on data generated by a volume flow sensor mounted above the discharge belt of the shredder. This method was tested, considering its retrofitability and, thus, its implementation in existing plants. Before the tests with the control loop started, tests to get a calibration curve were carried out.
Photo documentation of the large-scale experiments in 2022; control of the output volume flow of a shredder with subsequent sensor-based investigation of the material flow
In order to get a better understanding of data obtained from previous experiments (cf. [16]) and to create a calibration curve for the same waste used for the experiments, collected at the same time and location, a calibration curve was created using the new data. Using this calibration curve should lead to a better understanding of the correlations between the mean volume output and shaft rotation speed. The test runs for the calibration curve were carried out in random order at the following shaft speed settings: 50%, 60%, 70%, 80%, 90% and 100%, each for 15 minutes (so that the data collected by operating the shredder are predominantly in a stable state: the initial oscillations are over).
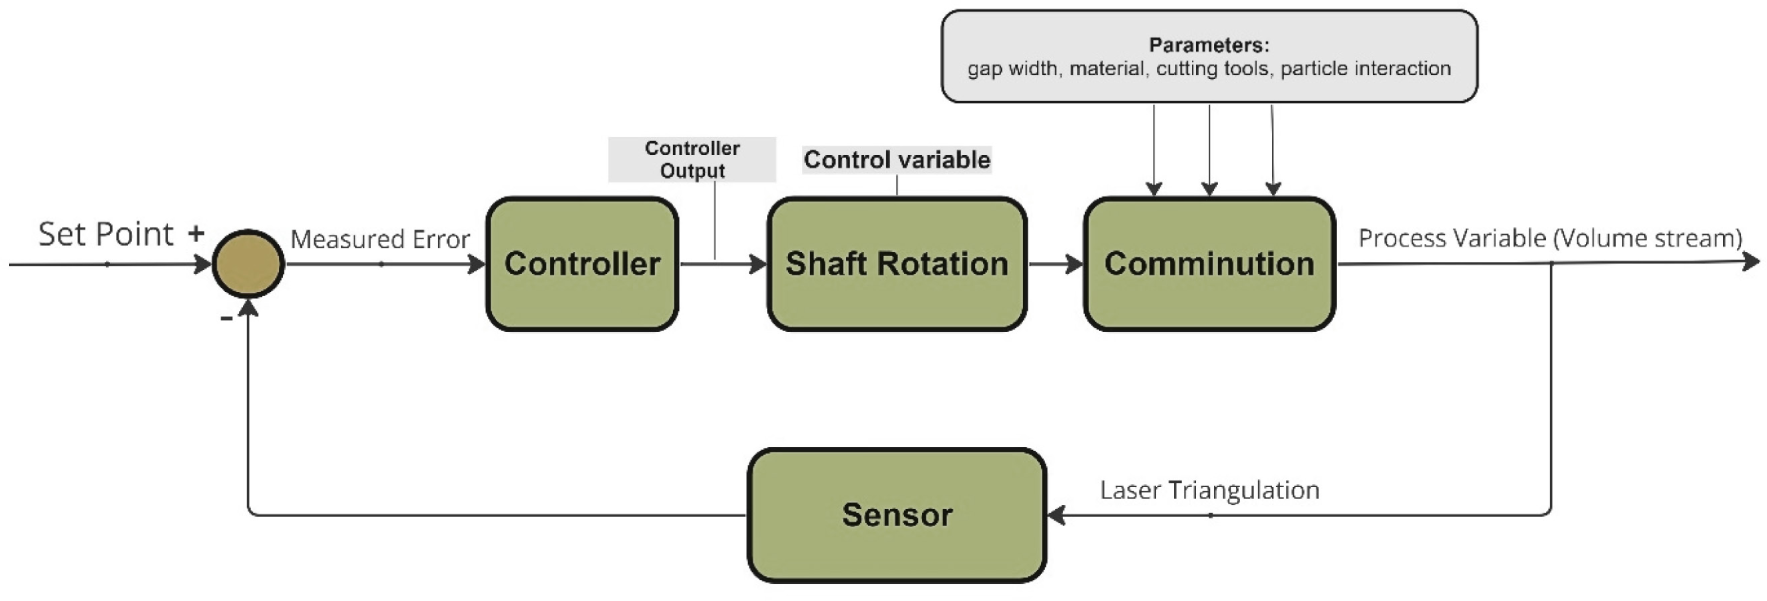
First, a control loop is described in general terms, and then the performed experiments are discussed. A control loop comprises three essential components: the process sensor, the controller function, and the final control element. Collectively, these components automatically modify the controller output value, matching the value of a predefined set point (SP) by changing a measured process variable (PV). The measured control deviation occurs as a difference between the SP and the actual value or a proportional band (a range of values within the PV should remain), so the response of the controller output is limited, thus reducing the risk of an unstable control loop. The desired output value (the SP) is compared with the current PV using a mathematical function, resulting in a measured deviation (Figure 3). The controller uses the measured deviation to generate an electrical signal for the shaft motor to change the shaft rotation speed. So, the process variable changes because the speed affects the comminution process. A sensor measures the new PV, so the new value is compared with the SP, generating a new measured deviation. So, the control loop is completed, and with good controller tuning, the process variable remains at the SP. The control action depends on the desired PV and the actual PV. There is a feedback loop through which a control action is exerted to keep the PV at the same value as the SP [25].
Flowchart − control loop of a shredder [26]
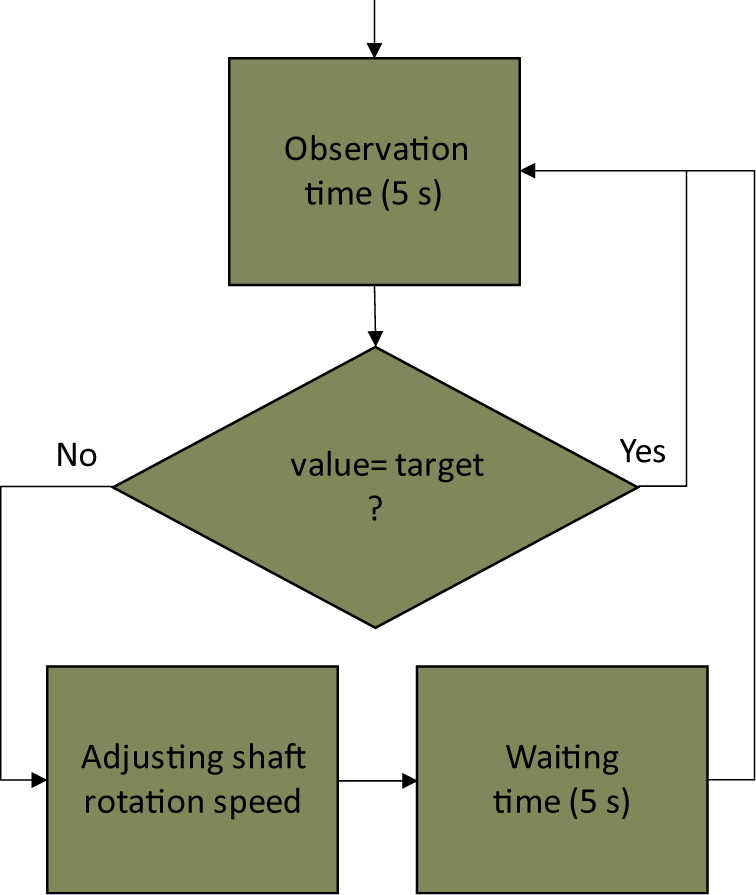
In these experiments, the output variables of the system are measured, and the control input is adjusted to regulate the system. Komptech GmbH programmed the control loop (Figure 4). The application of the control loop to the shaft rotation speed of the shredder to minimise fluctuations was tested with the control loop alternating activated and deactivated (to minimise the influence of the material). The test runs lasted 15 min. For the tests with a deactivated control loop, the shaft rotation speed was set to 70% of the maximum; this value was used as a starting point for the tests with an activated control loop.
By a shaft rotation speed of 70%, a target volume of 180 m3/h should be reached, according to the control loop experiments (cf. section Results). The idea was to select a target volume approximately in the middle of the analysed speed range for static settings to regulate it up and down in the dynamic setting. Thus, the two states can be compared. The tolerance range was set at first to 10%, so the control loop reacted at volume flows below 162 m3/h and above 198 m3/h. Then, the control loop was set to change the PV value (if necessary) every 10 s, with a waiting time of 5 s plus an observation time of 5 s. So, the volume flow was observed for 5 seconds, and at the end of this time, an assessment was made based on the average volume flow. If no regulation was required, the 5 s start again from the beginning; if a regulation was required, then the shaft rotation speed was adjusted up or down by 20% of the speed (cf. Figure 4). However, the original step size of 10% was too small based on observations, so the next possible step based on the used software was selected (20%). A total of 18 test runs were carried out, 9 with activated and 9 with deactivated control loop.
Flowchart to illustrate the control loop
The volume flow data, recorded by the sensor on the shredder output, were stored as Dewesoft (data acquisition and processing software) files. The files can be displayed and edited in Dewesoft. Selected and relevant data were further analysed using R (a statistical programming language).
This chapter deals with the results. First, the results of the calibration curve tests are discussed, and then the results of the control loop come into focus.
The control loop was calibrated by establishing a clear relationship between the shaft rotation speed and the mean volume output. Figure 5 shows the mean volume flow rate at the set shaft rotation speed over time.
Linear model for output behaviour with confidence interval based on mean output; shaft rotation speed given in a share of maximum (31 rpm) [26]
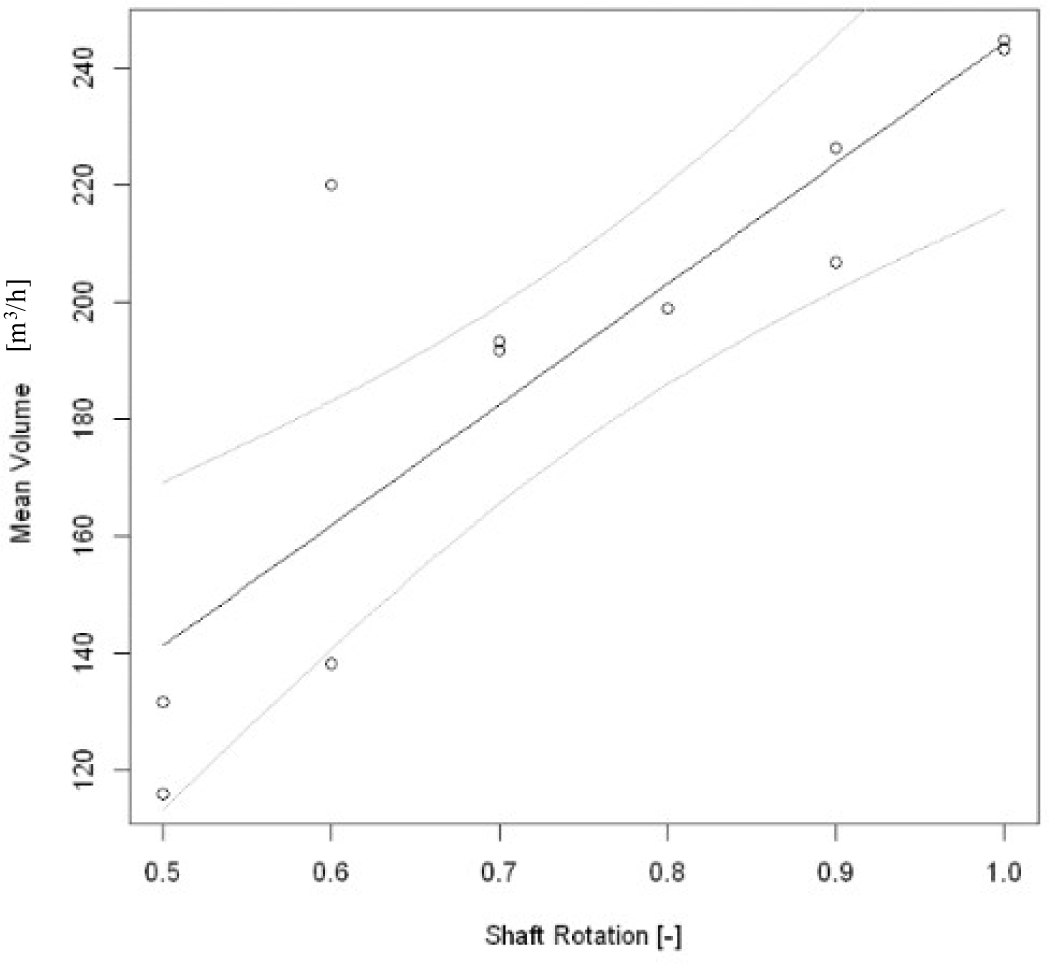
The data points show the trend of a directly proportional function. However, it should be noted that there is a residual variance and that these data are 15-minute averages, which limits its practical application. Based on the data, a linear model can be calibrated for the data points, and a confidence interval can be calculated. In Figure 5, the mean data are used to calculate the linear model using R. Despite the large confidence interval (the wide data distribution), there are not enough data points to reduce the interval width without lowering the confidence level. However, a clear trend indicates a proportional increase in volume power as the shaft speed increases. Due to the linear model for the average volume output, the control loop was centred at 0.7. The shaft rotation speed can then be increased and decreased without reaching the limits of the shredder (by an adjustment of ±20%). The volume flow value of 180 m3/h is calculated for the linear model for the average volume output for the chosen set point. According to the regression, a change of 20% in shaft rotation speed leads to a change of 41 m3/h and thus 23% of the target. The effect observed with a change in shaft rotation speed of 10% was low. With a change of 20%, however, the regulation may be too high (responding at ±10%, but the volume flow is regulated by 23%). So, a finer control adjustment would probably be better [26].
If a directly proportional linear model is assumed for the calibration, the more dominant the change in shaft speed, the more likely the output will change. This calibration model is an important part of the tuning process so that the control loop can be set up [26].
Here, the aim is to show whether a statistically significant improvement in the fluctuations is achieved in the test runs with an activated or deactivated control loop. The average of all 90/10 quantiles of all test runs (activated and deactivated control loop) is calculated. The 90/10 quantiles were tested for normal distribution using a quantile-quantile plot and the Shapiro-Wilk test, and based on these, they are assumed to be normally distributed as a result. Therefore, a two-sample t-test was performed (Figure 6).
Control loop experiment results: test runs activated (grey) and deactivated (white) control loop [26]; the volume given in m3
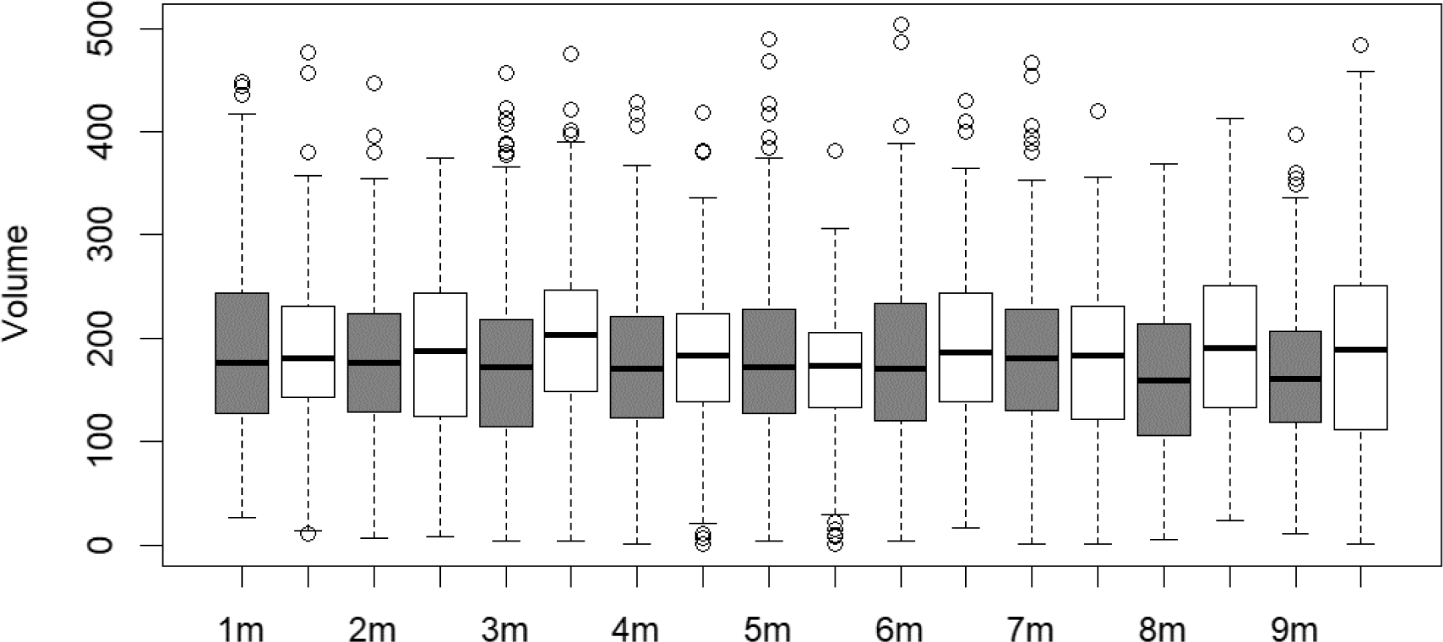
It was analysed whether there is a significant difference between the 90/10 quantiles with activated or deactivated control loop. In the results of the control loop tests shown in Figure 6, the volume data are visualised as boxplots. There appears to be no significant difference between the two settings with and without an active control loop, looking at the width of the individual boxplots. The medians are comparable, as well as the 75th and 25th percentiles [26].
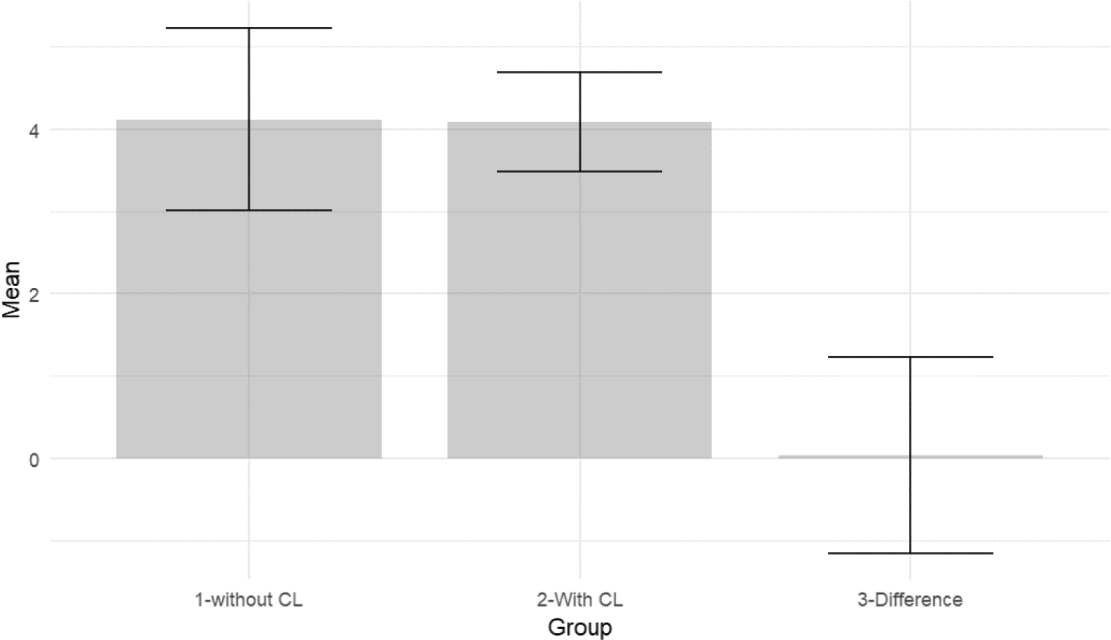
The confidence interval for the difference in mean volume output contains zero; the confidence intervals overlap completely (cf. Figure 7), so the control loop does not cause any significant difference in the 90/10 quantile metric. The standard deviation of the 90/10 quantiles is smaller for the data with an active control loop (σ = 0.8) than without a control loop (σ = 1.4), but the actual quantiles of the control loop are not significantly better. As a result, no significant improvement is caused by the control loop [26].
Mean of 90/10 quantiles for control loop experiments and a confidence interval of the mean for unknown variance [26]: without control loop (1), with control loop (2), and difference (3)
The hypothesis of an output feedback control loop, based on the shredder volume output data and the shaft rotation speed of the shredder – for the used control loop – was not confirmed. However, such a hypothesis cannot be generally rejected either. The controller used here was rudimentary, inflexible in step size and based on a basic analysis. So, there is still potential for improvement: for example, a control loop could work for controllers that can be more finely adjusted than the one used. Further, one can consider shredder settings dynamically controlled to create a control loop (e.g., the gap width).
Even though only one specific shredder was tested in these trials, using a single-shaft shredder (as used here) is common in waste management [27]. Hence, the results from this work are likely to be relevant to this class of machines in general.
Developing a method for the characterisation of shredders involves challenges. Individual parameters must be examined and combined in several steps and investigations to form such a method. Here, in terms of the parameter, throughput, and related fluctuations, which are important topics in waste treatment plants, the idea of smoothing them via shredder output feedback control was born. This study aimed to provide approaches to solutions that have not yet been confirmed. Experiments with an activated control loop showed no significant improvement for the 90/10 quantiles compared to those without an active control loop. The fluctuations in these data sets cannot be attributed to intermittent shredder feeding, as a crane operator ensured that the shredder feed hopper was always full.
Further, this work did not address problems such as bridging or the material and shape of the objects. As the question arises as to why the control loop has not brought any improvement, the next analyses are planned to be carried out. The next step will focus on a detailed time series analysis and some step testing to better understand the process characteristics. The aim is to get a refined, improved controller and the desired results.
Since dynamic control of the shredder in the waste management sector could lead to improved feeding of subsequent machines, as this could avoid overloading these machines, there is a need for further research studies. The dimensioning of subsequent machines could also be adapted, as they would no longer have to be designed for overloads. This step would also be financially beneficial.
| N | number of data points |
| rk | autocorrelation coefficient |
| ACF | Autocorrelation Function |
| CL | Control Loop |
| DMFMS | Digital Material Flow Monitoring System |
| PV | Process Variable |
| SP | Set Point |
Recycling and Recovery of Waste for Future (project nr. 882512) is a COMET Project within the COMET – Competence Centers for Excellent Technologies Programme and funded by BMK – Federal Ministry for Climate Action, BMAW – Federal Ministry of Labour and Economy, and the federal state of Styria. COMET is managed by FFG – The Austrian Research Promotion Agency.
- ,
Brussels , 20182024 - , Material, Machine and Process Oriented Requirements for the Development of a Smart Waste Factory, Doctoral Thesis, Chair of Waste Processing Technology and Waste Management, 2021
- ,
Design, quality and quality assurance of solid recovered fuels for the substitution of fossil feedstock in the cement industry - Update 2019. Waste management & research : the journal of the International Solid Wastes and Public Cleansing Association, ISWA 2019; 37: 885 - 897 , , https://doi.org/https://doi.org/10.1177/0734242X19862600 - ,
Sampling and analysis of coarsely shredded mixed commercial waste ,Part I: procedure, particle size and sorting analysis. Int. J. Environ. Sci. Technol , Vol. 17 ,pp 959 - 972 , 2020, https://doi.org/https://doi.org/10.1007/s13762-019-02526-w - , Development of substitute fuel for the HOTDISC process and analysis of the waste management relevance (In German, Entwicklung von Ersatzbrennstoff für das HOTDISC-Verfahren und Analyse der abfallwirtschaftlichen Relevanz), Doctoral Thesis, 2008
- , Empirical modeling for the optimised operation and real-time control of coarse shredders for mixed commercial waste, Doctoral Thesis, Chair of Process Technology and Industrial Environmental Protection, 2021
- ,
Digitalisation and intelligent robotics in value chain of circular economy oriented waste management - A review ,Waste management (New York, N.Y.) , Vol. 95 ,pp 476 - 492 , 2019, https://doi.org/https://doi.org/10.1016/j.wasman.2019.06.035 - ,
Sensor-based particle mass prediction of lightweight packaging waste using machine learning algorithms ,Waste management (New York, N.Y.) , Vol. 136 ,pp 253 - 265 , 2021, https://doi.org/https://doi.org/10.1016/j.wasman.2021.10.017 - ,
Characterization of post-consumer polyolefin wastes by hyperspectral imaging for quality control in recycling processes ,Waste management (New York, N.Y.) , Vol. 31 ,pp 2217 - 2227 , 2011, https://doi.org/https://doi.org/10.1016/j.wasman.2011.06.007 - ,
Optical sensors and machine learning algorithms in sensor-based material flow characterisation for mechanical recycling processes: A systematic literature review ,Waste management (New York, N.Y.) , Vol. 149 ,pp 259 - 290 , 2022, https://doi.org/https://doi.org/10.1016/j.wasman.2022.05.015 - ,
Critical review of real-time methods for solid waste characterisation: Informing material recovery and fuel production ,Waste management (New York, N.Y.) , Vol. 61 ,pp 40 - 57 , 2017, https://doi.org/https://doi.org/10.1016/j.wasman.2017.01.019 - ,
Real time material flow monitoring in mechanical waste processing and the relevance of fluctuations ,Waste management (New York, N.Y.) , Vol. 120 ,pp 687 - 697 , 2021, https://doi.org/https://doi.org/10.1016/j.wasman.2020.10.037 - ,
Introduction to waste management (in German, Einführung in die Abfallwirtschaft) ,Vieweg+Teubner , 2010, https://doi.org/https://doi.org/10.1007/978-3-8348-9681-0 - ,
Distribution-Independent Empirical Modeling of Particle Size Distributions-Coarse-Shredding of Mixed Commercial Waste , Vol. 9 ,pp 414 , 2021, https://doi.org/https://doi.org/10.3390/pr9030414 - , Unused potential in waste treatment (in German, Ungenutzte Potentiale in der Abfallwirtschaft), in: Pomberger et al, Recy&DepoTech, 2018
- ,
Efficient derivation of significant results from mechanical processing experiments with mixed solid waste: Coarse-shredding of commercial waste ,Waste management (New York, N.Y.) , Vol. 121 ,pp 164 - 174 , 2021, https://doi.org/https://doi.org/10.1016/j.wasman.2020.12.015 - ,
Influence of throughput rate and input composition on sensor-based sorting efficiency ,Detritus , Vol. 09 ,pp 59 - 67 , 20202020, https://doi.org/https://doi.org/10.31025/2611-4135/2020.13906 - ,
Towards digital twins of waste sorting plants: Developing data-driven process models of industrial-scale sensor-based sorting units by combining machine learning with near-infrared-based process monitoring ,Resources, Conservation and Recycling , Vol. 200 ,pp 107257 , 2024, https://doi.org/https://doi.org/10.1016/j.resconrec.2023.107257 - ,
Improvement of the recycling of plastics in lightweight packaging treatment plants by a process control concept ,Waste Manag Res , Vol. 37 ,pp 120 - 126 , 2019, https://doi.org/https://doi.org/10.1177/0734242X19826372 - ,
The ReWaste4.0 ,Project-A Review , Vol. 9 ,pp 764 , 2021, https://doi.org/https://doi.org/10.3390/pr9050764 - Chair of Waste Processing Technology and Waste Management, 2024, https://www.avaw-unileoben.at/en/research/projects/rewaste-f., Accessed
- , The analysis of time series: Theory and practice, 1975
- ,
Statistics: The path to data analysis.(in German) 8th ed. Berlin, Heidelberg: Springer Spektrum , 2016, https://doi.org/https://doi.org/10.1007/978-3-662-50372-0 - , Data Science Crash Course. An interactive and practical introduction (in German, Data-Science-Crashkurs, Eine interaktive und praktische Einführung) Heidelberg, Germany, 2022
- , Process control for practioners: How to tune PID controllers and optimise control loops, Opticontrols, 2012
- , Continuous feeding of subsequent waste treatment machines by optimising the output flow of a primary shredder (in German, Gleichmäßige Beschickung nachgeschalteter Aggregate durch die Vergleichmäßigung des Durchsatzes eines Vorzerkleinerers), Master’s Thesis, 2023
- ,
Treatment of solid waste ,Introduction to circular economy 5th ed (in German, Aufbereitung fester Abfallstoffe) ,pp 189 - 252 , 2017, https://doi.org/https://doi.org/10.1007/978-3-8348-2257-4_6.


