


The issue of climate change is becoming increasingly pressing, and society is putting pressure on organisations to reduce greenhouse gas (GHG) emissions [1]. The European Green Deal promotes and supports this initiative [2]. One of the main goals of the European Commission is for Europe to become a climate-neutral continent by 2050. The deal encompasses areas of activity such as the economy, energy, transportation, and more [3]. In this way, organisations strive to control their carbon footprint. The carbon footprint measures the amount of GHG emissions, primarily carbon dioxide, associated with an activity or product [4]. The carbon footprint is a fundamental basis for quantitatively assessing the environmental impact by combining direct and indirect GHG emissions, expressed as carbon dioxide equivalent (CO2 eq) [5].
Despite all the documents and plans provided by European member states and the European Commission, it is challenging to determine how the European Union has positioned itself to achieve the goals of the Green Deal [6]. Relying solely on general recommendations and methods is insufficient to attain this objective [7]. There is a need to implement ecological sustainability and resilience in water supply projects and encourage organisations and local communities to support this initiative [8]. It is crucial to consider the specificities of the industry or organisation under investigation. Working towards achieving this goal should be done directly, with a comprehensive understanding of all the details of the chosen field of activity.
A range of risk reduction strategies related to global warming focus on reducing GHG emissions, a significant cause of climate change [9]. It is necessary to consider indicators that relate not only to the method of their calculation but also to the interpretation of the results [10]. A series of frameworks and standards have been developed to assist organisations in measuring, reporting, and reducing their carbon footprint [11]. The GHG Protocol recommends that organisations measure and report direct and indirect emissions, providing guidelines on how to do so using standardised methodologies [12]. In their study, the authors of [13] considered both direct and indirect emissions. Direct emissions can be described as the release of emissions in each process or activity of the investigated company. Indirect emissions result from energy consumption in each process or activity of the company [14]. Scope 1 represents all direct emissions from sources owned or controlled by the company, and their investigation was carried out by Vasquez et al. [15]. Scope 2 represents indirect emissions from purchased/acquired electricity, steam, heat or cooling. Ibrahim et al. studied these emissions in their work [16]. Scope 3 encompasses other indirect emissions arising from the consequences of various value chain activities of the company. Downie and Stubbs described the importance of considering emissions from this scope in detail [17]. Until recently, emissions from Scope 3 did not receive much attention. However, today, organisations are trying to account for these emissions to calculate their carbon footprint as accurately as possible. In the study by Shin and Searcy, Scope 3 accounted for 46.4% of the total carbon footprint [18].
Global sustainability challenges depend on the ability of urban systems to provide innovative urban solutions and approaches [19]. Water and energy are two pivotal areas for future sustainable development [20]. Global water use, storage, and distribution account for approximately 10% of global GHG emissions [21]. Water resources management is a complex sector that encompasses various processes, infrastructures, and interactions with the surrounding environment [22]. As water management organisations contribute to the overall carbon footprint through various activities, controlling and reducing their emissions play a significant role in mitigating climate change and achieving the goals of the Green Deal [23]. Research in this sector provides valuable information about the overall environmental efficiency of organisations and identifies areas that require improvement [24]. It is important to identify key areas with high GHG emissions or other environmental problems and propose measures to reduce them [25].
The path to net zero is typically complex and involves difficult compromises between regional improvement and global sustainability [26]. Choosing the right methodology to work with this research is important in this situation. Managing a water network metabolism depends on estimating incoming and outgoing flows related to the life cycle of the products and processes involved [27]. Based on a review of methods proposed by modern science and considering knowledge from experience, it was decided to work with the LCA methodology in this study. Bai et al. considered life cycle assessment (LCA) a promising tool for supporting such compromises [28]. Corominas et al. believed that for a more environmentally sustainable water supply and sanitation, LCA is a valuable tool for identifying the broader impact of design and operational decisions on the environment [29]. In their work, Lorenzo-Toja et al. adhered to the view that LCA is the most common method for assessing environmental impact, allowing for a comprehensive analysis of all elements of the wastewater treatment (WWT) system [30]. These characteristics of the method have prompted us to use this methodology. When calculating the carbon footprint for similar organisations, it is necessary to consider all energy, material, and human factors involved in this process. The LCA methodology can sometimes be a complex choice, as it requires specific data that may not always be readily available. Therefore, it is necessary to make assumptions, gather data from the literature or similar cost chains, or use models that contain standard values [31]. The LCA methodology works with data that allows us to assess resource use and the volume of pollution generated, such as solid waste and emissions released into the environment [32]. One of the advantages of the chosen method is the convenience of conducting comparative analysis for different scenarios of the selected process. It is possible to use the information obtained through LCA as part of a more comprehensive decision-making process and to understand broader and more general changes when comparing products or processes [33]. Paulu et al. applied LCA to model material and energy flow processes to better understand the impact of WWT technologies and the correct direction of their development [34].
The water management sector is currently facing a challenging task. On the one hand, there are stricter water quality standards and increasing demand for water, and on the other hand, there is a need to adapt to climate change and reduce greenhouse gas emissions [35]. It becomes evident that water supply will constrain the development of the energy sector at the national and regional levels, thereby leading to increased emissions [36]. Researchers from [37] contend that the nexus between water and energy compels water industry professionals to support the goals of water productivity with reduced energy consumption and lower greenhouse gas emissions. It also encourages the adoption of sustainable technologies. Water management organisations are working on reducing their impacts on the environment, recognising their emissions' importance. For example, since 2010, British water supply companies have been required to report their emissions as part of their carbon reduction commitments [38]. Based on existing approaches, the industry has developed standardised carbon accounting methodologies to meet this requirement, but this process has revealed gaps in knowledge that require further research [39]. Information about the organisation's overall carbon footprint is required to identify the driving vectors that will lead an organisation to reduce emissions [40]. Xu used the LCA methodology to study the carbon footprint of two WWT plants in Madrid. The results showed that a massive portion of the carbon footprint from the treatment plants was due to indirect CO₂ emissions from intensive energy consumption [41]. Sambito and Freni studied GHG emissions from the life cycle of drinking water supplied through the water supply system. This study helped water resource management improve the current carbon footprint of the system, considering only the operational phase [42].
The municipal water resource management systems, the case study area considered in the present research, are complex and involve many diverse processes. Water management organisations are multifunctional and encompass numerous auxiliary processes [43]. One of the key processes of water management companies is WWT [44]. Emissions from treatment facilities have always been a concern. Using carbon footprint analysis, Parravicini et al. evaluated direct and indirect GHG emissions from two municipal treatment plants. The results show that direct nitrous oxide emissions from tanks with active sludge dominate the carbon footprint of treatment plants with moderate nitrogen removal [45]. Mannina et al. also investigated direct and indirect GHG emissions associated with a treatment plant's biological and physical processes. They concluded that the ratio between the influential concentration of biodegradable carbon and nitrogen plays a key role in emissions from the denitrification process [46]. Silva et al. considered introducing new approaches to recover energy from wastewater sludge essential. They investigated the feasibility of implementing full-scale co-fermentation of municipal wastewater sludge with fruit biowaste due to the synergistic effect observed at the laboratory scale [47]. As a result, the energy potential and productivity of the anaerobic process increased. Additionally, heat recovery from wastewater is worthy of attention in this situation, as it may become part of the solution to the climate crisis in the future [48].
This scientific research aims to provide a valuable resource for the water sector by offering a systematic approach to calculating the carbon footprint and recommendations for achieving zero emissions. The beginning of the article is dedicated to describing the selected organisation, where the characteristics and specifics of the investigated organisation are disclosed. Subsequently, the importance of the correct methodology choice is emphasised, and the chosen methodology is described. The article then provides information on data collection and calculating the carbon footprint. Finally, the results are analysed, and recommendations are presented to assist organisations in achieving carbon neutrality.
Calculating an organisation's carbon footprint is crucial in understanding and reducing its environmental impact. The information required for implementing this process should encompass data about the organisation's activities, including details on electricity and fuel consumption, water usage, waste generation, and other significant factors contributing to carbon emissions. Significant attention should be given to applying the chosen methodology, necessitating knowledge and skills. A comprehensive approach is required to achieve the desired outcome in this regard.
The process of selecting the organisation for the study involves assessing the organisation's activities, experience, transparency, and alignment with our goals and interests. In this situation, it is worth paying attention to the company's experience and competence in implementing sustainable practices. For this research, the transparency of the organisation's policies is crucial. Adherence to internationally recognised standards and guidelines for reporting and disclosure, such as the GHG Protocol or ISO 14064, was a significant argument in this situation.
The organisation chosen for the study was Pražské vodovody a kanalizace, a.s. (Prague Water and Sewerage Company, from now on referred to as "PVK”), which is in Prague, the capital of the Czech Republic. Their policy is oriented towards sustainability and conservation of natural resources. The organisation has committed to achieving a net-zero operational CO2 footprint by 2035. They have developed a roadmap for a carbon reduction project to accomplish this goal. The first part of their work is planning and analysing their activities, including carbon footprint calculation and final certification of annual reports following ČSN ISO 14064-1. The next step will involve the implementation of technical innovations and modifications in the company's operations. The organisation gives special attention to enhancing the energy efficiency of WWT processes and providing a low-carbon heat supply.
This company operates the water infrastructure of the city of Prague and is the largest water supply and wastewater company in the Czech Republic. PVK is involved in the production and distribution of drinking water and the removal and treatment of wastewater. Currently, the activities of this company provide water production for 1.33 million residents of Prague and another 225,000 inhabitants of the Central Bohemian Region. The activities of this company encompass a wide range of processes and services. Drinking water is produced in two water plants. Most wastewater is treated in the central WWT plant, consisting of the existing water line, the new water line and the common sludge management. In addition, PVK maintains 23 subsidiary treatment facilities, but these plants mostly lack their sludge management infrastructure [49]. In addition to the activities, the organisation is also involved in biogas production, which contains methane, a by-product of the WWT process at central WWT. All the information presented above distinguishes PVK from other water management organisations in the Czech Republic, making it an excellent option for further research.
The study of this company serves as an excellent example for water management organisations in Central Europe, which typically adopt a comprehensive approach to water resource management and consider all factors that impact their activities. Additionally, the investigated organisation follows a river basin management approach, where water resources are managed at the basin or watershed level rather than individual water bodies. This approach recognises the interconnectedness of water systems and encourages coordinated management practices within a specific river basin.
The research aims to determine the carbon footprint, from which recommendations will be made to steer the company toward carbon neutrality. For the study, was used the LCA methodology. This methodology's choice is explained by considering a specific product's impact on the environment and the associated services and technologies. Researching water management organisations using LCA can be particularly valuable due to the unique and specific aspects associated with water resources. Water resource management encompasses a complex and interconnected system, ranging from water supply, treatment, distribution, and utilisation to its return to the environment. LCA can help analyse each stage's environmental impact and resource utilisation, considering their interdependencies. Furthermore, the chosen methodology considers various environmental impacts, including energy consumption, greenhouse gas emissions, water pollution, and habitat disruption.
Importantly, applying LCA methodology enables the identification of areas for optimisation and reduction of environmental impact throughout the supply chain. This methodology should be applied when calculating the carbon footprint because it is characterised by its ability to account for the specificity of water management organisations. For instance, LCA can assist in evaluating the environmental consequences of utilising water resources. Furthermore, this methodology serves as a tool for transparent communication with stakeholders, providing a quantitative assessment of environmental impact and improvements over time, thereby ensuring a systematic approach to environmental compliance assessment and demonstration. It aids organisations in avoiding legal issues and penalties as a solid foundation for setting sustainable goals, implementing changes, and measuring progress over time. This methodology helps water management organisations make informed decisions regarding reducing their environmental impact and promotes the responsible and sustainable management of this vital resource. The LCA methodology has four stages of development.
Stage I−goal and scope definition. Our goal is to calculate and analyse the carbon footprint of the water management organisation. This work calculated the number of emissions caused by PVK in 2022 in CO2 eq. The calculation includes all materials, technologies, and services necessary for the normal functioning of the organisation. The work also considers the geographical location of materials, energy, and services the organisation procured. The geographic scope of the study is continental in scale.
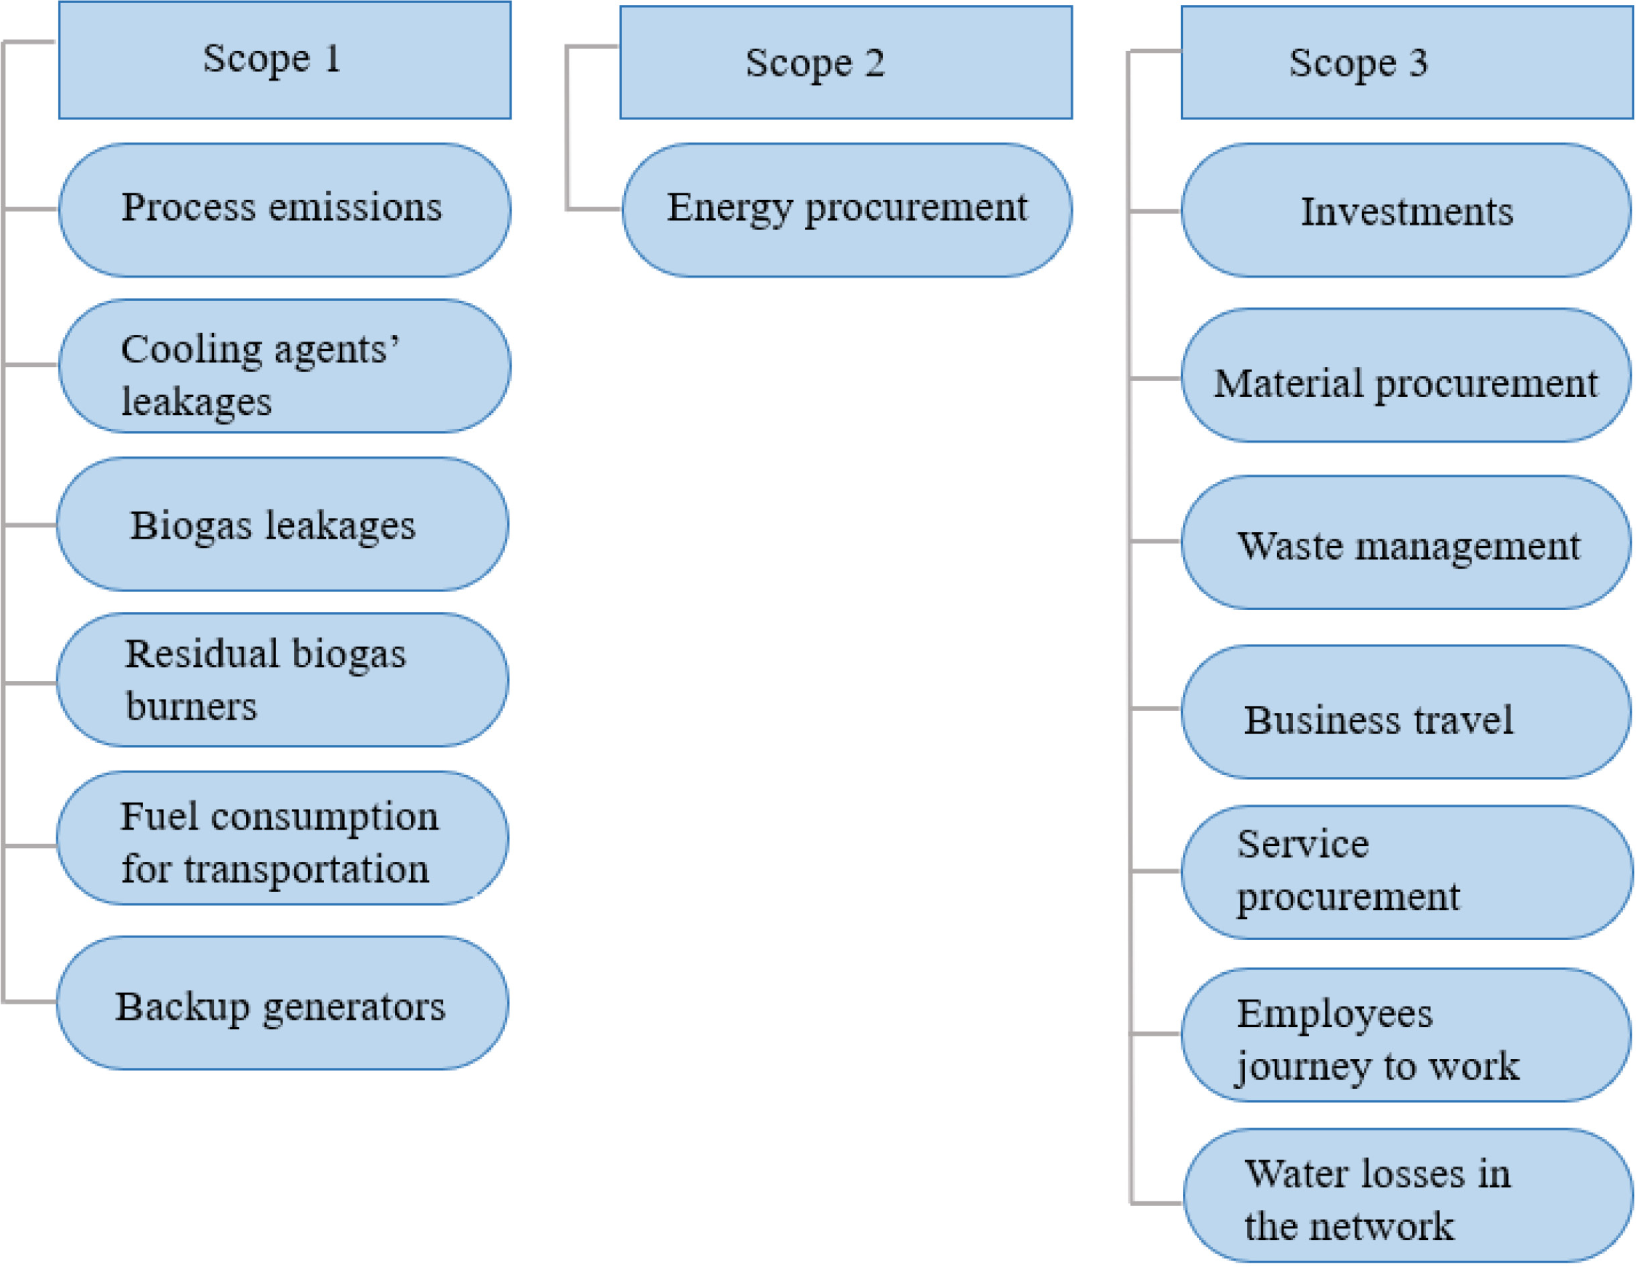
Stage II−life cycle inventory analysis. At this stage, an analysis of the organisation's activities was conducted and defined the boundaries of the investigated system. The scopes of actions are depicted in Figure 1.
All GHG emissions were classified according to Scopes 1, 2, and 3.
Process emissions − this category includes emissions released during WWT.
Cooling agents' leakages − here, emissions of cooling agents used in air conditioning systems were identified.
Biogas leakages − these are emissions that occur during biogas production.
Residual biogas burners − this category includes emissions associated with the combustion of residual biogas not used for energy production. Even though these emissions do not originate in fossil fuels, they were included in the CO2 footprint calculation because this little share of biogas is wasted and not used in CHP units.
Fuel consumption for transportation and diesel generators − this category calculates emissions associated with fuel usage for the organisation's transportation needs and fuel usage for diesel generators.
Backup generators − these are backup generators owned by this organisation
Energy procurement − electricity required for the organisation's operations. This category includes three types of energy: electricity, natural gas, and heat.
Investments - this category includes emissions associated with material and non-material investments by PVK.
Material procurement − includes all emissions related to materials necessary for the organisation's normal functioning.
Waste management − all emissions associated with waste handling.
Business travel − emissions from work-related trips.
Service procurement − all emissions related to the use of services necessary for the organisation's normal functioning.
Employee commuting − emissions from employees' commuting methods to work.
Water losses in the network − emissions resulting from the manufacture of water lost due to pipeline leakages.
The boundaries of the investigated system
Stage III−environmental impact assessment. At the third stage of the chosen methodology, the emissions generated by the organisation's activities in CO2 eq for each of the mentioned categories were calculated. Two methods were utilised to calculate CO2 eq emissions. One part of the calculations was performed using the software "LCA for Experts", while the other emissions calculations were based on specialised literature.
Stage IV−Life Cycle Interpretation. After analysing the obtained calculations, the results were compared with other water management organisations. The outcome of the analysis of the calculations is a system of recommendations aimed at reducing current emissions and moving closer to carbon neutrality.
To calculate emissions and carbon footprint, it is essential to have the necessary information about all material and energy flows associated with this organisation's activities. Data collection for this research involves various methods and sources. Obtaining precise measurements is crucial to ensure the accuracy and validity of the research results [50].
Data on the chemical oxygen demand (COD) and nitrogen quantity at the input, necessary for calculating process emissions, were collected from measuring devices and information records directly within the organisation. The company supplying the material provided information for calculating cooling agent emissions. Gas meters at the central WWT plant directly measured emissions from burning and biogas leakage. Information about the amount of consumed energy was obtained from respective meters.
PVK provided data regarding investments, fuel expenses, and purchased materials and goods in tables extracted from their accounting information system. The information tables on purchased materials and goods did not include information about the weight of the products. Information about the weight of goods is crucial for accurately determining the carbon footprint; thus, this data needs to be obtained directly from the manufacturers of the products. Information about the waste generated because of the company's activities was also provided in the form of a table containing all the necessary data on fuel consumption, types and quantities of waste, and the geographical location of disposal points. Data related to employee commuting within the organisation were obtained through surveys of employees. All the information mentioned above was consolidated into a unified database containing all the necessary data for further calculations.
The calculation of emission factors was performed using several methods. Particular attention was paid to the specifics of each investigated scope and the most accessible method for calculating emission coefficients. GHG emissions were estimated according to SN EN ISO 14064-1 technical requirements. Available professional technical literature was used to calculate process emissions associated with the operation of WWT plants. Furthermore, a search was conducted for the requisite information in environmental databases and reports about environmental research linked to WWT processes. Upon obtaining the necessary emission factors, calculations were performed for emissions of each pollutant and subsequently expressed in CO2 eq. Further details on this process are described in our previous article: "Prague Water Net Zero Strategy 2025 − Methodology and Roadmap" [49].
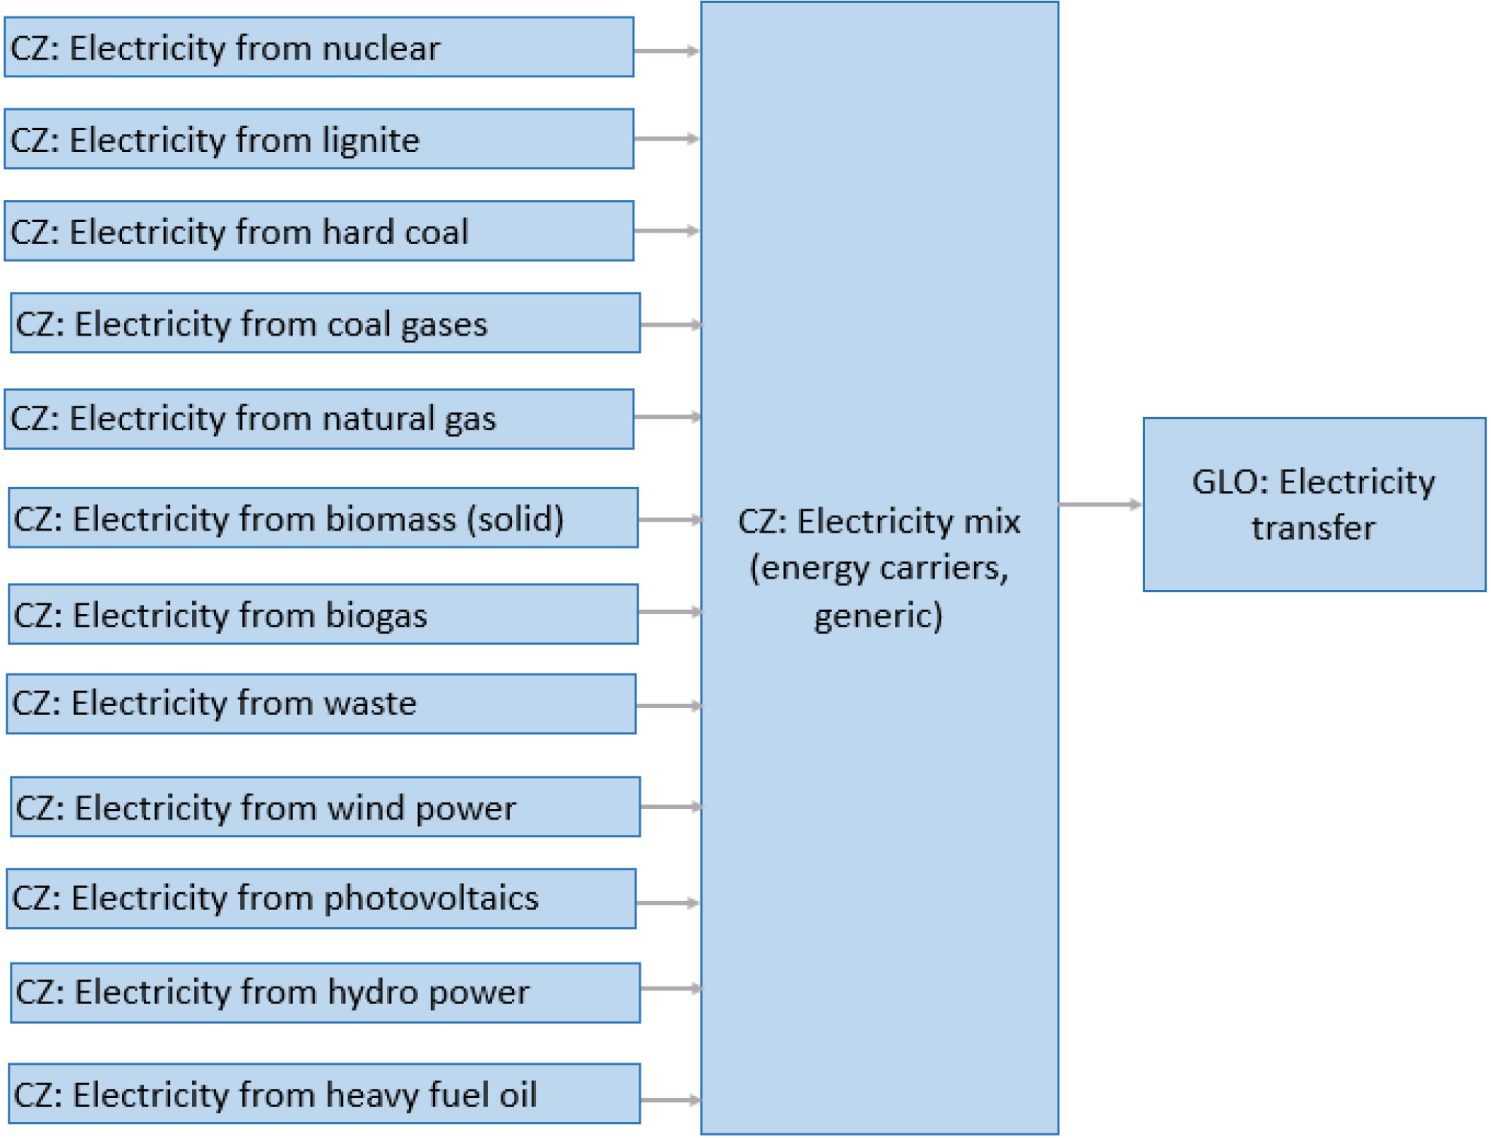
The carbon footprint from energy usage was calculated using emission factors. The emission factors were established by utilising an LCA scheme, with the "LCA for Experts" software employed in its creation. This software calculates economic, environmental, and technological LCAs [51]. The diagram of the created plan in the software is shown in Figure 2.
The Sphere database was used to create this plan. This study did not utilise a specific type of electrical energy dependent on a single fuel type. Instead, a "blend" of energy sources was created for this investigation. The blend created better corresponds to PVK's actual energy consumption. This approach is justified because the organisation does not limit its energy choice to a single type and allows for changing the type of electricity used if necessary. The blend also includes electricity generated from biogas produced within the investigated organisation. The necessary emission coefficient values have been calculated. Using the scheme implemented in the LCA for Experts software, the emission factor for electricity is 0.6128 kg CO2 eq/kWh. Next, based on the information about the amount of electricity consumed, the carbon footprint of Scope 2 was calculated. Emission factors for category Scope 3 were conducted separately for each category. The category of purchased goods includes many products and materials. The approach to calculating emission factors was based on creating an LCA scheme for each product. Since this category encompasses more than 8000 items, assumptions were made on grouping related products into one subcategory. For each group in this subcategory, an LCA scheme was developed. A schematic representation of the scheme is shown in Figure 3. The Sphere Professional database and the Ecoinvent database were used to create the LCA scheme.
LCA scheme for consumed electricity
LCA scheme for materials from the purchased materials category
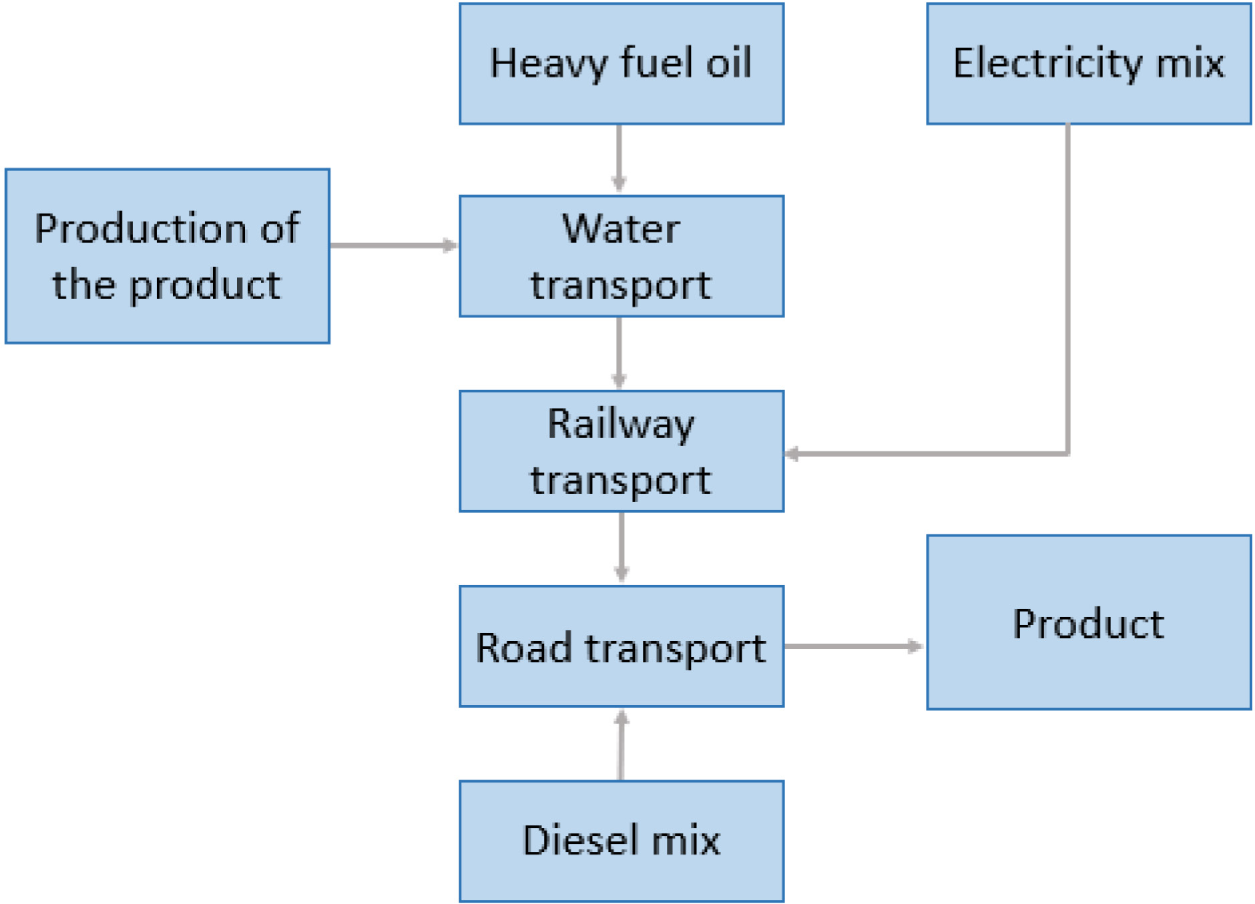
The approach for creating the LCA scheme was based on three hypothetical stages. Firstly, it involved the production process of the product. This stage encompassed all the material and energy resources required for product creation and considered the emissions associated with this activity. The next process in this plan was transporting the manufactured product to the point of direct usage. During this stage's development, the place of production, the distance required for transportation, and the type of transportation and fuel needed for this process were considered. These variables were considered individually for each created plan. The final process involved directly using the product for the company's needs. For these plans, a cradle-to-gate system boundary was chosen. A simplified LCA scheme was developed to complete the life cycle of purchased goods, including their disposal. It provides data on the organisation's overall carbon footprint resulting from the exclusion of all purchased goods in 2022. While creating this plan, all the energy and material resource costs necessary for this process and all associated emissions have been considered. The emission factors necessary for calculating the carbon footprint were determined from the LCA scheme created. In Table 1, for example, the determined emission factors for some products from the purchased items category were presented.
Determined emission factors for some products from the purchased materials category
Product name |
Emission factor for 1 kg product [kg CO2 eq] |
|---|---|
Light bulb |
2.18 |
Monitor |
8.31 |
Cable |
2 |
Steel profile |
2.4 |
Sodium hydroxide 36% |
0.44 |
Sulphuric acid 96% |
0.256 |
Praestol flocculant |
4.57 |
Laboratory glass |
1.84 |
Office chair |
2.88 |
Wooden wardrobe |
0.86 |
Metal wardrobe |
2.89 |
Stainless steel rod |
3.34 |
Electrode |
0.14 |
Steel chain |
2.87 |
Screw |
0.66 |
Work footwear |
4.23 |
Welding wire |
2.3 |
Water meter |
9.26 |
Metal seal |
0.238 |
Copper Pipes |
2.13 |
Cast Iron Pipes |
2.02 |
Pipes brass |
3.49 |
Stainless Steel Pipes |
2.34 |
Pipes concrete |
0.184 |
Disposal of used products |
0.47 |
In addition to the emissions resulting from the potential disposal of purchased goods, the PVK organisation generates other types of waste from the WWT process and civil works. LCA analyses were conducted for these waste types as well. These analyses considered the weight of the waste, the type and quantity of fuel used for their transportation, the distance over which the waste is transported, and the environmental impact caused by the disposal of this waste type. Concerning waste management, an analysis of three different scenarios was conducted. In the first scenario, the waste was transported to a landfill, while in the second scenario, it was incinerated. The third scenario involved sending the waste to a composting facility. The investigated organisation employs each of the specified scenarios depending on the type of waste. Figure 4 illustrates the overarching framework utilised for creating LCA schemes for each waste type the investigated organisation generates.
General scheme of waste management
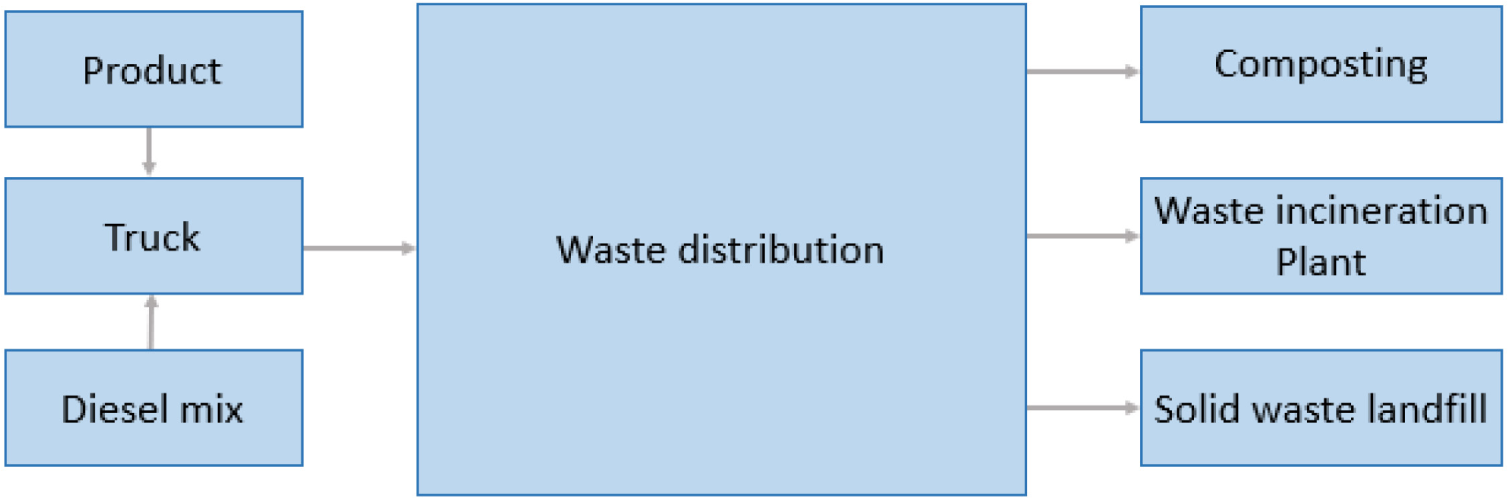
For each waste type, a meticulous evaluation was conducted, considering the geographical location of the facilities under investigation, waste volume, transportation method, and fuel consumption. The emission factors were derived from the generated plans. Table 2 presents the results of determining the emission factors for the waste management sector. The highest emission factor corresponds to sludge from the treatment plant, which is then sent to composting.
Emission factors calculated for waste generated by the organisation
Product name |
Emission factor for 1 kg waste [kg CO2 eq] |
Type of waste management |
|---|---|---|
Asphalt |
0.017 |
Solid waste landfill |
Concrete |
0.018 |
Solid waste landfill |
Sludge from WWT Plant |
0.006 |
Incineration plant |
Sludge from WWT Plant |
0.086 |
Compost plant |
Sand from sand traps at WWT Plant |
0.023 |
Solid waste landfill |
Screened residues of WWT Plant |
0.024 |
Solid waste landfill |
Soil |
0.017 |
Solid waste landfill |
The emission factors for business trips were determined for individual transportation and hotel stays. The carbon footprint of transportation is based on one person-kilometer. Calculating the carbon footprint generated by an employee's stay in the hotel assumed that the most significant impact is the laundering of bed linens. During this calculation, the amount of water, electricity, cosmetics, and the production of the product used in this process have been considered. An inflated mass of bed linen, which needs to be laundered per guest, was chosen as 5 kg. The calculation results are presented in Table 3.
Emission factors for business travel
Type of transport |
Emission factor |
|---|---|
Train |
0.07542 kg CO2 eq per 1 person km |
Coach bus |
0.1092 kg CO2 eq per 1 km travelled |
Airplane |
0.09989 kg CO2 eq per 1 person km |
Passenger car |
0.3029 kg CO2 eq per 1 person km |
Hotel stay |
1.506 kg CO2 eq per 1 hotel stay |
Having information about the number of business trips, the type of transportation used, and the duration of the trips extracted from the organisation´s accounting information system, the overall carbon footprint of this category has been calculated.
The services ordered by the PVK organisation were diverse. A simplified way to assess this category was needed. The basic element of the model was a 50 km drive by an employee in a personal car to perform a service. A service completed in one full working day was valued at 407.98 EUR. With the information about the amount of money spent by PVK on services, the number of business trips made by employees on PVK's request has been determined. Based on the information above, an LCA plan was created to derive the emission factors necessary for calculating the carbon footprint. As a result, the emission factor for one service is estimated as 103.4 kg CO2 eq.
The next category for calculated emission factors was the employees' commute to work. The emission factor information was obtained from the eco-invent database.
An LCA plan has been created to calculate water losses in the network, and the emission factor coefficients have been determined using LCA software for experts. The next step was determining the amount of GHGs per unit of lost water. Thus, the emission factor for 1 ton of lost water is 0.14 kg CO2 eq. The carbon footprints were determined according to the IPCC methodology (version as of August 2021) without biogenic carbon with a global warming potential of 100 years.
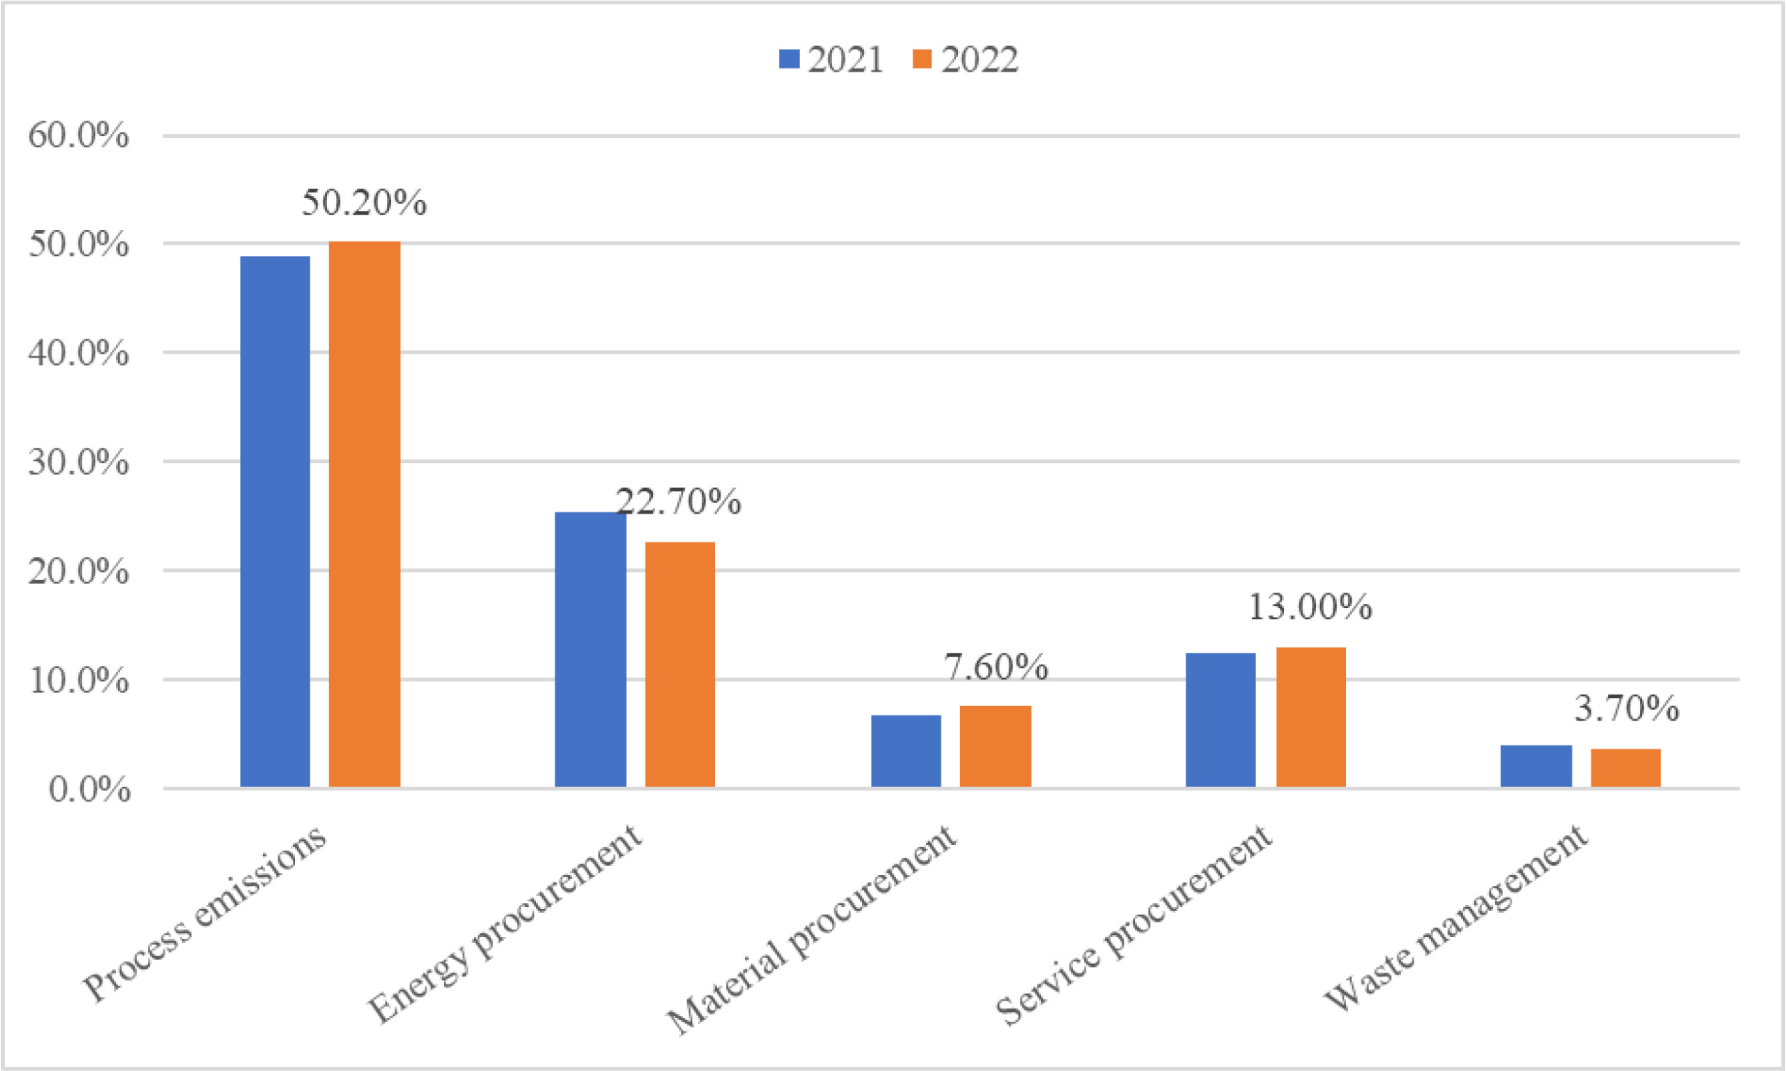
The investigated organisation's emissions and overall carbon footprint have been calculated using the emission factors determined for each of the studied categories. Therefore, the carbon footprint of PVK for 2022 amounted to 198,666 metric tons of CO2 eq. The carbon footprint of PVK for 2021 amounted to 185,631 metric tons of CO2 eq. The year-on-year increase of the carbon footprint is 7.0%. The total distribution of the operational carbon footprint of the PVK for 2021 and 2022 is summarised in Figure 5 and Figure 6. By understanding the distribution in these areas, the organisation can accurately identify emission hotspots to concentrate efforts on reducing emissions where they have the greatest impact. As illustrated in Figure 5, process emissions from WWT plants have the greatest impact on the company's overall carbon footprint, accounting for about half of the carbon footprint.
The PVK's carbon footprint distribution for 2021 and 2022 (categories with a carbon footprint above 1%)
The PVK's carbon footprint distribution for 2021 and 2022 (categories with carbon footprint below 1%)
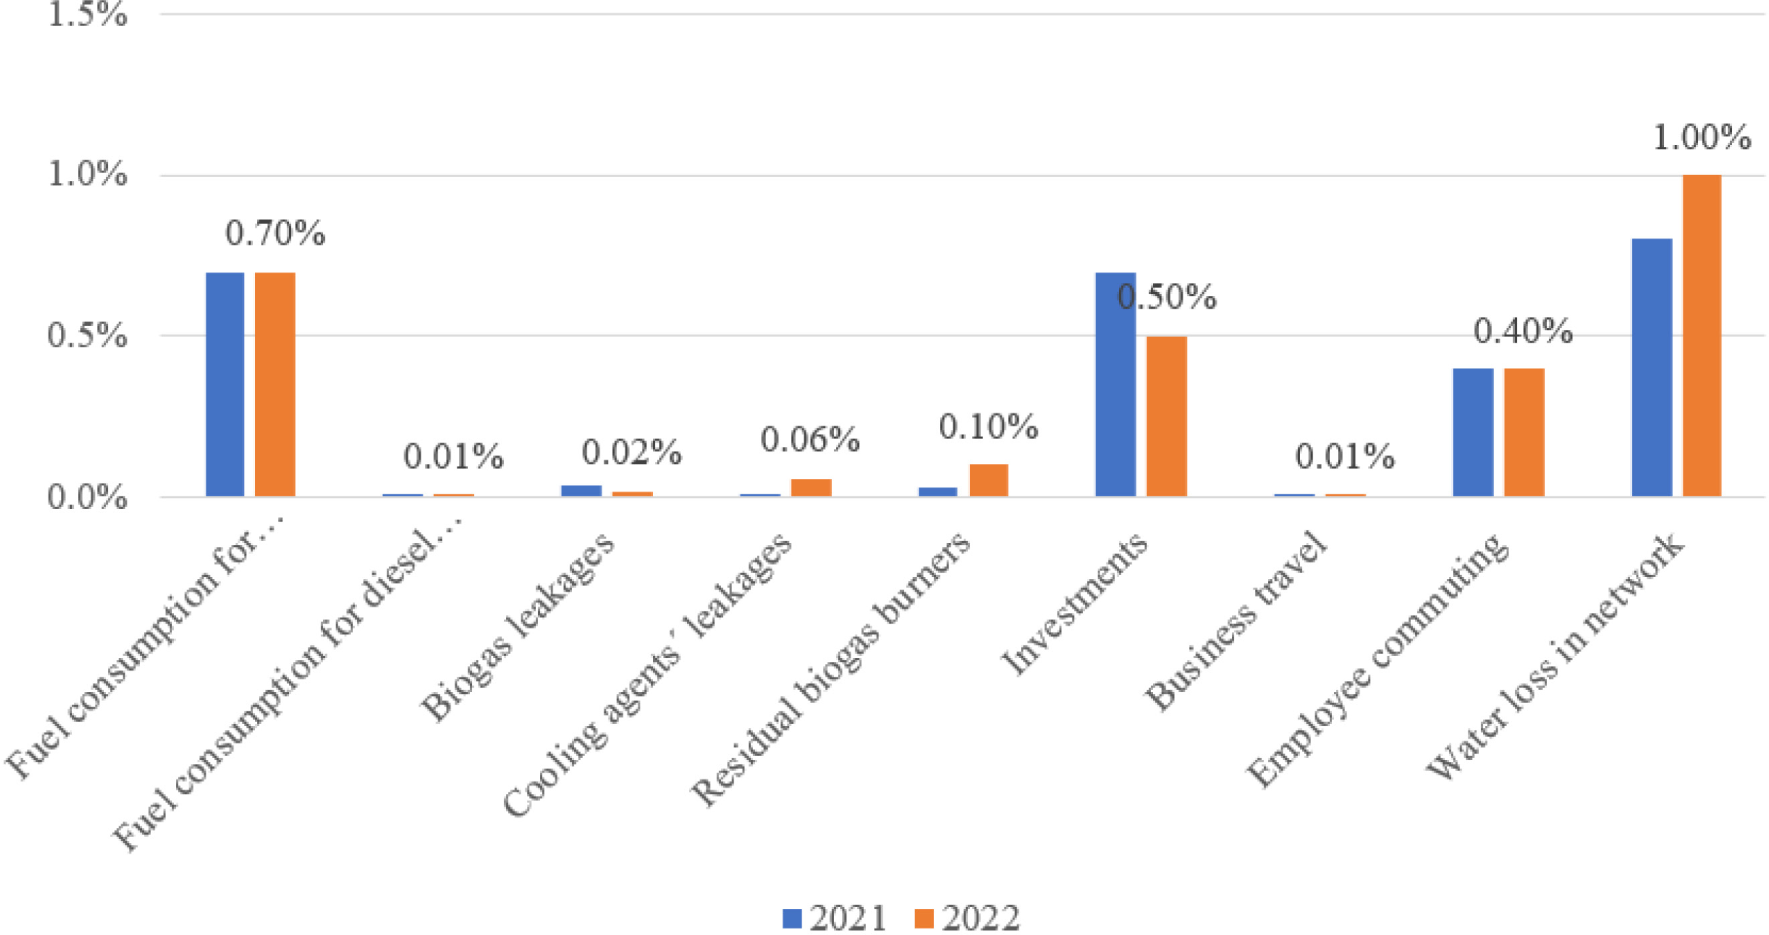
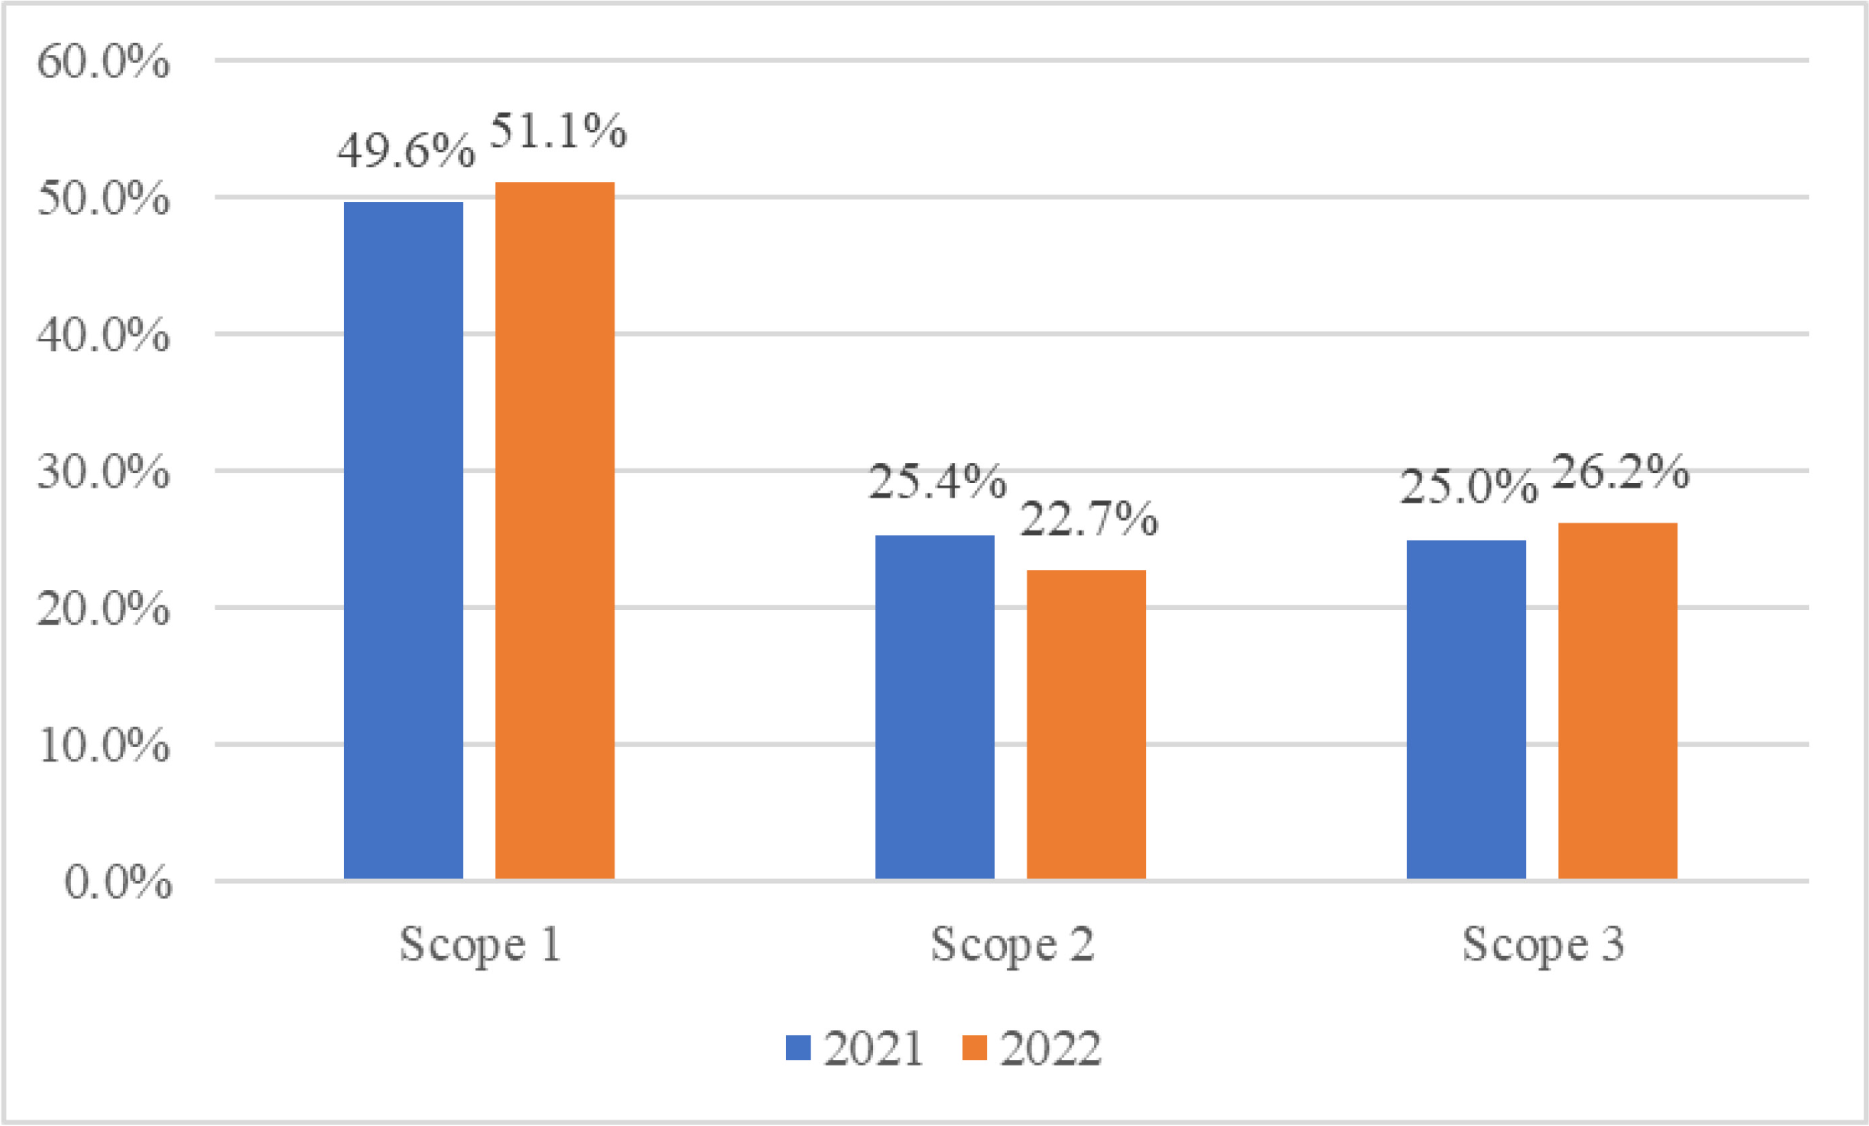
Figure 7 illustrates the organisation's carbon footprint with the distribution of GHG emissions under Scopes 1, 2 and 3, according to the GHG Protocol. This distribution indicates that emissions from each category significantly contribute to the carbon footprint and thus cannot be ignored. Figure 7 also illustrates the importance of considering all emissions, even those not currently regulated by legislation, if one aims to achieve the net-zero emissions target.
Distribution of the organisation's carbon footprint according to the GHG protocol in 2021 and 2022
The year-on-year increase of 7 % in the PVK carbon footprint was assessed. The primary contributors to this marginal increase are the rise in process emissions and the procurement of materials and services. The year-on-year increase in process emissions from WWT plants was 10.0% (48.8% in 2021 and 50.20% in 2022) due to higher COD and nitrogen quantity at the input of WWT plants. The increase in process emissions is attributed to treating a higher load in WWT plants, resulting in greater emissions despite employing the same technology. Emissions resulting from service usage also affect the organisation's carbon footprint, comprising 13.0% of the total.
The escalation in material and service procurement costs can be attributed to the substantial inflationary trends in the Czech Republic. In quantifying these emissions, an emission factor based on expenditures was employed. Consequently, a 15.1% inflation-induced price surge leads to a proportional increase in calculated emissions, as the emission factor remains constant. Energy consumption constituted 22.7% of the total carbon footprint in 2022, a 2.7% decrease compared to 2021 (25.4%) due to higher energy production from biogas [52]. Thus, it can be observed that 85.9% of the organisation's total carbon footprint is the result of emissions from these three categories.
The total carbon footprint of PVK was compared to the total carbon footprint of Severomoravské Vodovody a Kanalizace, a.s. (North Moravian-Silesian Water and Sewerage Company, from now on referred to as "SmVaK"), which is in the northeast of the Czech Republic. This company operates the water infrastructure of the Moravian-Silesian region except Ostrava, the third largest city in the Czech Republic, where a different company operates. It is involved in the production and distribution of drinking water and the removal and treatment of wastewater. The activities of SmVak provide water production for 711,264 residents and treatment of wastewater for 478,685 residents. The total carbon footprint of SmVak for 2022 amounted to 35,350 metric tons of CO2 eq [53]. It is impossible to directly compare the various companies' total emissions due to their scale disparities. Since most emissions are associated with Wastewater Treatment (WWT), we opted to normalise emissions per cubic meter of treated wastewater. The carbon footprint of one treated cubic meter of wastewater of PVK is 1.7 kg CO2 eq, which is higher than SmVak´s 0.8 kg CO2 eq. It is known that SmVak took a different approach, and process emissions from nitrogen quantity at the input of WWT plants are counted as Scope 3; whether COD quantity was counted is not known, nor is the amount of process emission from nitrogen quantity. The article cited above does not mention whether services are counted in Scope 3, which is 13.0% of the total emissions of PVK.
Based on the analysis of the results obtained and their comparison with other water management organisations, PVK can create practical and effective methods to reduce its carbon footprint. Below are key recommendations for PVK and similar organisations to reduce carbon emissions and work towards achieving net-zero emissions. Considering that process emissions from WWT plants account for about half of the carbon footprint, optimising these processes to minimise emissions is crucial. Emissions in this sector are primarily associated with energy usage but are not the primary source. Therefore, to achieve this goal, it is necessary to prioritise increasing energy efficiency. A positive outcome can be achieved by replacing outdated equipment with more modern, energy-efficient alternatives. Special attention should be given to implementing new and more efficient pumps, engines, and compressors, which can significantly reduce emissions by reducing energy consumption. Energy costs can also be reduced through variable frequency drives (VFDs). Installing VFDs on pumps and motors allows for regulating their speed according to requirements, thereby reducing energy losses.
It is worth implementing energy recovery technologies, such as heat exchangers, to capture and utilise the waste heat generated during the WWT process to enhance the energy efficiency of the water treatment plant. Wastewater serves as an ideal foundation for harnessing heat and serves as a renewable energy source. Research conducted by Mirl et al. indicates that wastewater heat is sufficient for supplying 3% of all buildings with heating or cooling. Thanks to the optimal temperature of the source (10−25 °C throughout the year), heat pumps for wastewater achieve elevated levels of productivity [54]. Furthermore, reducing the temperature of wastewater will minimise its impact on the aquatic environment. In addition, it is possible to consider using a heat pump in hot water supply systems. Heat pump application in the heating system of a residential multi-story building during the inter-heating season can lead to a reduction in network water consumption and centralised cooling [55]. Also of interest is the study, which discusses the possibility of reusing recovered heat in an aerated reservoir, resulting in a temperature increase of 6 °C; it can enhance the removal of ammonia by 61% [56].
Lowering emissions from biological treatment procedures, such as the activated sludge process, can also positively impact the studied organisation's carbon footprint. It is recommended that alternate treatment methods that use fewer chemicals and energy be investigated or that dangerous chemicals be replaced with more ecologically friendly alternatives. Not all low-emission solutions, such as constructed wetlands, are suitable for large cities. Other intense low-emissions wastewater treatment approaches, such as anaerobic digestion with biogas recovery in mainline, algae-based treatment systems, or membrane bioreactors with energy recovery, are under investigation.
Lowering GHG emissions trends sometimes conflict with increasing standards for removing so-called micropollutants. Removing these substances requires modern technologies, such as adopting Advanced Oxidation Processes (AOPs) or advanced ultraviolet (UV) systems or solutions. Although AOPs can successfully digest organic pollutants and toxins, they will raise energy requirements. In addition, one can consider the recovery of phosphorus and nitrogen from wastewater, which can then be reused or sold, thereby reducing the costs of energy-intensive energy processes.
Regarding emissions reduction in Scope 2, it is essential to transition to renewable energy sources, such as solar, wind, and hydroelectric power stations. A notable example is Scottish Water, which, after analysing its carbon footprint, prioritised increasing energy efficiency and gradually transitioning to renewable energy sources, resulting in an approximate 45% reduction in its carbon footprint [57]. Unfortunately, the geographical location and natural conditions do not always allow organisations to fully rely on renewable energy sources. However, in this situation, it should be noted that in PVK, the most significant environmental impact comes from process emissions. In comparison, energy-related emissions take precedence in water utilities organisations such as Scottish Water or Anglian Water. Such a difference results from biogas use in the energy supply at PVK's treatment plants. Despite this, most efforts for the investigated organisation should still be directed towards improving the water treatment process to options; using smart grid technology may also benefit the organisation. This technology optimises energy consumption based on real-time data on demand and prices or participation in demand response programs offered by utility companies. Maintaining an energy management system for actively monitoring and controlling energy consumption within the organisation would also be a great approach. Real-time data and analytics can facilitate better decision-making for improving energy efficiency.
In Scope 3, the purchased services have the largest impact on the carbon footprint. By considering the environmental impact of our service providers and making informed choices, PVK's carbon footprint was significantly reduced. When ordering the necessary services, it is important to prioritise service providers with good environmental characteristics. Factors such as their carbon footprint, environmental certifications, and commitments to sustainable development should be considered. Depending on the type of service or service purchased, preference should also be given to virtual meetings or remote services, if possible.
An important aspect of this situation is to involve all employees in this goal. Therefore, training and awareness regarding emission reduction, sustainable development, and environmental issues are crucial in achieving the desired outcome. By fostering a culture of environmental responsibility and providing employees with the necessary knowledge and skills, the water management organisation can implement effective strategies and practices to minimise its environmental impact. When all employees understand the importance of the set objectives, they are more likely to actively participate in their achievement. Employee awareness can lead to positive changes in their behaviour at work and personal lives, resulting in a cumulative effect of reducing the organisation's overall impact on the environment. Engaged and informed employees are more likely to propose innovative ideas for emission reduction and improved sustainable development.
Consumer feedback and support is another important aspect. The authors of [58] have developed an open management web platform that integrates real-time knowledge about water supply and demand from sources to users across various geographical and organisational scales. This platform is supported by a knowledge base where information is structured within a water resource management ontology to ensure compatibility and maximum usability.
Investments and regular political support can also influence the outcome. Investments in research and development of new, more energy-efficient, and environmentally friendly purification technologies and processes will contribute to achieving the set goal. Collaboration and support from governing bodies and political organisations will enhance motivation toward achieving net-zero emissions. In this situation, reaching the goal requires a comprehensive approach and participation from all stakeholders so that any contribution will be beneficial.
The path to achieving carbon neutrality begins with calculating and analysing one's carbon footprint. Having adequate information and experience is crucial to reaching this goal. This work serves as another example that acts as a driving force for other companies on the path to carbon neutrality. The practice has shown that LCA methodology is an important scientific tool through which the foundation for calculating greenhouse gas emissions can be obtained. According to the research results, the primary efforts for reducing greenhouse gas emissions should be directed in three directions: technological emissions, purchased electricity, and purchased services. Working on reducing emissions in these categories will yield visible results and provide a solid foundation for further goal attainment. Among the key strategies that can help reduce their carbon footprint, organisations should focus on increasing energy efficiency, transitioning to renewable energy sources, implementing water efficiency programs, and monitoring emissions from WWT processes.
Controlling the procurement of goods and services will have a noticeable impact on the path to cleaner emissions. It involves choosing certified products and services whose owners make efforts to control their carbon footprint. Equally important for achieving the goal is the training and development of employees, including developing environmental awareness, familiarisation with modern technologies, norms, and standards, and integrating sustainability into the company's daily life. All these steps, one by one, bring the organisation closer to achieving carbon neutrality. Compared to 2021, there are noticeable changes in the organisation's carbon footprint. More time is needed to achieve visible results on the path to net-zero emissions, as the processes mentioned above are typically long-term and require preparation. Reducing the carbon footprint of water management organisations requires a multifaceted approach combining energy efficiency measures, adopting renewable energy sources, process optimisation, and a commitment to sustainable development. Continuous monitoring and adaptation to evolving technologies and regulations are crucial for achieving tangible results.
LCA |
Life Cycle Assessment |
CO2 eq |
Carbon Dioxide Equivalent |
GHG |
Greenhouse Gas |
PVK |
Prague Water and Sewerage Company |
IPCC |
Intergovernmental Panel on Climate Change |
WWT |
Wastewater Treatment |
AOP |
Advanced Oxidation Processes |
VFD |
Variable Frequency Drive |
COD |
Chemical Oxygen Demand |
UV |
Ultraviolet |
SmVaK |
North Moravian-Silesian Water and Sewerage Company |
- ,
Climate Change and Vulnerabilities of the European Energy Balance ,Journal of Sustainable Development of Energy, Water and Environment Systems , Vol. 3 (1),pp 106-117 , 2015, https://doi.org/https://doi.org/10.13044/j.sdewes.2015.03.0008 - ,
The role of photovoltaics for the European Green Deal and the recovery plan ,Renewable and Sustainable Energy Reviews , Vol. 144 ,pp 111017 , 2021, https://doi.org/https://doi.org/10.1016/j.rser.2021.111017 - ,
The European Green Deal: Assessing its current state and future implementation ,FIIA Working paper , 2020 - ,
A Descriptive Review of Carbon Footprint ,2nd International Conference on Human Systems Engineering and Design (IHSED) - Future Trends and ApplicationsAdvances in Intelligent Systems and Computing , Vol. 1026 ,pp 960-968 , 20192020, https://doi.org/https://doi.org/10.1007/978-3-030-27928-8_144 - ,
What is a footprint? A conceptual analysis of environmental footprint indicators ,Journal of Cleaner Production , Vol. 285 , 2021, https://doi.org/https://doi.org/10.1016/j.jclepro.2020.124833 - ,
Regional spatial planning for implementing the European Green Deal: a new method of assessment applied to the metropolitan area of Florence ,Planning Practice & Research , Vol. 38 (4),pp 581-611 , 2023, https://doi.org/https://doi.org/10.1080/02697459.2023.2230014 - ,
Contemporary Crises and Sustainability Indicators ,Journal of Sustainable Development of Energy, Water and Environment Systems , Vol. 2 ,pp 100-107 , 2014, https://doi.org/https://doi.org/10.13044/j.sdewes.2014.02.0009 - ,
Sustainability Assessment and Identification of Determinants in Community-Based Water Supply Projects using Partial Least Squares Path Model ,Journal of Sustainable Development of Energy, Water and Environment Systems , Vol. 5 ,pp 345-358 , 2017, https://doi.org/https://doi.org/10.13044/j.sdewes.d5.0153 - ,
Greenhouse Gas Emissions from Global Cities ,Environmental Science & Technology , Vol. 43 (19),pp 7297-7302 , 2009, https://doi.org/https://doi.org/10.1021/es900213p - ,
Sustainability Assessment of Innovative Energy Technologies – Hydrogen from Wind Power as a Fuel for Mobility Applications ,Journal of Sustainable Development of Energy Water and Environment Systems , 2020, https://doi.org/https://doi.org/10.13044/j.sdewes.d8.0371 - ,
Strategies for reducing the carbon footprint of field crops for semiarid areas. A review ,Agronomy for Sustainable Development , Vol. 31 (4),pp 643-656 , 2011, https://doi.org/https://doi.org/10.1007/s13593-011-0011-7 - ,
Managing Business Greenhouse Gas Emissions: The Greenhouse Gas Protocol – A Strategic and Operational Tool ,Corporate Environmental Strategy , Vol. 9 (2),pp 137-144 , 2002, https://doi.org/https://doi.org/10.1016/S1066-7938(02)00004-0 - ,
Global sector-specific Scope 1, 2, and 3 analyses for setting net-zero targets: agriculture, forestry, and processing harvested products ,Sn Applied Sciences , Vol. 4 (8), 2022, https://doi.org/https://doi.org/10.1007/s42452-022-05111-y - , GHG Protocol (Carbon Footprint Analysis: Concepts, Methods, Implementation, and Case Studies), 2013
- ,
Evaluation of greenhouse gas emissions and proposals for their reduction at a university campus in Chile ,Journal of Cleaner Production , Vol. 108 ,pp 924-930 , 2015, https://doi.org/https://doi.org/10.1016/j.jclepro.2015.06.073 - ,
Greenhouse gas emissions from cities: comparison of international inventory frameworks ,Local Environment , Vol. 17 (2),pp 223-241 , 2012, https://doi.org/https://doi.org/10.1080/13549839.2012.660909 - ,
Evaluation of Australian companies' scope 3 greenhouse gas emissions assessments ,Journal of Cleaner Production , Vol. 56 ,pp 156-163 , 2013, https://doi.org/https://doi.org/10.1016/j.jclepro.2011.09.010 - ,
Evaluating the Greenhouse Gas Emissions in the Craft Beer Industry: An Assessment of Challenges and Benefits of Greenhouse Gas Accounting ,Sustainability , Vol. 10 (11), 2018, https://doi.org/https://doi.org/10.3390/su10114191 - ,
Benchmarking South East European Cities with the Sustainable Development of Energy, Water and Environment Systems Index ,Journal of Sustainable Development of Energy, Water and Environment Systems , Vol. 6 ,pp 162-209 , 2018, https://doi.org/https://doi.org/10.13044/j.sdewes.d5.0179 - ,
Water Scenarios Modelling for Renewable Energy Development in Southern Morocco ,Journal of Sustainable Development of Energy, Water and Environment Systems , 2020, https://doi.org/https://doi.org/10.13044/j.sdewes.d8.0335 - ,
Towards a common carbon footprint assessment methodology for the water sector ,Water and Environment Journal , Vol. 26 (1),pp 63-69 , 2012, https://doi.org/https://doi.org/10.1111/j.1747-6593.2011.00264.x - ,
Policy implications of climate change impacts on water resources management ,Water Policy , Vol. 1 (2),pp 159-175 , 1998, https://doi.org/https://doi.org/10.1016/S1366-7017(98)00018-X - ,
Integrated water resources management: Concepts and issues ,Physics and Chemistry of the Earth, Parts A/B/C , Vol. 33 (5),pp 290-297 , 2008, https://doi.org/https://doi.org/10.1016/j.pce.2008.02.003 - ,
Sustainable Water Resources Management ,Water International , Vol. 25 (1),pp 3-10 , 2000, https://doi.org/https://doi.org/10.1080/02508060008686793 - ,
The Use of System Dynamics Simulation in Water Resources Management ,Water Resources Management , Vol. 23 (7),pp 1301-1323 , 2009, https://doi.org/https://doi.org/10.1007/s11269-008-9328-7 - ,
Net-zero water management: achieving energy-positive municipal water supply , 2016, https://doi.org/https://doi.org/10.1039/C5EW00204D - ,
Metabolic Approach for Estimating the Environmental Loads Associated with Water Distribution Network of Rende: Life Cyle Assessment Application with Impact 2002+ ,Journal of Sustainable Development of Energy, Water and Environment Systems , Vol. 9 (4),pp 1-14 , 2021, https://doi.org/https://doi.org/10.13044/j.sdewes.d8.0323 - ,
Modeling the oxygen-depleting potential and spatially differentiated effect of sewage organics in life cycle assessment for wastewater management ,Science of the Total Environment , Vol. 655 ,pp 1071-1080 , 2019, https://doi.org/https://doi.org/10.1016/j.scitotenv.2018.11.203 - ,
Life cycle assessment applied to wastewater treatment: State of the art ,Water Research , Vol. 47 (15),pp 5480-5492 , 2013, https://doi.org/https://doi.org/10.1016/j.watres.2013.06.049 - ,
Dynamic environmental efficiency assessment for wastewater treatment plants ,International Journal of Life Cycle Assessment , Vol. 23 (2),pp 357-367 , 2018, https://doi.org/https://doi.org/10.1007/s11367-017-1316-9 - ,
Comparison of Results from Life Cycle Assessment when Using Predicted and Real-life Data for an Anaerobic Digestion Plant ,Journal of Sustainable Development of Energy, Water and Environment Systems , Vol. 9 (3), 2020, https://doi.org/https://doi.org/10.13044/j.sdewes.d8.0373 - ,
On process optimisation considering LCA methodology ,Journal of Environmental Management , Vol. 96 (1),pp 43-54 , 2012, https://doi.org/https://doi.org/10.1016/j.jenvman.2011.10.014 - ,
Significance of decision-making for LCA methodology ,Environmental Impact Assessment Review , Vol. 20 (1),pp 113-123 , 2000, https://doi.org/https://doi.org/10.1016/S0195-9255(99)00035-9 - ,
Combining Process Modelling and LCA to Assess the Environmental Impacts of Wastewater Treatment Innovations ,Water , Vol. 13 (9), 2021, https://doi.org/https://doi.org/10.3390/w13091246 - ,
Greenhouse-gas emissions from energy use in the water sector ,Nature Climate Change , Vol. 1 (4),pp 210-219 , 2011, https://doi.org/https://doi.org/10.1038/nclimate1147 - ,
Intertwined impacts of water, energy development, and carbon emissions in China ,Applied Energy , Vol. 238 ,pp 78-91 , 2019, https://doi.org/https://doi.org/10.1016/j.apenergy.2018.12.085 - ,
Urban water-cycle energy use and greenhouse gas emissions ,Journal AWWA , Vol. 106 (2),pp E86-E97 , 2014, https://doi.org/https://doi.org/10.5942/jawwa.2014.106.0017 - ,
The use of data envelopment analysis in the regulation of UK water utilities: Water distribution ,European Journal of Operational Research , Vol. 126 (2),pp 436-453 , 2000, https://doi.org/https://doi.org/10.1016/S0377-2217(99)00303-3 - ,
Carbon Accounting in the United Kingdom Water Sector: A Review ,Water science and technology: a journal of the International Association on Water Pollution Research , Vol. 60 ,pp 2721-7 , 2009, https://doi.org/https://doi.org/10.2166/wst.2009.708 - ,
Assessing the carbon footprint of water production ,Journal AWWA , Vol. 100 (6),pp 80-91 , 2008, https://doi.org/https://doi.org/10.1002/j.1551-8833.2008.tb09654.x - , The carbon footprint analysis of wastewater treatment plants and nitrous oxide emissions from full-scale biological nitrogen removal processes in Spain, M.Sc. Thesis, MIT, Department of Civil and Environmental Engineering, 2013
- , LCA methodology to quantify the carbon footprint in a water supply system, International Conference of Computational Methods in Sciences and Engineering ICCMSE 2020., 2021
- ,
The scale and organisation of ancient Maya water management ,WIREs Water , Vol. 1 (5),pp 449-467 , 2014, https://doi.org/https://doi.org/10.1002/wat2.1042 - ,
Estimating the Carbon Footprint of Microbial Electrolysis Cells in Wastewater Treatment Plants: Case Study ,Journal of Sustainable Development of Energy, Water and Environment Systems , Vol. 8 (3), 2020, https://doi.org/https://doi.org/10.13044/j.sdewes.d7.0296 - ,
Greenhouse Gas Emissions from Wastewater Treatment Plants ,General Assembly of the European-Geosciences-UnionEnergy Procedia , Vol. 97 ,pp 246-253 , 20162016, https://doi.org/https://doi.org/10.1016/j.egypro.2016.10.067 - ,
A plant-wide wastewater treatment plant model for carbon and energy footprint: Model application and scenario analysis ,Journal of Cleaner Production , Vol. 217 ,pp 244-256 , 2019, https://doi.org/https://doi.org/10.1016/j.jclepro.2019.01.255 - ,
Sewage sludge co-digestion with mango peel liquor: impact of hydraulic retention time on methane yield and bioenergy recovery ,Journal of Sustainable Development of Energy, Water and Environment Systems , Vol. 11 ,pp 1-14 , 2023, https://doi.org/https://doi.org/10.13044/j.sdewes.d11.0454 - ,
Modelling of Wastewater Heat Recovery Heat Pump Systems ,Journal of Sustainable Development of Energy, Water and Environment Systems , Vol. 9 (1), 2020, https://doi.org/https://doi.org/10.13044/j.sdewes.d8.0330 - ,
Prague Water Net Zero Strategy 2025: methodology and roadmap ,Water Supply ,pp ws2023098 , 2023, https://doi.org/https://doi.org/10.2166/ws.2023.098 - ,
Qualitative Research: Data Collection, Analysis, and Management ,The Canadian Journal of Hospital Pharmacy , Vol. 68 (3), 2015, https://doi.org/https://doi.org/10.4212/cjhp.v68i3.1456 - ,
Using GaBi 3 to perform life cycle assessment and life cycle engineering ,International Journal of Life Cycle Assessment , Vol. 6 (2),pp 81-84 , 2001, https://doi.org/https://doi.org/10.1007/BF02977842 - Míra inflace v České republice v roce 2022, 2023, https://www.czso.cz/csu/xp/mira-inflace-v-ceske-republice-v-roce-2022
- ,
Měření uhlíkové stopy v podmínkách SmVaK Ostrava a potenciál jejího snižování ,(In Czech, “Measuring the carbon footprint in the conditions of SmVaK Ostrava and the potential for its reduction”) SOVAK , Vol. 23 (23),pp 7–8 , 2023 - ,
Reduction of the return temperature in district heating systems with an ammonia-water absorption heat pump ,Case Studies in Thermal Engineering , Vol. 12 ,pp 817-822 , 2018, https://doi.org/https://doi.org/10.1016/j.csite.2018.10.010 - ,
Possibility of Heat Pump Use in Hot Water Supply Systems ,Journal of Sustainable Development of Energy, Water and Environment Systems , Vol. 4 ,pp 203-215 , 2016, https://doi.org/https://doi.org/10.13044/j.sdewes.2016.04.0017 - ,
Enhanced pollution removal with heat reclamation in a Hungarian small wastewater treatment plant ,Journal of Sustainable Development of Energy, Water and Environment Systems , Vol. 6 (3),pp 494–504 , , https://doi.org/https://doi.org/10.13044/j.sdewes.d6.0200 - Net zero emissions routemap, 2023, https://scottishwaternetzero.co.uk/operational-emissions
- ,
A Holistic ICT Solution to Improve Matching between Supply and Demand over the Water Supply Distribution Chain ,Journal of Sustainable Development of Energy, Water and Environment Systems , Vol. 2 (4), 2014, https://doi.org/https://doi.org/10.13044/j.sdewes.2014.02.0029