


Freshwater is a scarce resource that makes up only 2.5% of the water on earth, out of which only 1% is available for use from accessible natural water resources [1]. The global demand for freshwater resources continues to rise, driven by population growth, urbanisation, and industrial development [2]. The coincidence of freshwater scarcity with the increased demand for water has exacerbated the global water crisis.
According to United Nations (UN) predictions, water shortages will affect 14% of the world's population by 2025 [3]. Moreover, conventional freshwater resources, such as groundwater, lakes, and rivers, have become insufficient to cover the growing water demand [4]. Therefore, searching for new resources and techniques for producing freshwater became necessary to overcome the water scarcity challenges [5]. Desalination technology has emerged recently as a viable option for producing freshwater that minimises the gap between water supply and demand [6]. The Middle East and North African countries are rapidly shifting towards adopting desalination techniques to overcome the shortage of freshwater reservoirs [7]
Currently, 1% of the world's population regularly uses desalinated water [8]. The total number of desalination plants worldwide was more than 21,000 in 2022 [9], producing 110 million m3/day and providing water to about 300 million persons. The amount of water produced by these plants was 97 million cubic meters in 2017; this means that in 5 years, this amount increased by 13.4% [9].
Reverse osmosis (RO) is a technique that forces solvent molecules to flow from a more concentrated solution to a less concentrated solution via a semi-permeable membrane [10]. For this purpose, a pressure greater than the osmotic pressure is supplied to the more concentrated solution. For desalination purposes, the membrane allows the solute (brine) contained in the treated seawater or brackish water to be separated from the pure solvent, thus obtaining permeate water [10], [11]. In Palestine, reverse osmosis seawater desalination technology has been proposed as an appropriate solution to address the water scarcity problem [12], and the Palestinian Water Authority (PWA) recommended that RO desalination technology is the best reliable choice in the Gaza Strip [13], [14].
The availability of water and energy is essential for human being life; hence, they are crucial for the growth and development of human societies. Increased population rates, climate change, rising urban growth, and industrialisation have increased freshwater demand worldwide [15]. Water desalination technologies are being adopted at an increasing rate, raising several important sustainability issues at both the local and international levels. These concerns span a variety of topics, such as the depletion of natural resources, the environmental impact caused by the process, the energy consumption, the production of the materials required for its construction and operation, and economic effects. They also cover a wide range of societal effects, such as problems with the quality of desalinated water, health, employment, and general quality of life [16], [17]. Therefore, evaluating these effects on the long-term sustainability of the desalination process is crucial. It can be done by creating a framework for such an assessment [18], and creating composite indicators or metrics is most effective when we can establish a minimal set, preferably just one, that encompasses all the relevant metrics for assessing the various aspects of sustainability in the subject under analysis [19].
Water resources are a key component of sustainable development [20]. The essential idea of sustainability is protecting the economy and environment for future generations and preserving the capacity of natural systems to offer ecosystem services and natural resources. Sustainability as a concept can be defined as the continuation of water supply services over a long period of the initial investment or the ability of the water source to continuously yield adequate clean and safe water for the users at any particular time [21]. However, the simplest definition is the capacity to keep something going for a long time [18].
The paper introduces a novel sustainability assessment framework tailored to evaluate the sustainability of RO desalination plants in the unique context of the Gaza Strip, addressing critical water scarcity challenges in the region. The Multi Criteria Decision Analysis (MCDA) is a structured approach used to evaluate and compare multiple options or alternatives based on multiple criteria or decision factors [22]. By applying this framework to a practical case study, the research demonstrates its real-world applicability, offering valuable insights into the sustainability of existing RO desalination plants and providing guidance for stakeholders involved in water resource management. The study adopts an interdisciplinary approach by integrating expertise from various fields, such as environmental science, economics, and social impact assessment, to comprehensively address the complex sustainability issues associated with RO desalination.
Recognising the distinct challenges the Gaza Strip faces, including political instability, resource constraints, and demographic pressures [23], the framework considers these contextual factors, enhancing its relevance and effectiveness for decision-makers in the region. This research aligns with broader global goals of sustainable development by addressing critical water scarcity issues and contributing to efforts to ensure access to clean and sustainable water resources, particularly in regions grappling with water stress.
The approach to building the proposed sustainability evaluation framework was based on integrating the main pillars of sustainability (environmental, social, economic) with the technical and institutional setup pillars. The multi-criteria decision analysis (MCDA) techniques, the analytical hierarchy process, the swing method, and the weighted summation method were used to integrate the five pillars mentioned and produce the evaluation framework.
In building the framework, sustainability indicators were identified and attributed to each sustainability category. It is known that the measurement units of these indicators differ from each other as some are measured quantitatively and others qualitatively. So, it was necessary to standardise the measurement unit through the normalisation process. A group of local water and desalination experts participated in determining the relative importance of the main sustainability factors and their indicators by distributing a questionnaire.
The following steps summarise the methodology used in the development and validation of the proposed framework by its application on the South Gaza desalination plant as a case study:
Goal & Scope definition.
Selecting and assigning a group of related sustainability indicators to the five most important categories (technical, environmental, economic, social, or institutional).
Assessing all sustainability indicators based on literature data, local expert opinions and previous studies, and the authors' experience.
Normalising the values of the sustainability indicators.
Calculating the relative weights of the main sustainability categories and their indicators by surveying local water and desalination experts' opinions.
Integrating all normalised values of sustainability categories and indicators and the relative weights into a Global Sustainability Index (GSI) score.
The suggested approach starts with defining the desalination goal and scope to establish the system boundaries needed for the phases of the sustainability evaluation. The purpose of the desalination process may be established by determining the characteristics of the incoming seawater and the characteristics of the primary outcome, which is the desalinated water. As a result, these outputs will be valuable for determining whether a desalination plant satisfies the required characteristics.
The scope of desalination means identifying the local circumstances and components affecting the desalination plant that can be utilised to evaluate its sustainability. These conditions vary between environmental, technical, economic, social, and institutional setup aspects. Identifying project stakeholders is also crucial to the scope definition because they will be essential in assessing the sustainability indicators. The outputs from the scope definition will be primarily utilised to create a list of sustainability indicators with associated quantification units for use in the assessment process.
Identifying which indicators to involve under the proposed five sustainability categories primarily results from the opinions of local experts, in addition to the published literature. Several documents and studies on identifying and selecting indicators were reviewed for consideration. Some of these studies are the Water Research Foundation Report [24], the UNEP Handbook of Environmental Impact Assessment of desalination [25], the Desalination Journal paper on environmental and energy issues relevant to water desalination [26], and other sources. The sustainability indicators for evaluating desalination plants used in previous studies have been studied and identified to assess the performance of these plants and determine the various environmental, social, and economic impacts [27].
Table 1 shows the selected 27 sustainability indicators that have been carefully chosen to ensure a comprehensive framework for evaluating the desalination plants in the Gaza Strip.
Main sustainability categories and their relevant indicators
| Sustainability Category | Sustainability Indicator (SI) | Unit |
|---|---|---|
| Technical | Energy consumed | kW/produced m3 |
| Recovery rate | % | |
| Produced water quality | mg TDS/l | |
| Ratio of renewable energy used | % | |
| Environmental | ||
| Land used "the possibility of expansion" | Assessed qualitatively | |
| Groundwater effects (in the case of beach well intakes) | Assessed qualitatively | |
| Salinity increase | mg/l | |
| Temperature increase | 0C | |
| Effects on the marine environment (alga, topography, seawater quality, etc.) | Assessed qualitatively | |
| Carbon dioxide emission “CO2” | kg/m3 | |
| NOX& SOx emissions | g/m3 | |
| Level of noise | Assessed qualitatively | |
| Economic | Human recourses cost | USD/m3 |
| Fuel costs | USD/m3 | |
| Spare parts cost | USD/m3 | |
| Chemicals usage cost | USD/m3 | |
| A unit cost of desalinated water | USD/m3 | |
| Financial revenue rate | % | |
| Social | Water quality acceptability level | Assessed qualitatively |
| Community awareness level | Assessed qualitatively | |
| Providing job opportunities | Employees number | |
| User Ability to Pay “Affordability” | % | |
| Willingness to purchase | Assessed qualitatively | |
| Institutional Setup | The knowledge of the operation staff (Level of education) | Assessed qualitatively |
| Training and development of the staff | Assessed qualitatively | |
| The presence of government support | USD/m3 | |
| Institutional compatibility | Assessed qualitatively | |
The following points have been taken into consideration in the proposed framework when selecting sustainability indicators:
The importance of this indicator and its relationship with the desalination process,
Measurability,
Inclusiveness,
Availability of sufficient data for quantification purposes.
In summary, consideration of large numbers of sustainability indicators will complicate the proposed framework, as well as the reluctance of water and desalination experts involved in evaluating and giving the relative weights to these indicators, which will lead to a lower response rate and thus, the accuracy of the final results of the study. So, many of the less important indicators were excluded.
The values assigned to the sustainability indicators are collected through experts' interviews, field visits, visual inspections, and interviews with key operation and maintenance staff and the plants' operators. Therefore, the questionnaire was provided to 30 responders who represent desalination plant stakeholders, such as PWA, Coastal Municipalities Water Utility (CMWU), and Municipalities, in addition to local water desalination experts in the academic field.
Since the measurement units of these indicators differ, as shown in Table 1, the standardisation of their units was made through the normalisation process to facilitate the process of their integration. Table 1 presents a proposed list that can be utilised as a starting point in formulating the relevant SI, with the option of adding other indications that may arise during the selection process.
The relative relevance of the primary sustainability categories and their indicators is represented by their weights in the proposed framework. In general, the two following methods represent the most important methods used to determine the relative weights:
Considering that all sustainability categories and indicators have the same weights, this method has been criticised for disregarding the significance of one category or indicator compared to others.
Ranking the main sustainability categories and indicators by a relative importance order.
This study used this approach to achieve transparency, rationality, and validity in this framework. All relative weights of the key sustainability categories and indicators were identified through a survey in which questionnaires were distributed to local water and desalination experts. Local specialists have been selected to reflect local perceptions in deciding on the sustainability of the Gaza Strip's desalination plant. In this study, the relative weights of the various sustainability indicators were calculated using the swing method. In contrast, the relative weights of the major sustainability categories were determined and calculated using the hierarchical analysis technique.
Thirty experts were selected from governmental entities and academic fields, which included CMWU, PWA, EQA, and academics from local universities. These experts are highly experienced in strategic planning and the water desalination field. A field survey was conducted by distributing a questionnaire asking all experts to evaluate the importance of the main categories and their indicators.
From the above, the sustainability indicators are different from each other in terms of measurement units, as shown in Table 1, which makes it impossible to compare, collect, or directly integrate, making the need to standardise these different units by using a unified scale that eliminates these units, and therefore obtaining dimensionless indicator. A linear utility function with a domain from zero to one is the method adopted for this purpose and is applied to each indicator separately. A value of one represents the highest value of the indicator, while a value of zero represents the lowest value. As shown in eq. (1) the middle values will depend on the preferred order, while eq. (2) will determine the lowest values representing the desirable option [18].
(1)
(2)
The units utilised were classified into two types: quantitative and qualitative. Figures and values like volumes, rates, areas, concentrations and so on express quantitative units. However, because qualitative units describe uncountable elements, the units employed for this kind are the same as in a Likert-type scale, as shown in Table 2, to reflect the range of linear utility function.
Likert-type scale developed for linearly normalised qualitative indicators [28]
| Indicator rating | Normalised score |
|---|---|
| Very-High | 1.0 |
| High | 0.750 |
| Medium | 0.50 |
| Low | 0.250 |
| Very-Low | 0.0 |
Indicator weighing techniques can be broadly categorised into equal weighting, weighting based on statistics, and weighting based on public or expert opinion. Giving each indicator the same weight is called "equal weighting". In statistically based weighing, weights are calculated from the statistical characteristics of the data. As opposed to equal and statistic-based weighting, public/expert opinion-based weighing is based on feedback from the participating public or experts, whose opinions ultimately determine the weights assigned to individual indicators [29].
The weights of the primary categories and indicators were established after normalising all indicators. As mentioned, the analytical hierarchy approach will determine the sustainability category weights. In contrast, the weights of the indicators will be determined using the swing technique.
The AHP approach was applied to identify the best alternative based on a set of predetermined criteria [30]. This method is based on a pairwise comparison utilising a specific ratio scale with a range of 1 to 9 depending on the intensity of significance, as shown in Table 3. A decision matrix, eq. (3) represents the result of this comparison, where i and j represent the elements under comparison, and xji is equal to the reciprocal of xij. Therefore, the comparison required number equals n × (n - 1) / 2, where n is the total number of criteria to be evaluated.
(3)
Analytical hierarchy process significance intensity and score
| Score | Significance intensity |
|---|---|
| 1 | Indicators have similar significance |
| 3 | An indicator is a little more significant than another |
| 5 | An indicator is more significant than another |
| 7 | An indicator is strongly more significant than another |
| 9 | An indicator is extremely more significant than another |
The relative weights of the criteria were generated by normalising the decision matrix in the following three steps [18], [31]:
Each column j in the decision matrix was summed.
(4)
Each element in a column of the decision matrix was divided by its column sum.
(5)
The mean of each row i was calculated Zij, which represents the criterion weight.
(6)
Eq. (7) was used to calculate the consistency index, where λmax is the maximum eigenvalue and n is the decision matrix dimension.
(7)
Finally, the consistency ratio was calculated by eq. (8).
(8)
The random consistency index (RI) value, which calculates the mean consistency indices of specific numbers of random number pairwise comparison matrices, depends on the size of the matrix, as shown in Table 4. Finally, the consistency ratio (CR) value of 10% or less is considered acceptable [30].
Average random consistency RI [16]
| Size of matrix | 1.0 | 2.0 | 3.0 | 4.0 | 5.0 | 6.0 | 7.0 | 8.0 | 9.0 | 10.0 |
| Random consistency | 0 | 0 | 0.58 | 0.90 | 1.12 | 1.24 | 1.32 | 1.41 | 1.45 | 1.49 |
The swing method is the most likely technique used in the MCDA to determine the sustainability indicators' relative weights [32], [33]. The main reason for excluding the AHP method for weighting the sub-indicators is the difficulty of surveyed experts in dealing with many marital comparisons, which will increase the chance of error and decrease the response rate. On the other hand, the swing method makes the procedure easier and more accurate.
Experts are asked to evaluate the indicators and assign a value of 100 for the most important indicator among the indicators under comparison and then assign a value between 0 to 100 for other indicators, according to their assessment of this indicator compared to the most important indicator. Then, the geometric mean of each sustainability indicator is calculated for all the values given by all experts through eq. (9).
(9)
Where: n - the total of the experts' number, Qk - the indicator value assigned by each expert.
Ultimately, each set was normalised to determine the weight of each indicator by dividing each indication's geometric mean by the total of the geometric means of all the indicators in the same category. The sum of all indicators weights in a category must equal 1, eq. (10) [34], [35].
(10)
Where: wi - the indicator weight, b - the indicator number inside the same category.
Then, eq. (11) was used to calculate the indicator's standard deviation.
(11)
Where: wi - the indicator normalised weight value, - the average of each indicator's weights as determined by experts, N - the total number of surveyed experts.
Choosing the right weighting and aggregation techniques for a particular sustainability assessment project is important and tricky. The weighted summation approach is the most used aggregation technique for preference determination [36]. It is used in this research to combine the normalised indicators and their weights into a single score to calculate the desalination plant's global sustainability index (GSI).
Firstly, it was necessary to integrate the normalised indicators and the corresponding weights to obtain the sustainability index for the desalination plant. The next step was to combine them with the weights assigned to the major sustainability categories to determine the final score. The weighted summation method was used in this research to get the overall score as it is the most common MCDA aggregation technique, eq. (12).
(12)
Where: Sf - the overall score of each category, wi - the indicator's assigned weight, Is - the indicator normalised score.
The desalination plant's overall score GSI is derived by adding the weighted values of each primary category, eq. (13).
(13)
Where: GSI - the total score of the desalination plant under assessment, Wk - the weight assigned to each category, Sf - the category score.
This research was initiated to prepare a framework for assessing RO desalination plant sustainability in the Gaza Strip with a case study of the southern desalination plant. After doing the work, the following results have been found.
The weights suggested by respondents for each sustainability category are shown in Table 5. These weights were used to calculate the plant's sustainability index, and it was calculated for the Gaza southern desalination plant and cannot be used for other desalination plants.
Weights of sustainability categories
| No | Sustainability category | Weight of category |
|---|---|---|
| 1 | Technical | 0.277 |
| 2 | Environmental | 0.085 |
| 3 | Economic | 0.309 |
| 4 | Social | 0.093 |
| 5 | Institutional Setup | 0.236 |
| Total | 1.000 |
The Figures from 1 to 5 show the weights of each sustainability indicator in each sustainability category.
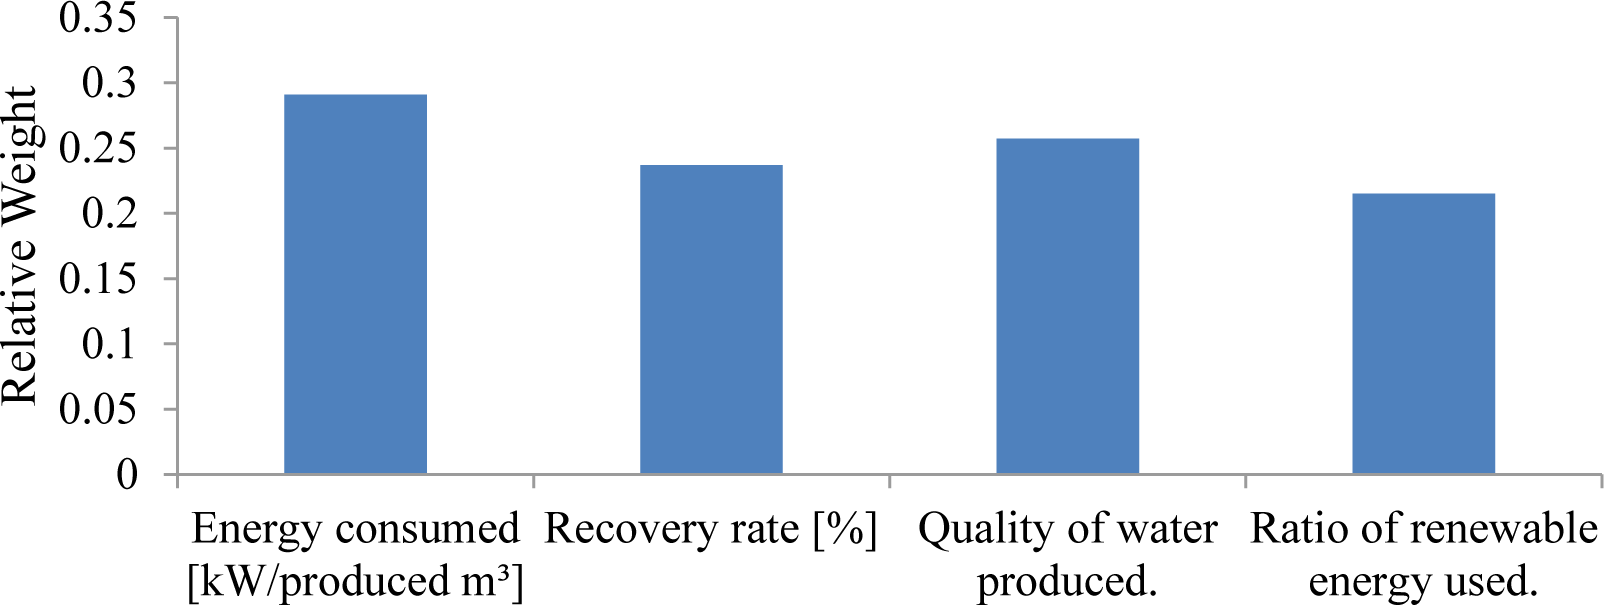
As illustrated in Figure 1, the highest indicator weight in this category is the amount of energy consumed per cubic meter; this indicator represents the energy required for plant operation and maintenance. The second-highest indicator is the quality of water produced, followed by the recovery rate indicator, and the lowest indicator weight in this category is the ratio of renewable energy used in the plant.
Technical indicators' relative weights
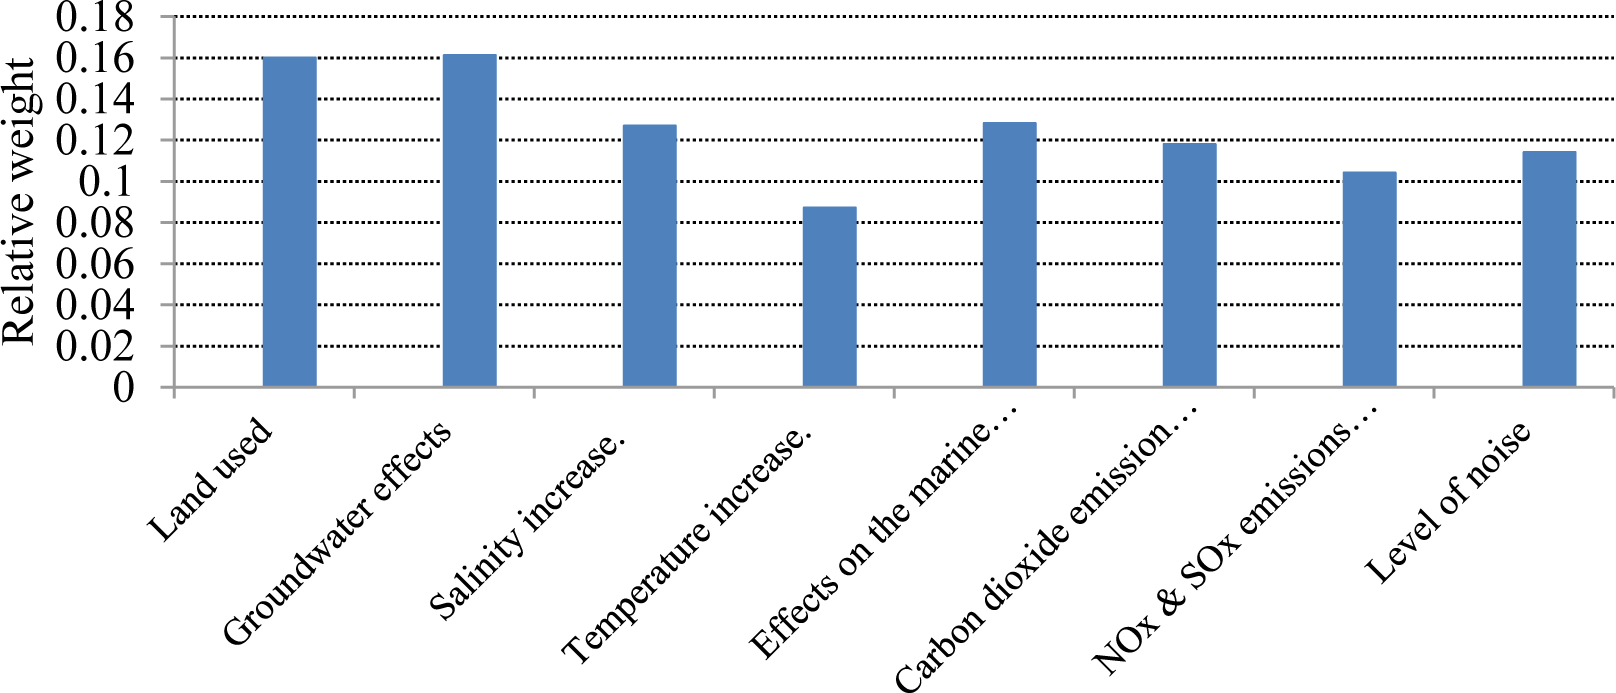
As illustrated in Figure 2, The highest indicator weight in the environmental category is the groundwater effects, followed by land used, effects on the marine environment, salinity increase, air emissions, and noise level. The lowest indicator weight in this category is temperature increase due to discharged brine.
Environmental indicators' relative weights
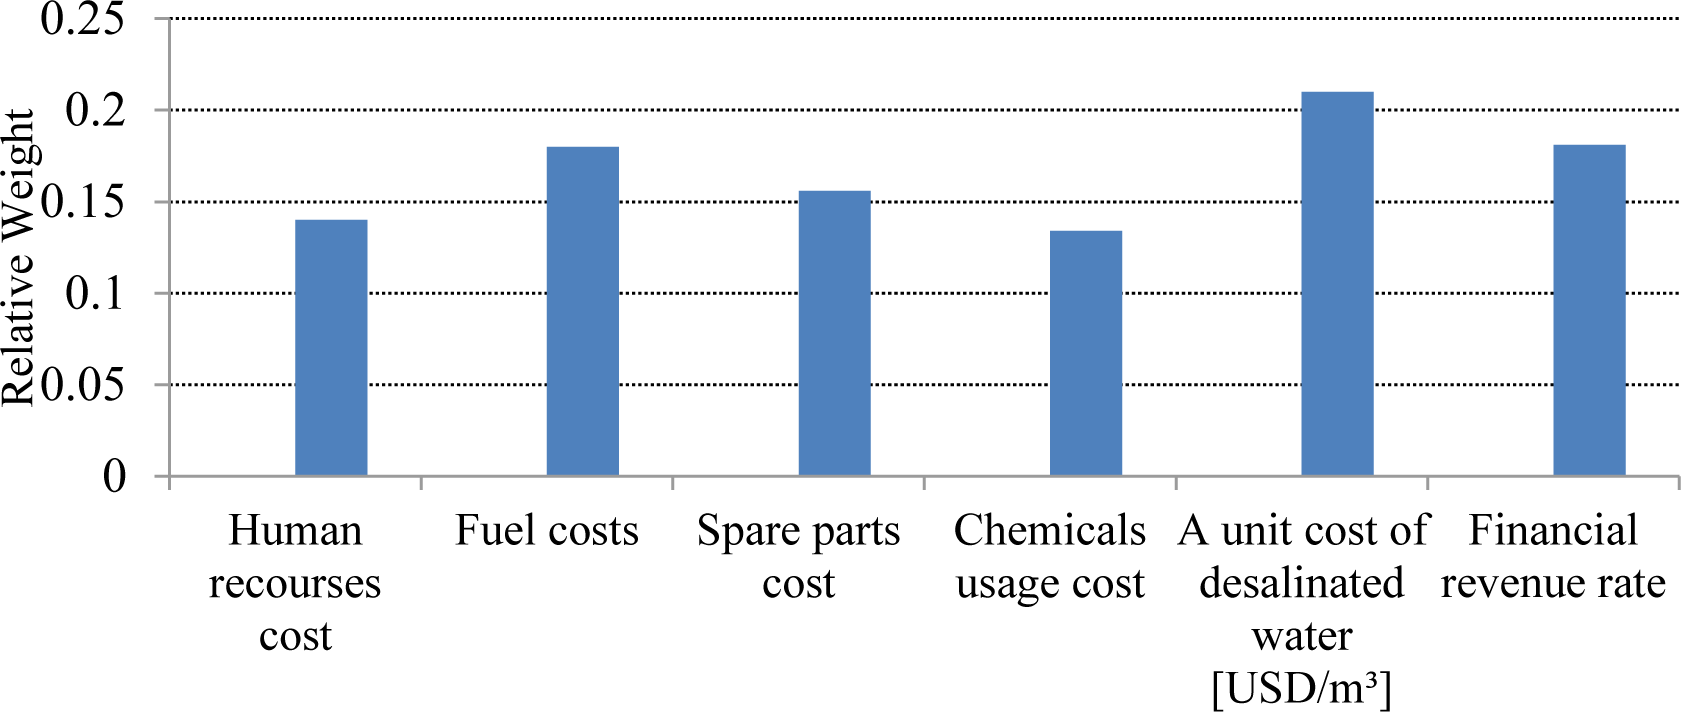
As illustrated in Figure 3, The highest indicator weight in the economic category is the unit cost of desalinated water measured as USD/m3, followed by the financial revenue rate indicator, fuel cost, spare parts cost, and human resources cost. The lowest indicator weight in this category is the chemicals' cost.
Economic indicators' relative weights
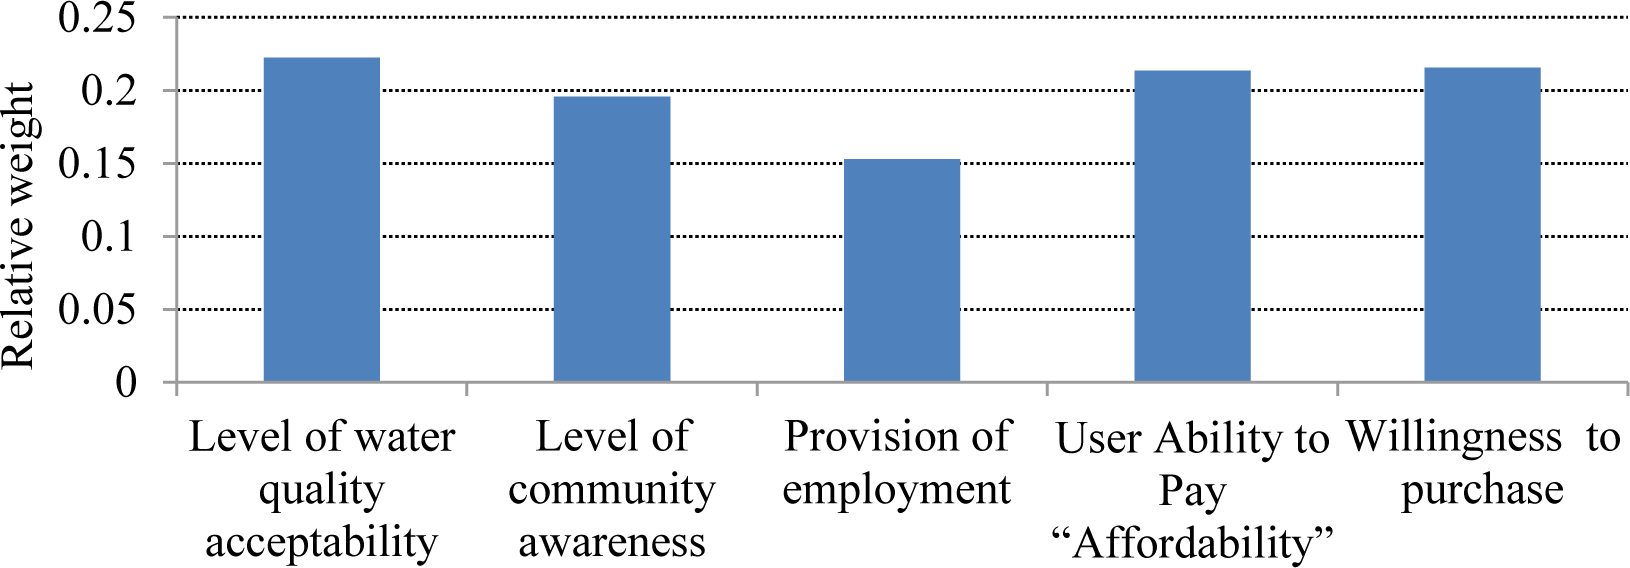
As illustrated in Figure 4, the level of water quality acceptability gets the highest weight under this category. It is followed by affordability, willingness to purchase, and level of community awareness, while the provision of employment gets the lowest weight under this category.
Social indicators' relative weights
As illustrated in Figure 5, the presence of government support gets the highest weight under this category. It is followed by knowledge of employment staff and institutional compatibility. The training and development of the staff gets the lowest weight under this category.
Institutional setup indicators’ relative weights
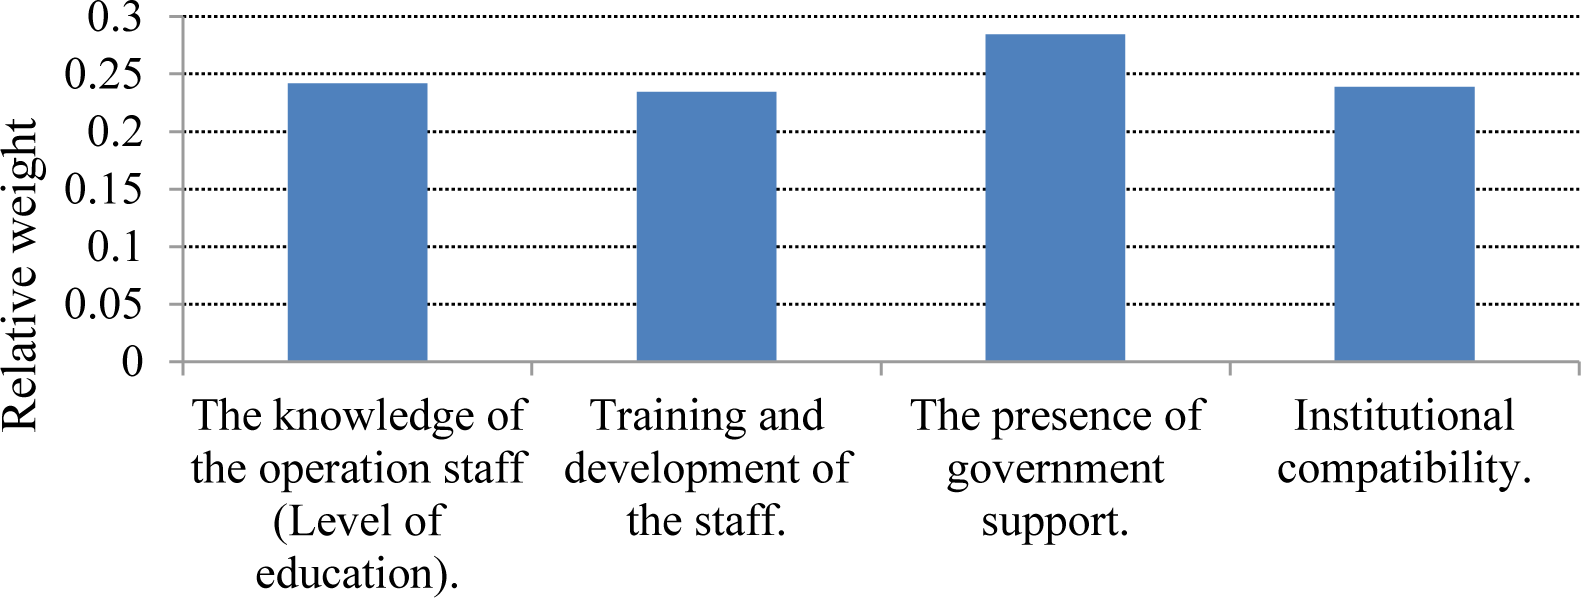
Table 6 shows all weights results of sustainability categories expressed by w1, the relative importance weight of the indicators under each category expressed by w2, and the final weight W of each indicator measured by w1×w2.
Summary of sustainability categories and indicators weighting
| Sustainability Categories | Category weight w1 | Indicator weight w2 | Final weight W=w1×w2 |
|---|---|---|---|
| 0.277 | |||
| Energy consumed [kW/produced m3] | 0.291 | 0.081 | |
| Recovery rate % | 0.237 | 0.066 | |
| Quality of water produced | 0.257 | 0.071 | |
| Ratio of renewable energy used | 0.215 | 0.060 | |
| 0.085 | |||
| Land used "the possibility of expansion" | 0.160 | 0.014 | |
| Groundwater effects (in case of beach well intakes) | 0.161 | 0.014 | |
| Salinity increase | 0.127 | 0.011 | |
| Temperature increase | 0.087 | 0.007 | |
| Effects on the marine environment (alga, topography, seawater quality, etc.) | 0.128 | 0.011 | |
| Carbon dioxide emission “CO2” [kg/m3] | 0.118 | 0.010 | |
| NOX& SOx emissions [g/m3] | 0.104 | 0.009 | |
| Level of noise | 0.114 | 0.010 | |
| 0.309 | |||
| Human resourses cost | 0.140 | 0.043 | |
| Fuel costs | 0.180 | 0.056 | |
| Spare parts cost | 0.156 | 0.048 | |
| Chemicals usage cost | 0.134 | 0.041 | |
| Unit cost of desalinated water [USD/m3] | 0.210 | 0.065 | |
| Financial revenue rate | 0.181 | 0.056 | |
| 0.093 | |||
| Level of water quality acceptability | 0.222 | 0.021 | |
| Level of community awareness | 0.196 | 0.018 | |
| Provision of employment | 0.153 | 0.014 | |
| User Ability to Pay “Affordability” | 0.213 | 0.020 | |
| Willingness to purchase | 0.216 | 0.020 | |
| 0.236 | |||
| The knowledge of the operation staff (Level of education) | 0.242 | 0.057 | |
| Training and development of the staff | 0.235 | 0.055 | |
| The presence of government support | 0.284 | 0.067 | |
| Institutional compatibility | 0.239 | 0.056 | |
| Sum | 1.000 | 1.000 |
The standardisation procedure is defined for each indicator once the indicators and their respective weights have been established to provide a standard measuring scale for all indicators with varying unit types to calculate the overall score. The measurement unit type and the indicator's nature are the key determinants of standardisation methodology.
All resulting criteria are quantified based on each indicator unit. The figures were driven from the data collected from the operation and maintenance staff of the southern short-term low-volume (STLV) desalination plant in addition to the design report and the EIA study conducted for the desalination plant.
By using eq. (1) and eq. (2) for the indicators that were measured quantitatively, and the Likert-type scale presented in Table 2 for the indicators measured qualitatively, Table 7 summarises the normalised scores for all selected indicators.
The summary of the normalised scores for all sustainability indicators
| Indicators | Unit | Value | Normalised score |
|---|---|---|---|
| Energy consumed | [kW/m3] | 4 | 0.95 |
| Recovery rate | [%] | 41.8 | 0.68 |
| Quality of water produced | [mg/l] | 290 | 0.85 |
| Ratio of renewable energy used | [%] | 27 | 0.27 |
| Land used "the possibility of expansion" | Qualitative | Medium | 0.5 |
| Groundwater effects (in the case of beach well intakes) | Qualitative | High | 0.75 |
| Salinity increase | [%] | 65 | 0.65 |
| Temperature increase | [0C] | 24 | 1 |
| Effects on the marine environment (alga, topography, seawater quality, etc.) | Qualitative | Low | 0.25 |
| Carbon dioxide emission “CO2” | [kg/m3] | 3.55 | 0.85 |
| NOx& SOx emissions | [g/m3] | NOx 3.17 |
0.85 |
| Level of noise | [dBA] | 110 | 0.68 |
| Human recourses cost | [USD/m3] | 0.108 | 0.70 |
| Fuel costs | [USD/m3] | 0.664 | 0.80 |
| Spare parts cost | [USD/m3] | 0.13 | 0.65 |
| Chemicals usage cost | [USD/m3] | 0.04 | 0.85 |
| Unit cost of desalinated water | [USD/m3] | 1 | 0.85 |
| Financial revenue rate | [%] | 35 | 0.35 |
| Level of water quality acceptability | Qualitative | Medium | 0. 5 |
| Level of community awareness | Qualitative | Medium | 0.5 |
| Provision of employment | No. | 8 | 0.65 |
| User Ability to Pay “Affordability” | [%] | 35 | 0.35 |
| Willingness to purchase | Qualitative | Medium | 0.5 |
| The knowledge of the operation staff (Level of education) | Qualitative | High | 0.75 |
| Training and development of the staff | Qualitative | Medium | 0.25 |
| The presence of government support | Qualitative | Medium | 0.5 |
| Institutional compatibility | Qualitative | High | 0.75 |
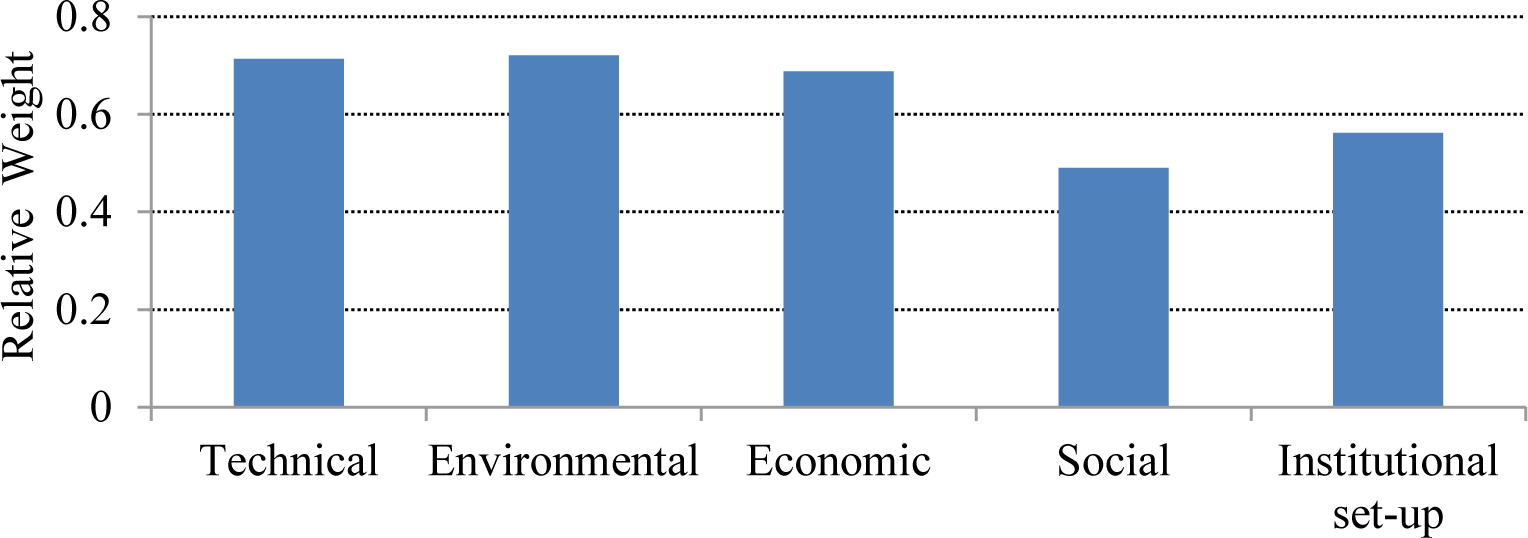
The total score of each category was measured by multiplying the weight assigned to each indicator under each category by the indicator normalised score, eq. (12). The results show that the technical category has a sustainability index of 71%, indicating that this plant's desalination process is going well because the water quality is within WHO guidelines. In addition, the average energy consumption per cubic meter and the recovery rate are within acceptable ranges. Regarding the environmental category, the results show that this category gets a sustainability index of 72% since the significant environmental risks are low from the desalination plant project.
Due to the resultant index of 68% in the economic area, the southern STLV desalination plant is regarded as only partially sustainable. The primary markers of this score are the high relative weight of the economic category and the lack of sustainable financial resources for the operation and management of desalination. The large decline in the revenue rate is another crucial metric that aids in the partial economic viability of a plant.
The results showed that the institutional category got a sustainability index of 56%. In comparison, the social category got the lowest sustainability index of 49%. Figure 6 shows the total score for the five sustainability categories. Each category defines the strength of choice according to sustainability ranking, as shown in Table 8.
Main sustainability categories' total scores
Sustainability indicators classification
| Classification of choice | Score range | Sustainability ranking |
|---|---|---|
| Excellent | > 80 | Sustainable |
| Very good | 70–80 | Sustainable |
| good | 60–70 | Partial Sustainable |
| Fair | 50–60 | Partial Sustainable |
| Poor | < 50 | Not Sustainable |
These classifications and degrees were proposed based on similar literature. These indexes were used by Salem [37] to evaluate the sustainability of the north Gaza wastewater treatment plant. Another similar classification was used by Balkema et al. [38] in proposing a general assessment methodology that builds on multi-objective optimisation and a complete set of sustainability indicators.
Finally, the southern Gaza desalination plant global sustainability index score (GSI) was obtained by applying the weighted summation method, eq. (13), which integrates the sustainability categories scores with the weight of each category, the result of the GSI of the desalination plant is 65%, and according to the framework and as indicated in Table 8, the plant is considered a partially sustainable plant in the ranking scale of sustainability.
Based on this research, it can be concluded that:
A framework to assess the sustainability of desalination plants has been prepared to evaluate desalination plants in the Gaza Strip, where the main categories and indicators were identified for evaluation.
Desalination plant owners and operators can use the proposed sustainability assessment framework to assess RO desalination plants' sustainability level.
The suggested framework quantified sustainability's meaning and created significant indexes that will be used to support any decisions made in the future regarding improving saltwater desalination plant design and operation.
Asking desalination plant designers to use sustainable design frameworks and working to develop sustainable desalination processes are advised for utilities and agencies that control and govern the water sector.
It is suggested that operators of desalination plants use the proposed assessment framework as a tool for sustainability evaluation and develop it by tying the outputs to action plans for boosting the weak indicators in sustainability categories.
It is advised that operators of desalination plants analyse the sustainability of their facilities frequently each year to maintain the sustainability level and keep improving and developing measures,
It is advised to create water legislation provisions that emphasise the need for all water sector utilities and infrastructure to be built, operated, and maintained using sustainability principles.
This research contributes to the ongoing dialogue on water resource management in the Gaza Strip and similar regions facing water scarcity challenges. A systematic approach to sustainability assessment empowers stakeholders to make more informed decisions about the operation and development of RO desalination plants. Furthermore, it emphasises the importance of continued efforts to enhance the sustainability of these vital facilities, ensuring a more secure and resilient water supply for the future.
| CR | Consistency Ratio |
| GSI | Global Sustainability Index |
| RI | Random Consistency Index |
| AHP | Analytic Hierarchy Process |
| CMWU | Coastal Municipalities Water Utility |
| EIA | Environmental Impact Assessment |
| EQA | Environment Quality Authority |
| MCDA | Multi-Criteria Decision Analysis |
| PWA | Palestinian Water Authority |
| RO | Reverse Osmosis |
| STLV | Short-Term Low-Volume |
| TDS | Total Dissolved Solids |
| UN | United Nations |
| UNEP | United Nations Environment Programme |
- , https://public.wmo.int/en/our-mandate/water/hydrology
- ,
"Nature-Based Solutions" and Global Water Shortages: A Political Ecology of The United Nation's World Water Development Report 2020. , - ,
Gaza in 2020: A Livable Place? United Nations Country Team in the occupied Palestinian territory ,Technical report , 2012 - ,
Optimal management of brine from seawater desalination plants in Gaza Strip: Deir AL Balah STLV plant as case study. , Vol. 6 (06),pp 599 , , https://doi.org/https://doi.org/10.4236/jep.2015.66054 - , Desalination and the environment: options and considerations for brine disposal in inland and coastal locations., 2005
- ,
Prospects of water desalination in the Gaza strip ,pp 1-98 , 2003 - ,
Solar desalination: Current applications and future potential in MENA region-A case study , Vol. 11 (2),pp 1-26 , , https://doi.org/https://doi.org/10.13044/j.sdewes.d10.0437 - ,
Sustainable seawater desalination: Current status, environmental implications and future expectations , Vol. 540 ,pp 116022 , , https://doi.org/https://doi.org/10.1016/j.desal.2022.116022 - , The Geopolitics of Seawater Desalination, 2022
- ,
Reverse osmosis desalination: water sources, technology, and today's challenges , Vol. 43 (9),pp 2317-2348 , , https://doi.org/https://doi.org/10.1016/j.watres.2009.03.010 - ,
3E assessment of a solar-driven reverse osmosis plant for seawater desalination in a small island of the Mediterranean Sea , Vol. 10 ,pp 2260-2276 , , https://doi.org/https://doi.org/10.1016/j.egyr.2023.09.053 - ,
Is desalination a solution to freshwater scarcity in developing countries? ,Membranes , Vol. 12 (4),pp 381 , , https://doi.org/https://doi.org/10.3390/membranes12040381 - ,
Desalination status in the Gaza Strip and its environmental impact ,Desalination , Vol. 196 (1-3),pp 1-12 , , https://doi.org/https://doi.org/10.1016/j.desal.2005.12.009 - ,
Strategy of water desalination in the Gaza Strip , Vol. 156 (1-3),pp 39-42 , , https://doi.org/https://doi.org/10.1016/S0011-9164(03)00322-9 - ,
Technical and economic comparison between solar and wind energy supplying desalination system ,J. Sustain. Dev. Energy Water Environ. Syst. , Vol. 10 (2),pp 1-24 , , https://doi.org/https://doi.org/10.13044/j.sdewes.d8.0382 - ,
Sustainability as the quantitative norm for water desalination impacts ,Desalination , Vol. 401 ,pp 99-111 , , https://doi.org/https://doi.org/10.1016/j.desal.2016.08.008 - , Quantifying sustainability for energy development, Energy bulletin, 2015
- ,
An integrated framework for sustainability assessment of seawater desalination ,Desalination , Vol. 447 ,pp 1-17 , , https://doi.org/https://doi.org/10.1016/j.desal.2018.08.019 - ,
Quantifying sustainability for energy development ,Energy Bulletin , Vol. 19 (8), - , Water for life: making it happen, 2005
- ,
Sustainability assessment and identification of determinants in community-based water supply projects using partial least squares path model , Vol. 5 (3),pp 345-358 , , https://doi.org/https://doi.org/10.13044/j.sdewes.d5.0153 - ,
Renewable energy scenarios for water desalination and conveyance: Case of red sea-dead sea project , Vol. 46 ,pp 281-302 , , https://doi.org/https://doi.org/10.1016/j.ref.2023.07.002 - , Gaza Rapid Damage and Needs Assessment, 2021
- , Critical Assessment of Implementing Desalination Technologies, 2009
- , Desalination resource and guidance manual for environmental impact assessments, United Nations Environment Programme, 2008
- ,
Energy and environmental issues in desalination , Vol. 366 ,pp 2-8 , , https://doi.org/https://doi.org/10.1016/j.desal.2014.11.034 - ,
Techno-economic assessment and environmental impacts of desalination technologies ,Desalination , Vol. 266 (1-3),pp 263-273 , , https://doi.org/https://doi.org/10.1016/j.desal.2010.08.035 - ,
Normalisation affects the results of MADM methods ,Yugoslav Journal of Operations Research , Vol. 11 (2),pp 251-265 , - , Handbook on constructing composite indicators: methodology and user guide, 2008
- , The analytic hierarchy process: planning, priority setting, resource allocation., 1980
- ,
Review of the main developments in the analytic hierarchy process ,Expert Syst. Appl. , Vol. 38 (11),pp 14336-14345 , , https://doi.org/https://doi.org/10.1016/j.eswa.2011.04.143 - ,
Decision support by interval SMART/SWING-incorporating imprecision in the SMART and SWING methods ,Decis. Sci. , Vol. 36 (2),pp 317-339 , , https://doi.org/https://doi.org/10.1111/j.1540-5414.2005.00075.x - , Multiple criteria decision analysis: an integrated approach, 2002
- , Decisions with multiple objectives: preferences and value trade-offs, 1993
- , Decision analysis and behavioral research
- ,
An integrated sustainability decision-support framework Part II: Problem analysis ,Int. J. Sustain. Dev. World Ecol. , Vol. 12 (2),pp 112-131 , , https://doi.org/https://doi.org/10.1080/13504500509469623 - , Guidelines for Designing Sustainable Wastewater Treatment Plants (North Gaza WWTP as Case Study), M.Sc. Thesis, Dept. of Civil Engineering, 2014
- ,
Indicators for the sustainability assessment of wastewater treatment systems ,Urban Water , Vol. 4 (2),pp 153-161 , , https://doi.org/https://doi.org/10.1016/S1462-0758(02)00014-6