The development of sustainable energy technologies must be a priority in a world where global energy consumption keeps increasing steadily as well as the global population and comfort standards. The refrigeration sector, which contributes significantly to the global energy demand, consumes around 20% of the electrical energy used globally and generates around 7.8% of the total global warming gases [1]. Moreover, global warming emissions produced by the refrigeration sector are related to energy consumption and refrigerant gas leaks. While the direct global warming emissions due to gas leaks account for 37% of the total global warming gases from refrigeration systems, the indirect global warming emissions due to the electrical energy consumption of the refrigeration units are around 63% [1]. Therefore, it is important to look for refrigeration solutions that use eco-friendly refrigerants and can be driven by renewable energies. This appears as a great opportunity for the development of sustainable and environmentally friendly energy technologies.
Commercial refrigeration systems provide adequate temperatures for the conservation of different edible products. It includes the freezing and preservation of food in retail stores and supermarkets, where around half of the energy consumed is related to refrigeration units [2]. Moreover, the characteristics of the refrigerant used in refrigeration systems are key to their performance. Studies available dealing with the evaluation of natural or low global warming potential (GWP) refrigerants follow a rising trend in the open literature given the environmental challenges that humanity faces [3]. Studies related to the use of low GWP refrigerants are mainly focused on commercial refrigeration. According to the results in the literature, a refrigeration system using R430A provided a COP about 2.6-7.5% higher than that with R134a at evaporation temperatures between 0 °C and -30 °C [4]. Also, a refrigeration system using R513A was found to provide higher cooling capacity and require lower power consumption than that of the R134a [5], [6], whereas R1234ze(E) [7], [8], and R450A [8], [9] overcame the performance of the R134a just after using an internal heat exchanger (IHX). Moreover, refrigeration systems using R448A [10], R454C [11], and R455A [11] were found to provide slightly higher COP than that of R404C but with a significantly lower GWP. Additionally, studies have also demonstrated the effectiveness of using an IHX to improve the refrigeration system performance using the mentioned refrigerants, even though the discharge temperature can get close to or surpass the operation limits [8]. The effect of the IHX can be beneficial or detrimental depending on the thermodynamic properties of the fluid used, mainly the vapour heat capacity, and the operating conditions of the system [12], [13]. Therefore, its benefit must be quantified for each refrigerant at the required operating conditions.
Despite the increasing research on low GWP, it is highlighted that ecological or natural refrigerants are called to be the final solution to replace traditionally used refrigerants [14]-[16]. Studies using natural refrigerants in refrigeration systems are on a rise given an increasing preference for them. Kabul et al. [17] presented the effect of evaporation (0 °C to -15 °C) and condensation temperature (30 °C to 60 °C) on the performance of an R600a refrigeration system. In this case, the COP, exergetic efficiency, and total irreversibilities were used as performance indicators while the compressor efficiency was set constant. The main conclusions were related to the rise in the system efficiency by reducing the temperature of condensation and increasing the temperature of evaporation.
Bayrakci and Ozgur [18] provided an exergetic analysis of a refrigeration unit using R290, R600a, R600, and R1270. The authors reported the effect of the condensation temperature (30 °C to 50 °C) and evaporation temperature (-5 °C to -25 °C) on the system performance and recommended the use of R1270 or R600 instead of the conventional refrigerants. De Paula [3], [19] reported the energy and exergy analysis of a basic vapour compression refrigerator using R290, R1234yf, R744, and R600a, to produce chilled water. In this study, the temperature of evaporation was varied from -5 °C to -3 °C whereas the temperature of condensation was varied from 45 °C to 50 °C. Results indicated that R290 outperformed the other studied refrigerants in terms of energy and exergy efficiency at a temperature of evaporation of -3 °C and a temperature of condensation of 45 °C. Also, R600 and a blend of R290/R600a have been recommended for ejector refrigeration systems in comparison to traditionally used refrigerants [20], [21]. However, pure refrigerants are preferred to refrigerant blends due to the concentration changes occurring after leaks.
Ghanbarpour [22] presented the performance of various AC vapour refrigeration system configurations, including an IHX and vapour injection, using R290, R600a, and R1290. In this study, the temperature of evaporation was set to -5 °C and the temperature of condensation was set to 35 °C, while the isentropic efficiency of the compressor was kept constant at 70 %. The results showed that the R600a system offers a higher COP than that of R134a. However, the heating capacity was lower than that with R134a.
Antunes and Bandarra [23] provided an experimental evaluation of the performance of a refrigeration unit using R404A, R438A, R410A, R290, R32, and R1270. The evaporation temperature was varied from -15°C to -5°C while the temperature of condensation ranged between 31 °C and 44 °C. According to the results, the R1270 and R290 showed the largest COP values under the studied conditions. Baakeem et al. [24] highlighted the R717 as the best option among the studied refrigerants for multi-stage refrigeration applications. Ammonia is an excellent refrigerant that can outperform HFCs. Also, technological developments have opened up opportunities for ammonia beyond its traditional market, especially for low-charge equipment, where it was not possible to use ammonia before [25].
Cabello et al. [26] experimentally evaluated the performance indicators of a freezer and the effect of using an IHX, with R454C, R455A, R468A, R290 and R1270. In this study, the heat rejection temperatures of 40 °C, 30 °C, and 20 °C were considered while keeping an internal air temperature of -20 °C. The main conclusions of the study highlighted the benefits of using the IHX for all the refrigerants studied. Results showed that the IHX reduces the compressor work and that its effect is more pronounced at high sink temperatures.
Given the high electrical energy requirements in refrigeration systems, alternative energy sources have been evaluated to power refrigeration systems to help the decarbonization of this sector. The use of solar energy to power small-capacity refrigeration systems requires the development and characterization of DC compressors. If the use of solar energy is combined with the use of natural refrigerants, it appears as a great opportunity to meet sustainable and environmentally friendly energy technologies goals.
Studies available in the literature dealing with solar refrigeration involve the use of traditional refrigerants such as R134a, while few studies include ecological refrigerants. Modi et al. [27] reported a COP up to 2 for an R134a domestic refrigerator powered by solar energy and operating at an evaporation temperature of -4 °C. Bilgili [28] modelled a solar vapour compression refrigeration system using R134a for air-conditioning purposes in an office building. In this study, the authors highlighted that the system performance drops with increasing external temperature and cooling load capacity. Meanwhile, Opoku et al. [29] demonstrated that for solar refrigeration applications, it is more convenient, in terms of costs and performance, to run a DC refrigerator in comparison to AC refrigerators. Ouali et al. [30] highlighted the economic benefits of using solar-powered domestic refrigerators. Daffallah et al. [31], [32] tested a solar-powered DC refrigerator using 134a under different load conditions and thermostat settings. It was found that the refrigerator performance varies based on the loadings level and thermostat position.
Torres-Toledo et al. [33] presented the operation of a small-scale DC freezer using R134a for ice production and reported an autonomy of 5 days. Salilih et al. [34], [35] characterized a solar refrigerator using R134a and showed the sensitivity of the system performance at different temperatures of condensation and evaporation. Su et al. (2020) reported on the dynamic operation of a variable-speed photovoltaic DC refrigerator using R134a as the refrigerant and without using batteries and an inverter. Results indicated the effect of ambient temperature and solar radiation intensity on the refrigerator and showed that the higher the solar intensity is, the higher the cooling capacity while lower ambient temperature benefits the cooling capacity. Hu et al. [37] tested an AC refrigeration system with cold storage powered by PV solar energy and used R22 as the refrigerant. In this study, the storage space was maintained between 0°C and 5°C. The authors reported a daily average refrigeration system COP between 2.75 and 3.02. Also, Ikram et al. [38] modelled the performance of a hybrid solar PV-driven AC refrigeration unit using R717 for air-conditioning of a storage room at 15°C. The solar fraction reported was up to 59.2% whereas the economic study showed payback periods of up to 5.2 years. Finally, Kasera et al. [39] presented the experimental performance of a solar-powered milk refrigerator using R290. The cooled air was kept at 4°C while the ambient air temperature ranged between 25 and 40 °C. Results mainly showed that the COP and solar COP dropped as the ambient temperature increased.
According to the literature, there is a lack of detailed studies dealing with the integration of DC refrigeration systems, the use of natural refrigerants, and solar systems for solar refrigeration applications. Therefore, this study aims to analyse the energy and exergy performance of a small-capacity solar refrigerator using ecological refrigerants such as R600a, R290, and R717 for solar refrigeration applications. It involves a detailed characterization of the DC refrigerator using an IHX with different effectiveness, at evaporation temperatures of -10 °C and -32 °C to cover different product temperatures. Also, the temperature of condensation is established to 35 °C and 46 °C considering a 12°C temperature difference concerning the minimum and maximum environmental temperature recorded in the city of Barranquilla, Caribbean coast of Colombia. The simulation model validation is also presented considering the performance data of actual DC compressors. This investigation aims to contribute to the development of sustainable and environmentally friendly energy technologies. Besides, this could be beneficial, especially for zones where access to electrical energy is not well established.
The present study deals with the performance comparison of a small-capacity horizontal refrigerator cabinet with different natural refrigerants driven by photovoltaic (PV) solar panels. Initially, the validation of the DC compressor performance for the selected refrigerants is presented. Then, energy and exergy balances are conducted on the refrigeration system to provide a detailed characterization of its performance using different refrigerants, at different evaporation temperatures, condensation temperatures, and IHX effectiveness. Finally, the integration of the DC refrigeration system, using natural refrigerants, with the PV solar system and their performance is assessed.
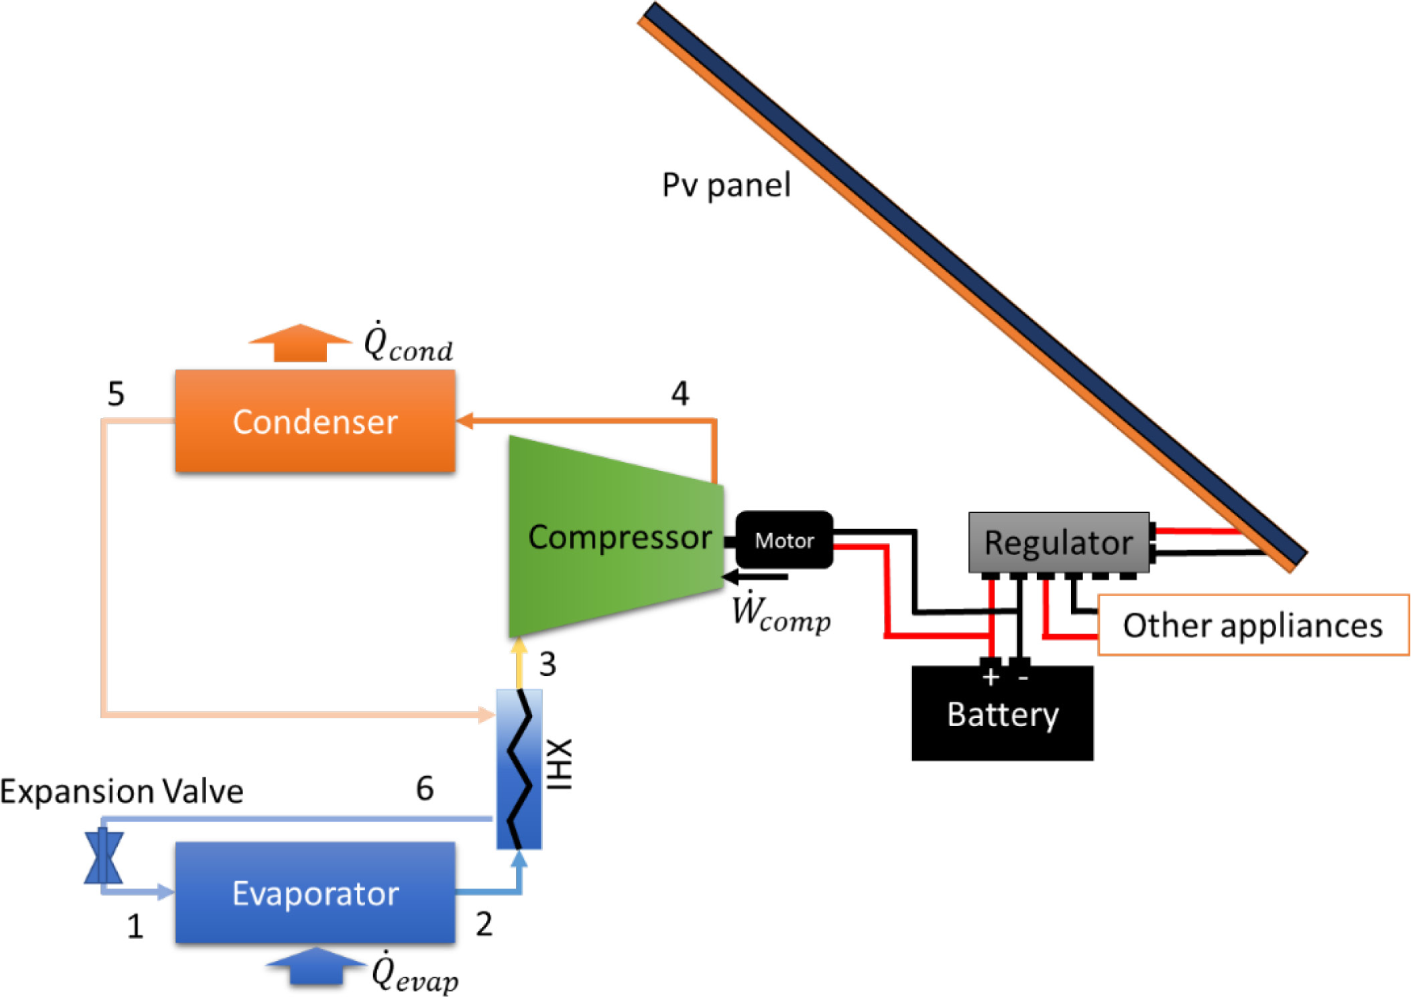
A basic schematic diagram of the autonomous solar mechanical vapour compression refrigerator under study is illustrated in Figure 1. It consists mainly of a PV solar panel, a battery, a current regulator, an evaporator, a direct current (DC), a condenser, a compressor, an expansion valve, and an internal heat exchanger (IHX). The main energy input to the refrigeration unit is obtained through the PV solar collectors while the battery is used to store the energy needed to drive the DC compressor and some appliances when solar energy is not available. The present configuration was selected given the characteristics of the simplicity of small-capacity horizontal refrigerators and the system potential for solar refrigeration in rural areas or non-interconnected zones. Moreover, the IHX was added to improve the performance of the basic configuration.
The refrigeration effect is produced in the evaporator, where the heat absorbed from frozen products is transferred to a refrigerant liquid-vapour mixture to reach a vapour state. The vapour is then sent to the DC compressor, passing first through an internal heat exchanger where it is superheated thanks to the higher temperature refrigerant flowing on the other side of the IHX. In the compressor, the superheated vapour is conditioned to high pressure and temperature to reach the required state and facilitate its condensation in the condenser. Next, the condensed flow is sent to the IHX where it is subcooled thanks to the heat exchange with the low-temperature vapour coming from the evaporator and flowing through the other side of the IHX. The subcooled liquid is then sent through the expansion valve where its pressure and temperature drop drastically, and the refrigerant becomes a liquid-vapour mixture that is ready to start the cycle again in the evaporator.
Scheme of the horizontal solar vapour compression refrigerator with internal heat exchanger
This section provides the details of the procedure followed for the present research. It includes relevant information about the refrigerants selected, the energy and mass balances applied for the refrigeration system model development, the main parameters involved in the solar system evaluation, and the environmental characteristics of the city selected for the study.
In this study, four refrigerants are used to conduct a performance comparison at various operating conditions of interest for autonomous solar refrigeration. In this case, R134a is used as a base case given its extended use in refrigeration horizontal cabinets. Additionally, the natural refrigerants R600a, R290a, and R717 are also used in this study. Table 1 presents some relevant data on the selected refrigerants.
Refrigerant details and safety classification [40].
| Refrigerants | Molecular mass (g/mol) | NBP (°C) | Tc (°C) | pc (MPa) | Latent heat at Tb (kJ/kg) | ASHRAE classification | ODP | GWP |
|---|---|---|---|---|---|---|---|---|
| R134a | 102.0 | -26.08 | 101.06 | 4.06 | 217 | A1 | 0 | 1430 |
| R600a | 58.12 | -11.76 | 134.7 | 3.63 | 365.11 | A3 | 0 | 3 |
| R290 | 44.1 | -42.12 | 96.70 | 4.25 | 425.6 | A3 | 0 | 3 |
| R717 | 17.03 | -33.4 | 132.35 | 11.3 | 1367.9 | B2L | 0 | 0 |
Table 1 shows that R717 has the lowest molecular mass and the highest latent heat of vaporization among the selected refrigerants. At atmospheric pressure, the boiling temperature of R717 and R290 is low enough that air infiltration is not an issue at the required evaporation temperatures for the application established in this study. In the case of R600a, it operates below the atmospheric pressure at evaporation temperatures below -11 °C so an appropriate system sealing is required considering its high flammability. R290 and R600a are highly flammable refrigerants with air (classification A3 according to ASHRAE [40]) whereas R717 is highly toxic at values below 400 ppm by volume. However, these refrigerants are appropriate for low-charge and small-capacity equipment because of their high latent heat. Among the refrigerant selected, the lowest required charge could be achieved by R717 which is beneficial to reduce the impact of its toxicity and extend its application. However, its applicability needs to be verified.
The simulation model developed for the evaluation of the refrigerator is based on energy and mass transfer balances in each of the components. The next assumptions were considered for the evaluation of the refrigerator with the different refrigerants selected:
Steady-state system operation.
Negligible potential and kinetic energies.
Negligible pressure drops.
Connecting pipes considered adiabatic.
Isenthalpic process in the expansion device.
Saturated vapour at the inlet of the IHX.
Cooling load set to 200 W.
The simulation of the system under study was carried out using the Engineering Equation Solver (EES software). The thermophysical properties of the selected refrigerants were obtained from the mentioned software. The energy balances and the main assessment parameters considered in each component of the refrigerator were established as follows:
(1)
(2)
(3)
(4)
(5)
(6)
(7)
(8)
(9)
ṁ is the mass flow rate and h refers to the enthalpy. is the refrigerator cooling load, is the condenser heat flow, is the isentropic energy flow provided by the compressor, refers to the power energy consumption, while ηglobal is the global efficiency of the compressor. The global efficiency was correlated considering the pressure ratio as shown in Table 3. The fluid temperature at the compression unit outlet was estimated considering a polytropic process. εIHX in Eq. 8 is the internal heat exchanger effectiveness and COP is the coefficient of performance of the system. In each component, the mass flow rate is constant, therefore, ṁin = ṁout.
Validation of the refrigerator simulation model was conducted by developing global efficiency correlations considering the cooling capacity, power energy consumption, and COP reported for various commercial DC compressors [41]. The selected compressors can provide cooling capacities ranging from 0.025 kW to 0.208 kW for temperatures of evaporation ranging between -40 °C and -5 °C. In the case of R717, it was not possible to find the technical data sheet of the low cooling capacities compressors available commercially. Then, the R717 global efficiency was approached by using the correlation reported by Stoecker (1998). Even though this correlation was not obtained for a DC small-capacity compressor, it was used to approach the R717 compressor given the reasonable values obtained and a performance trend similar to those with the other selected refrigerants. The main details of the compressors are presented in Table 2.
DC Compressors details [41]
| Manufacturer | Model | Refrigerant | Vcil (cm3) | rpm |
|---|---|---|---|---|
| Danfoss | BD250 | R134a | 2.5 | 3800 |
| Danfoss | BD35K | R600a | 3.0 | 3500 |
| Danfoss | BD80CN | R290 | 2.0 | 3500 |
The exergy destruction analysis was also conducted to estimate the irreversibility in each component of the refrigerator and identify improvement potentials considering the selected refrigerants. The exergy destruction and second law efficiency were estimated as follows:
(10)
(11)
(12)
(13)
(14)
(15)
(16)
Where Xcomp, Xevap, XIHX, Xcond, Xexpd refer to the exergy destruction in the compressor, evaporator, internal heat exchanger, condenser, and expansion valve, respectively. The sum of exergy destruction values in each component is given in Xtotal. Finally, ηII refers to the second law efficiency.
The DC power generated by the photovoltaic solar system was estimated considering the efficiency of the solar panel and the solar energy input (eq. (17)), where was estimated as in eq. (18), and ηPV was assumed according to Kim and Ferreira (2008). In eq. (18), APV refers to the required area for the solar energy collection and Is the global solar irradiation. To estimate the area of the solar panels, the daily energy consumption of the DC refrigerator and the average daily total solar irradiation were considered [28].
(17)
(18)
(19)
In this study, the temperature of condensation was set considering the minimum and maximum environmental temperature reported in Barranquilla, one of the main cities on the Caribbean coast of Colombia, with a significant potential for solar energy to drive thermal systems [44]-[46]. Figure 2 presents the hourly values of average solar irradiation and environmental temperature for Barranquilla. This figure shows that March presents the highest solar irradiation while November presents the lowest irradiation. The mean solar irradiation per day is 6698.2 W/m2 in March while it is around 5274.4 W/m2 and 5095.20 W/m2 in October and November, respectively. The mean solar irradiation per day is the sum of the hourly values of average solar irradiation in a day. Regarding the environmental temperature, July appears to be the warmest month with an average temperature of 27.8 °C while January is the coolest month of the year with an average temperature of 26 °C. According to the records, the 1st of July is the warmest day of the year [45].
Hourly mean data of solar irradiation and ambient temperature for Barranquilla [45]

To conduct the energy and exergy performance comparison of the refrigerator using R134a, R600a, R290, and R717, a series of operating conditions were established. As mentioned in subsection 3.5, the temperature of condensation was set to 35 °C and 46 °C considering a 12°C temperature difference with respect to the minimum and maximum environmental temperature reported in Barranquilla. The temperature of evaporation was established at -10 °C and -32 °C, considering a maximum of 8 °C concerning the temperature of frozen products, representing adequate conservation temperatures ranging between -2 °C and -24 °C. In the case of the IHX effectiveness, it was varied from 0.0 to a maximum of 0.60 to assess its effect on the refrigerator performance parameters including COP, Ẇ, ṁ, T4, ηII, and X. The maximum effectiveness value of 0.6 was set considering that the refrigerant temperature expected at the outlet of the compressor may have surpassed the recommended operation limits [8].
Validation of the refrigerator simulation model for each refrigerant was conducted by developing global efficiency correlations as shown in Table 3. These correlations are based on technical data available for various commercial DC compressors with their corresponding refrigerants [41]. The refrigeration system used for the model validation is the base one without IHX. These correlations were developed by estimating the compressor global efficiency (eq. (3)) from the relation between the compressor ideal power and the actual power consumption reported in the technical data available [41] at the given operating conditions. Then, the estimated global efficiencies for each case were correlated as a function of the pressure ratio which is the ratio of the compressor discharge and suction pressures (PR). The discharge and suction pressures depend on the condensation and evaporation temperatures. Therefore, once the efficiency correlation for each compressor and its corresponding refrigerant is obtained and implemented in the model, the inputs required to run the simulation model are the cooling load needed, the evaporation temperature, the ambient temperature which affects the condensation temperature, the IHX effectiveness, and solar irradiation. By setting the cooling load, evaporation & ambient temperature, the model estimates the discharge & suction pressure, the global efficiency of the compressor, the system mass flow rate, the ideal energy delivered by the compressor, the actual compressor power consumption, the system coefficient of performance, compressor discharge temperature, 2nd law efficiency, exergy destruction in each component of the system and the total, and solar panel area. In the case of R717, there is no accessible technical data so its global efficiency was approached by using the correlation reported by Stoecker [42].
Selected global efficiencies of compressors
| Refrigerant | Global efficiency regression | >R>2 (%) |
|---|---|---|
| R134a | ηglobal =2.78920490E-01+7.97778933E-02*PR-7.92964230E-03*PR2+2.28079792E-04*PR3 | 99.19 |
| R600a | ηglobal =4.33098142E-01+2.31267987E-02*PR-2.69840045E-03*PR2+7.65439121E-05*PR3 | 99.79 |
| R290 | ηglobal =4.84588342E-01+9.87701530E-03*PR-1.06838391E-03*PR2 | 99.85 |
| R717 | ηglobal =-0.00097*PR2-0.01026*PR+0.83955 [42] | - |
Figure 3a shows the comparison between the power consumption of the DC compressors reported by the manufacturers (Man_Ẇ) [41] and those from the simulation model (Mod_Ẇ) using the refrigerants R600a, R290, and R717, under the same operating conditions. Figure 3b shows the corresponding comparison between the COP reported by the manufacturers (Man_COP) and that from the model (Mod_COP).
Simulation model data vs manufacturer data for [a] compressor energy consumption and [b] refrigerator COP
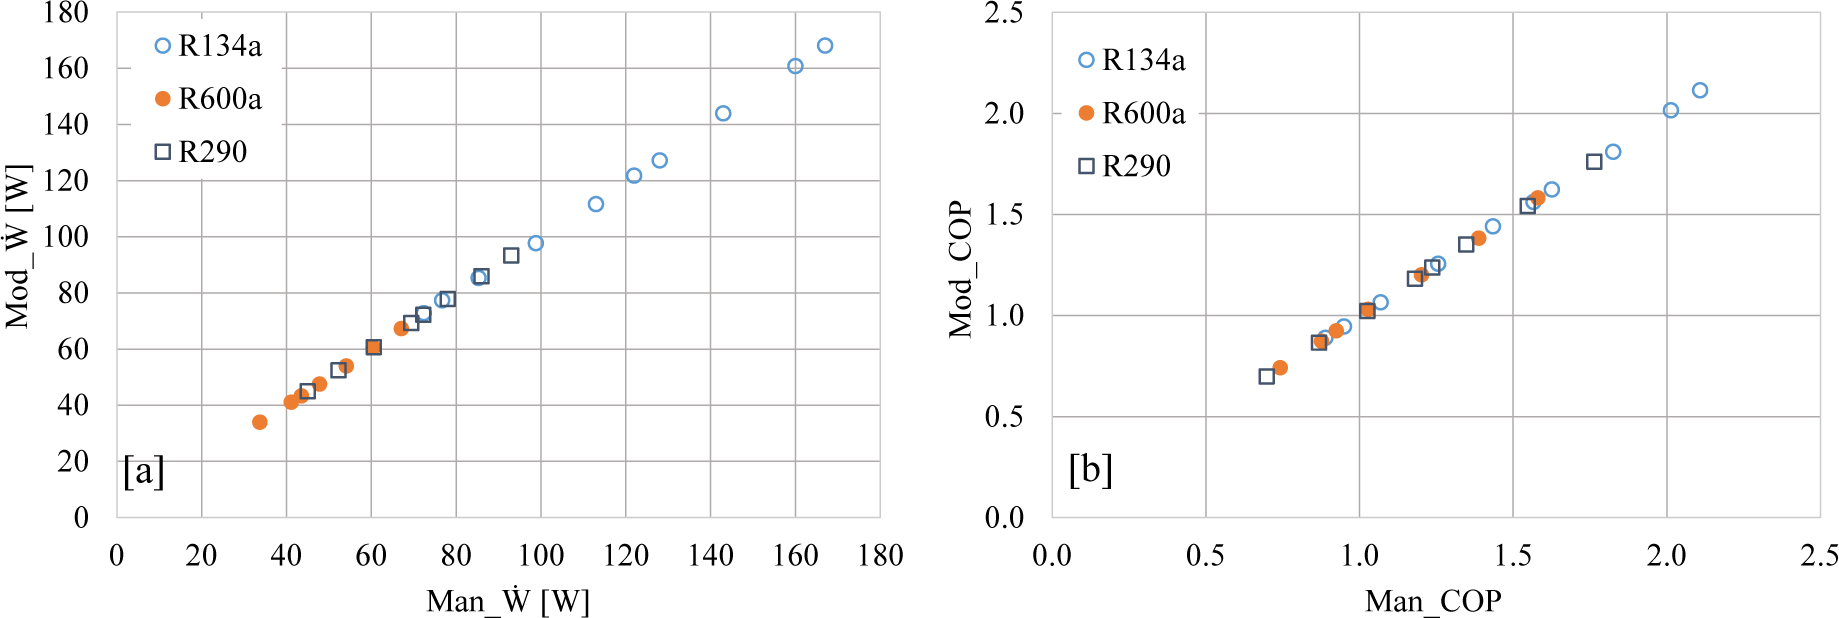
The technical data available of the DC compressors involve cooling loads ranging from 0.025 kW to 0.208 kW, evaporation temperatures varying from -40 °C to -5 °C, and temperature of condensation of 50°C for the R134a and R600a systems, and 45 °C for the R290 system. Therefore, the use of the model was limited to these operation ranges. However, higher evaporation temperatures could be studied cautiously. In all the cases, the relationships are linear with a slope of 45% while the relative errors were below 1%. Therefore, the simulation model can be used for further studies as presented below.
This subsection provides the analysis and quantification of the effect of the operation conditions on the DC refrigerator performance parameters selected. Figure 4 shows the effect of the evaporation temperature, condensation temperature and IHX effectiveness on the refrigerator COP using R134a, R600a, R290, and R717. Figure 4a shows that the 134a system COP increases with increasing the IHX effectiveness and evaporation temperature, as well as when the condensation temperature/ambient temperature drops. When the IHX effectiveness was varied from 0.0 to 0.6, the COP increased by 3.73% at a condensation temperature of 35 °C and evaporation temperature of -10°C. At the same previous condensation temperature and an evaporation temperature of -32 °C, the COP rose by 8.25% for the same IHX effectiveness range.
Coefficient of performance (COP) vs IHX effectiveness, T_cond, and T_evap, for: [a] R134a, [b] R600a, [c] R290, and [d] R717
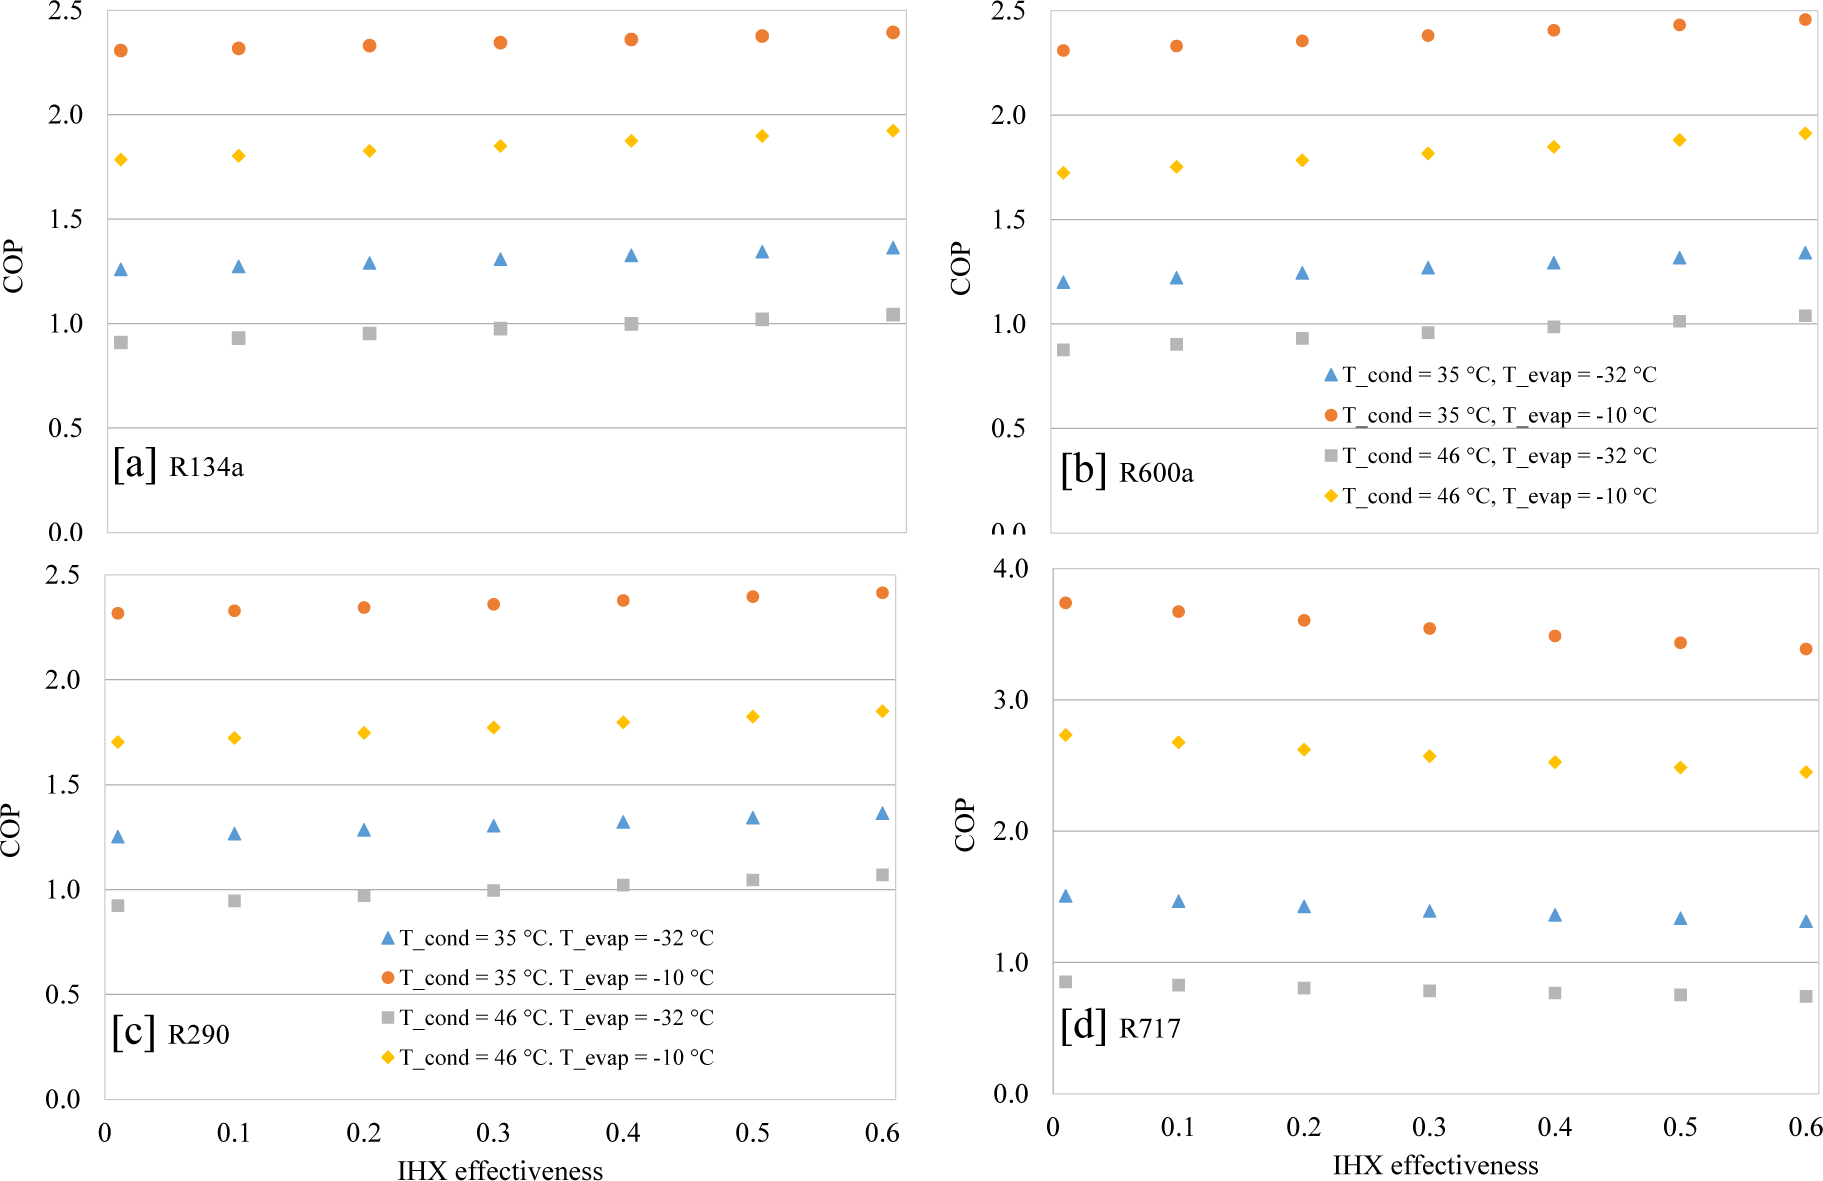
Moreover, at a condensation temperature of 46 °C and an evaporation temperature of -10°C, the COP increased by 7.79% when varying the IHX effectiveness, whereas, at a condensation temperature of 46 °C and an evaporation temperature of -35 °C, the COP increased by 14.51%. Results indicate that the use of the IHX has a stronger effect on the COP at the most drastic operating conditions while the benefits on the COP are rather small at a high temperature of evaporation and low temperature of condensation.
Results also demonstrate that the effect of the condensation temperature on the COP is stronger at the lowest evaporation temperature. For a refrigerator with no IHX operating at an evaporation temperature of -10 °C, the COP dropped by 22.7% when the temperature of condensation changed from 35 °C to 46 °C, whereas this drop was about 27.7% for an evaporation temperature of -32 °C. In the case of a refrigerator with IHX and an effectiveness of 0.6, these drops were around 19.6% and 23.5%, at an evaporation temperature of -10 °C and -32 °C, respectively. These results indicate that the use of the IHX reduces the effect of the condensation temperature on the refrigerator performance.
Figure 4b indicates that for the fixed IHX effectiveness range and evaporation temperature of -10 °C, the R600a system COP increased by 6.41% and 11.0% at a condensation temperature of 35 °C and 46 °C, respectively. For an evaporation temperature of -32 °C, the effect of the IHX on the COP is more notorious, resulting in COP improvements of around 11.7%, and 18.7%, at condensation temperatures of 32 °C and 45 °C, respectively. Results evidence that the temperature of condensation has a stronger impact on the system performance with R600a than that on the R134a system. In this case, the R600a COP system dropped by 25.4% and 27% by increasing the temperature of condensation at temperatures of evaporation of -10 °C and -32 °C, respectively.
Regarding Figure 4c, it shows that when the IHX effectiveness was varied in the given range, the R290 system COP increased at a similar rate in comparison to those with R134a. In the case of the condensation temperature effect on the COP, the R290 system COP dropped by 26.3% when increasing the temperature of condensation from 35 °C to 46 °C at the established temperatures of evaporation. Similar to the case with the R134a system, the use of the IHX device reduced the impact of the condensation temperature for R600a and R290 on the system COP.
Figure 4d presents the system performance using R717. For the IHX effectiveness range given and contrary to the previous results with the other refrigerants, the COP dropped when the IHX was used. This negative effect was also noted by Domanski et al., (2014) in a cooling system for air-conditioning conditions. For instance, the COP dropped by 9.41% when the temperature of condensation was 35 °C, the temperature of evaporation was -10°C, and the IHX effectiveness varied in the range given. This drop was the highest at a condensation temperature of 46 °C and evaporation temperature of -32°C with a 15.08% decline. Results also evidence that the use of the IHX slightly increases the negative effect of the condensation temperature. According to the results, it can be mentioned that the use of the IHX is not beneficial to the R717 system performance.
Figure 5 summarizes the COP relative difference of the R600a, R290a, and R717 systems concerning that of the R134a system with and without IHX, at a condensation temperature of 35°C and evaporation temperature of -10 °C, and at a condensation temperature of 46°C and evaporation temperature of -32 °C. Results indicated that the COP values of the R290a system were slightly higher than that of the R134a with and without IHX, under the study conditions. For the R600a system, the COP reached was lower than that of the R134a at a condensation temperature of 46°C and evaporation temperature of -32 °C with and without IHX. On the other hand, the R600a system COP surpassed that of the R134a at a condensation temperature of 35 °C and evaporation temperature of -10 °C with and without IHX.
COP relative difference vs IHX effectiveness considering R134a as a base case
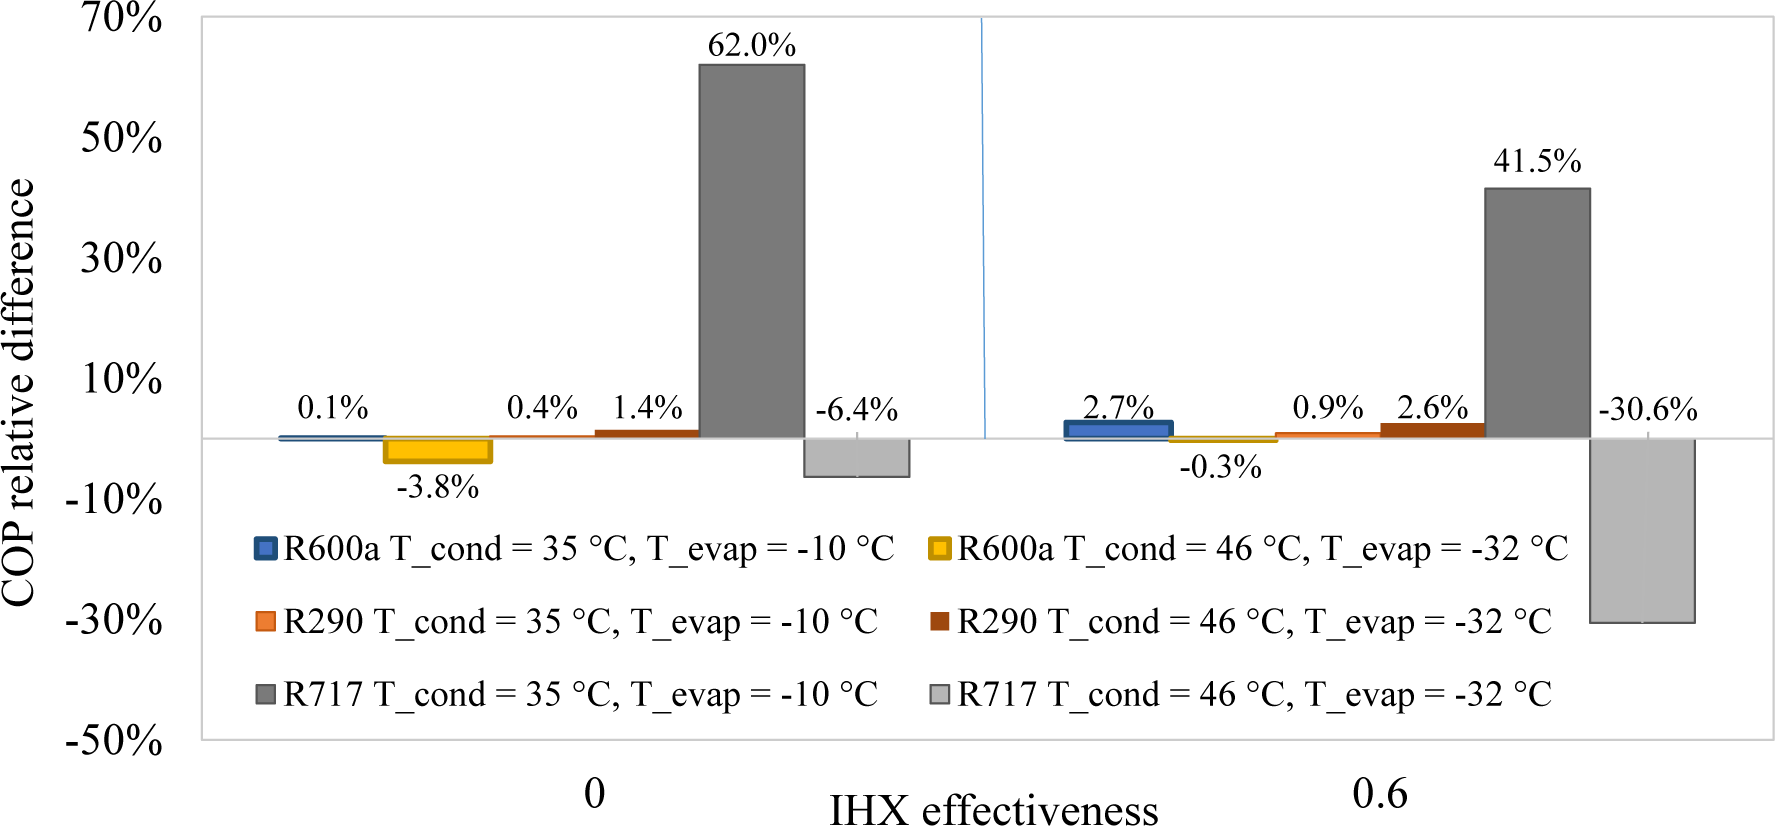
Regarding the R717 system COP, results indicated that the R717 system can reach much higher COP values than that of the R134a at a condensation temperature of 35 °C and evaporation temperature of -10 °C with and without IHX. However, it can also be noted that in the worst conditions (condensation temperature of 46 °C and evaporation temperature of -32 °C), the R717 system COP dropped below that of the R134a. In addition, Figure 5 shows that the use of the IHX is detrimental to the R717 system COP. More details and explanations of the COP trends are given from the results in Figure 6.
Compressor power consumption (Ẇ) vs IHX effectiveness, T_cond, and T_evap, for: [a] R134a, [b] R600a, [c] R290, and [d] R717
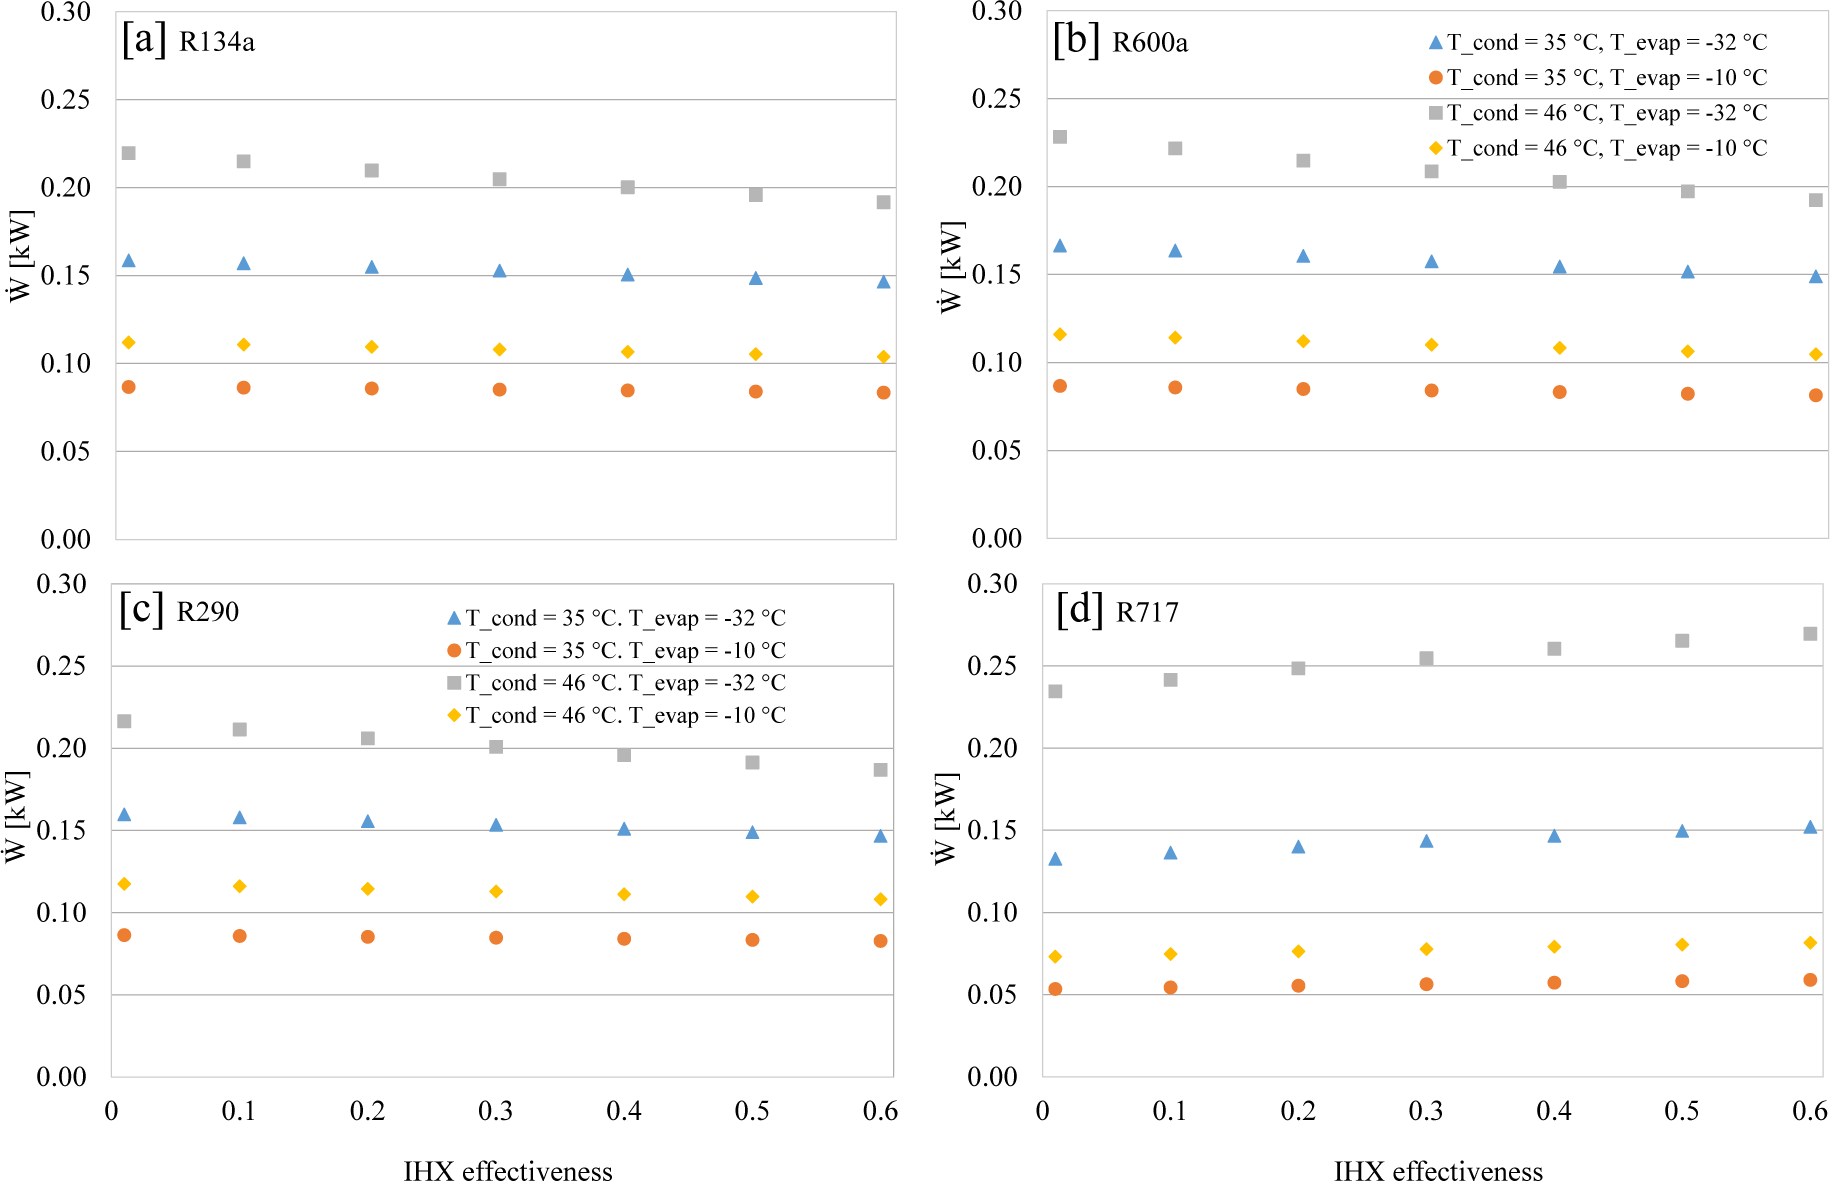
Figure 6 illustrates the compressor power consumption using R134a, R600a, R290a, and R717 at different condensation temperatures, evaporation temperatures, and IHX effectiveness. For the given cooling load, the compressor power consumption has a direct effect on the system COP. Therefore, the COP improvements reported in Figure 4 were obtained due to the drop in the compressor power consumption for the corresponding cases. Otherwise, a COP drop was the result of a rise in the compressor power consumption as was the case for R717.
Figure 6 shows that the use of the IHX reduced the compressor power consumption of the R134a, R600a and R290 systems, under the studied conditions. Moreover, it can be highlighted that the drop in power consumption is more pronounced at a condensation temperature of 46°C and an evaporation temperature of -32 °C when increasing the IHX effectiveness. For instance, the power consumption dropped by 12.7%, 13.6%, and 15.8% for the R134a, R600a, and R290 systems, respectively, when using an IHX with the effectiveness of 0.6 with respect to the values with the effectiveness of 0. On the other hand, the power consumption dropped around 3.6%, 4.1%, and 6.0%, for the mentioned refrigerants, respectively, at a condensation temperature of 35 °C and evaporation temperature of -10 °C. In the case of the R717 system, the use of an IHX produced a rise in the compressor power consumption between 10.4% and 15.0%, being the power rise more pronounced at the most extreme conditions. The reason for this behaviour is discussed in the results from Figure 8.
In all the cases, a major rise in the compressor power consumption is obtained due to the change in the condensation temperature from 35 °C to 46 °C. According to the results, the R717 compressor is the most affected by the condensation temperature while fixing an evaporation temperature of -10 °C. The R134a compressor is less affected by the condensation temperature variation. The rise in the compressor power consumption due to the condensation temperature increase is because the compressor must provide the energy required to the refrigerant to achieve adequate conditions for its condensation, therefore, the higher the condensation temperature, the higher the energy state required in the refrigerant at the compressor outlet.
Figure 7 indicates that the R134a system requires the highest refrigerant charge and mass flow rate, whereas the R717 system needs the lowest charge and mass flow rate, among the studied refrigerants. It is important to mention that the mass flow rate directly influences the compressor power consumption. The power consumption decreases as the mass flow is reduced. Figure 7 also shows that when using the IHX, the mass flow rate can progressively drop by 34.2%, 34.9%, 34.6%, and 17.7%, for the R134a, R600a, R290, and R717 systems, respectively. It can also be observed that the R600a and R290 systems required mass flow rates around 45% lower than those required for the R134a system. Moreover, the mass flow rates required for the R717 system can be around 87.1% lower than those for R134a. Additionally, it can also be observed that the use of the IHX reduced the effect of the condensation and evaporation temperature on the mass flow rate required. According to the results, the mass flow values at different condensation and evaporation temperatures tend to converge when increasing the IHX effectiveness.
Refrigerant mass flow (ṁ) vs IHX effectiveness, T_cond, and T_evap, for: [a] R134a, [b] R600a, [c] R290, and [d] R717
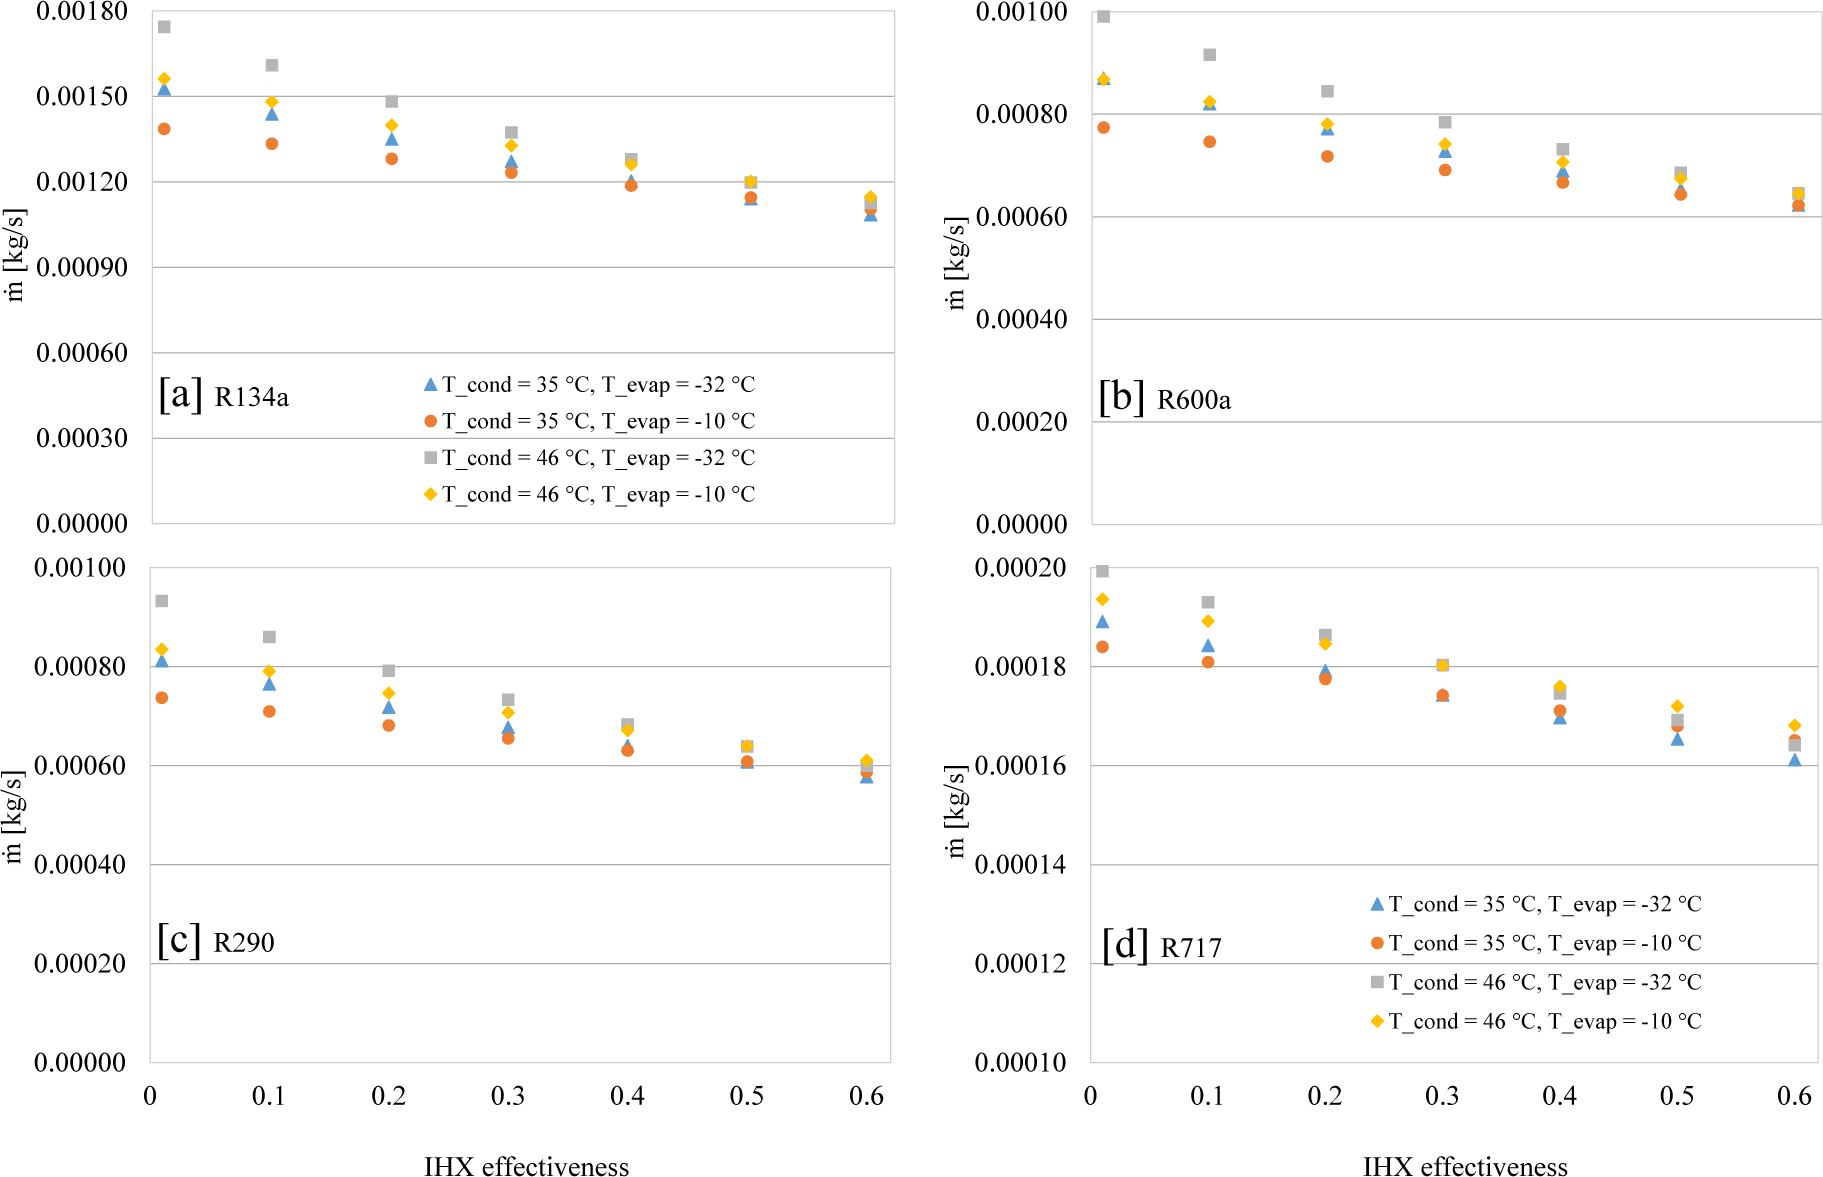
In general, for a given cooling capacity, the drop in the R600a, R290, and R717 mass flow rates, concerning the R134a, is the result of their wider latent heat. The R717 refrigerant is the one with the highest latent heat, therefore, the refrigerant with the lowest mass flow rate is needed. The drop in the mass flow rates when using an IHX can be explained due to the increased subcooling between the refrigerant temperature at the outlet of the condenser and the outlet of the IHX. For a given cooling load, the higher the subcooling is, the lower the mass flow required.
Figure 8 presents the estimated vapour refrigerant temperature at the inlet of the compressor (T3), the outlet of the compressor (T4), and the estimated liquid refrigerant temperature at the outlet of the IHX (T6) (see numeration in Figure 1). T5, T1, and T2 are not shown because these parameters were fixed considering the temperature of condensation and evaporation. The orange horizontal lines correspond to a discharge temperature limit of 380 K [8]. Results show that the rise of the refrigerant temperature was more pronounced at the compressor outlet in comparison to that at the compressor inlet when increasing the IHX effectiveness. This effect resulted in a wider refrigerant enthalpy difference and a lower mass flow rate than that without the IHX. Given the drop in the compressor power using the IHX for the refrigerants R134a, R600a, and R290a (see Figure 6), it can also be mentioned that the reduction of the mass flow rates (see Figure 7) was more significant than the rise in the temperature difference (see Figure 8) and thus, in the compressor enthalpy difference.
Temperatures at the outlet of the compressor and IHX vs IHX effectiveness, T_cond, and T_evap, for: [a] R134a, [b] R600a, [c] R290, and [d] R717
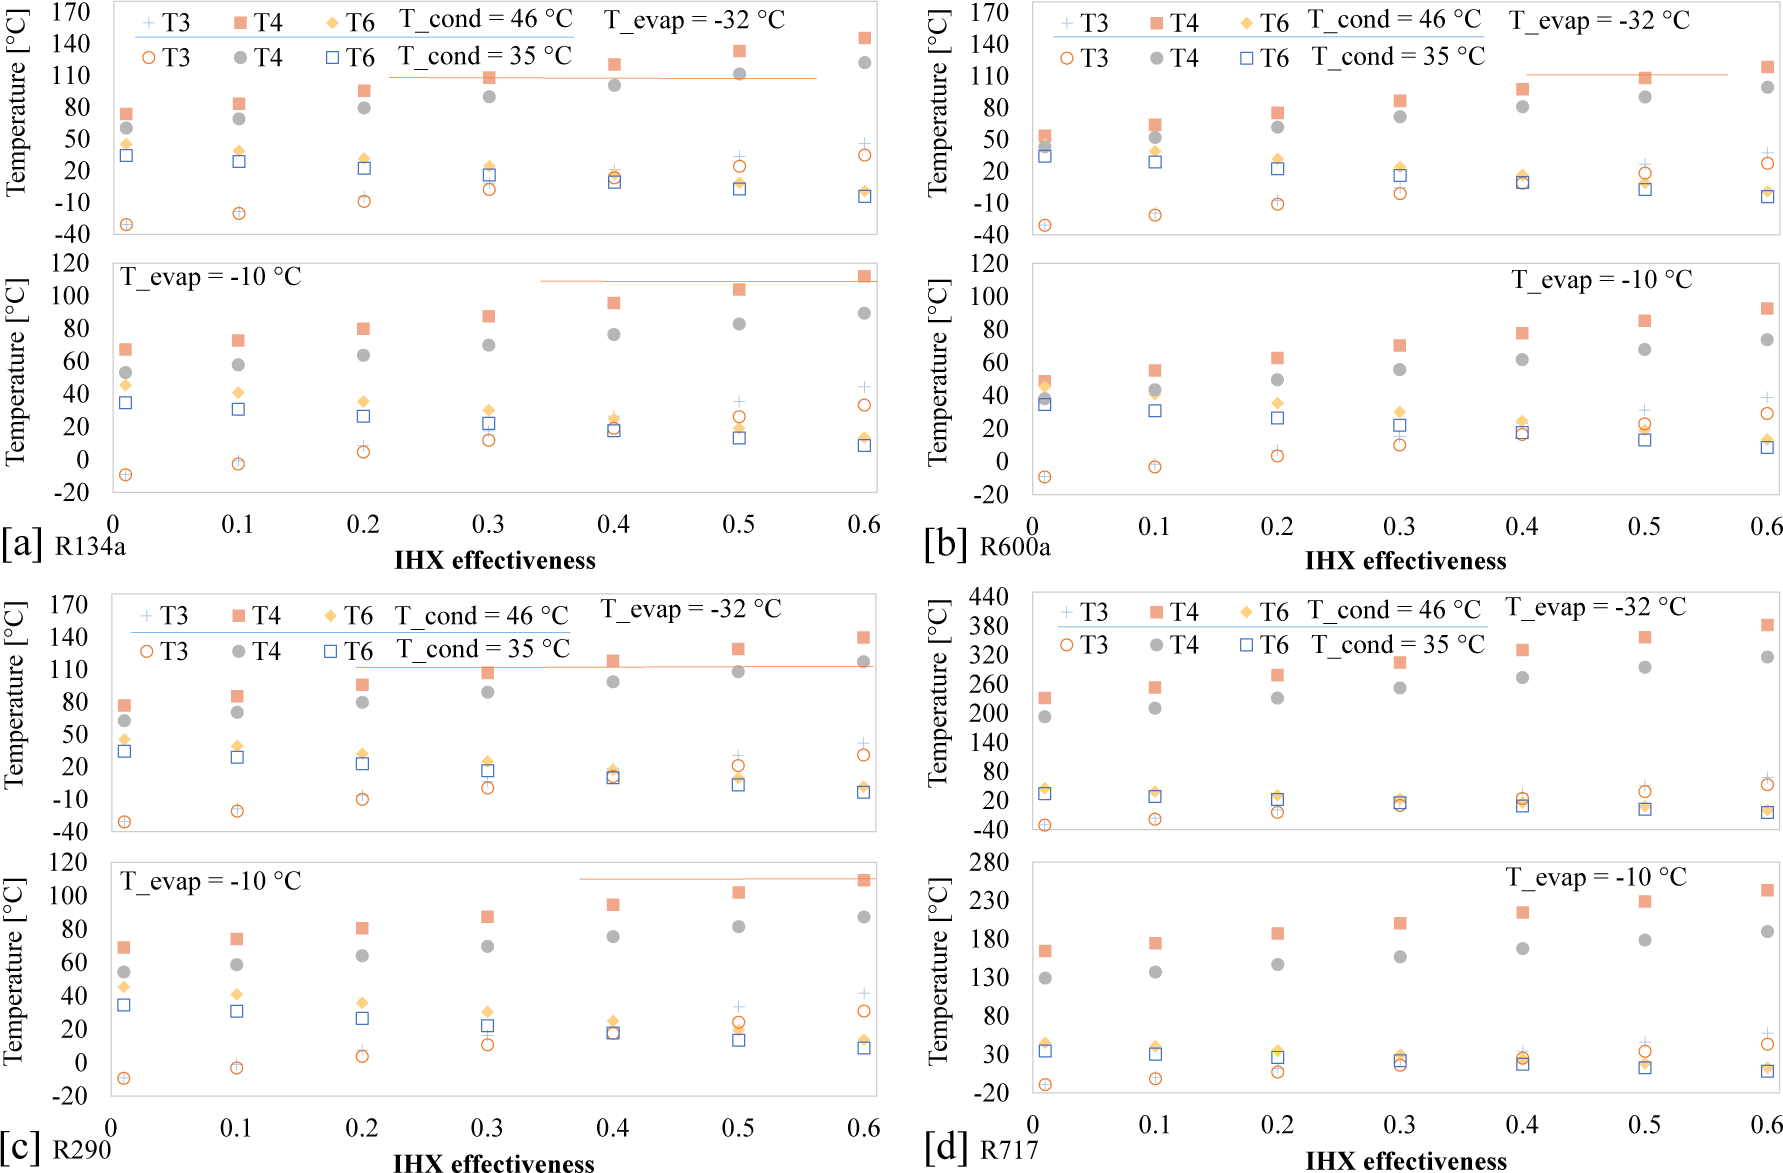
Figure 8 shows that at a condensation temperature of 46 °C and evaporation temperature of -35°C, the refrigerant temperature at the compressor outlet increases almost linearly for the refrigerants R134a, R600a, and R290, respectively when using the IHX with effectiveness varying from 0.0 to 0.6. In the case of a condensation temperature of 35 °C and evaporation temperature of -32 °C, maximum temperatures reached at the outlet of the compressor were 122.1 °C, 99.4 °C, and 117.3 °C, for the R134a, R600a, and R290, respectively. The results at an evaporation temperature of -10 °C showed that the mentioned refrigerant temperatures at the outlet of the compressor dropped by 33 °C, 26 °C, and 30 °C, for the R134a, R600a, and R290 refrigerants, respectively. It can then be noted that the R134a and R290 surpassed the refrigerant discharge temperature of 380 K at IHX effectiveness values above 0.3 at an evaporation temperature of -32 °C. Moreover, the R717 system surpassed the discharge temperature limits at all the operating conditions established.
Results also indicate that the maximum superheating condition obtained at the outlet of the IHX can be up to 76 °C, 67.5 °C, and 71.9 °C, for the refrigerants R134a, R600a, and R290, with an evaporation temperature of -32 °C. At an evaporation temperature of -10 °C, the maximum superheating values decrease by 22-19 °C for the mentioned refrigerants. Consequently, the maximum subcooling can be up to 41 °C for R134a, R600a, and R290. As mentioned before, it contributed to the mass flow drop for the established cooling load.
An extreme case is that with the R717. Given the cooling capacity and the wide R717 latent heat, the mass flow was lower than that for the other refrigerants and decreased even more when using the IHX. This also increased the enthalpy difference between the outlet and inlet of the compressor, which resulted in a significantly high temperature at the compressor inlet and outlet. According to this, the use of the IHX is not recommendable for the established application using R717. Also, the use of R717 in small-capacity refrigerators could be of interest if the temperature of evaporation is kept above -10 °C, the condensation temperature is below 46 °C, and an appropriate compressor cooling is provided.
This subsection provides the exergy analysis considering the 2nd law efficiency and exergy destruction in the entire system and per component, as a function of the condensation temperature, evaporation temperature, and IHX effectiveness.
Figure 9 shows that the exergy efficiency rose as the IHX effectiveness was varied from 0.0 to 0.6, for the R134a, R600a, and R290 refrigerants, whereas the opposite effect was observed for the R717. Moreover, the exergy efficiency ranged between 0.20 and 0.24, between 0.20 and 0.25, between 0.20 and 0.23, and between 0.13 and 0.27, for R134a, R600a, R290a, and R717, respectively. The exergy efficiencies were relatively close for R134a, R600a, and R290, being the R600a refrigerant the case with a slightly higher exergy efficiency among the three refrigerants. On the other hand, the R717 system presented the lowest and highest exergy efficiencies which evidence a wider efficiency range in comparison to those for the other refrigerants.
2nd law efficiency vs IHX effectiveness, T_cond, and T_evap for: [a] R134a, [b] R600a, [c] R290, and [d] R717
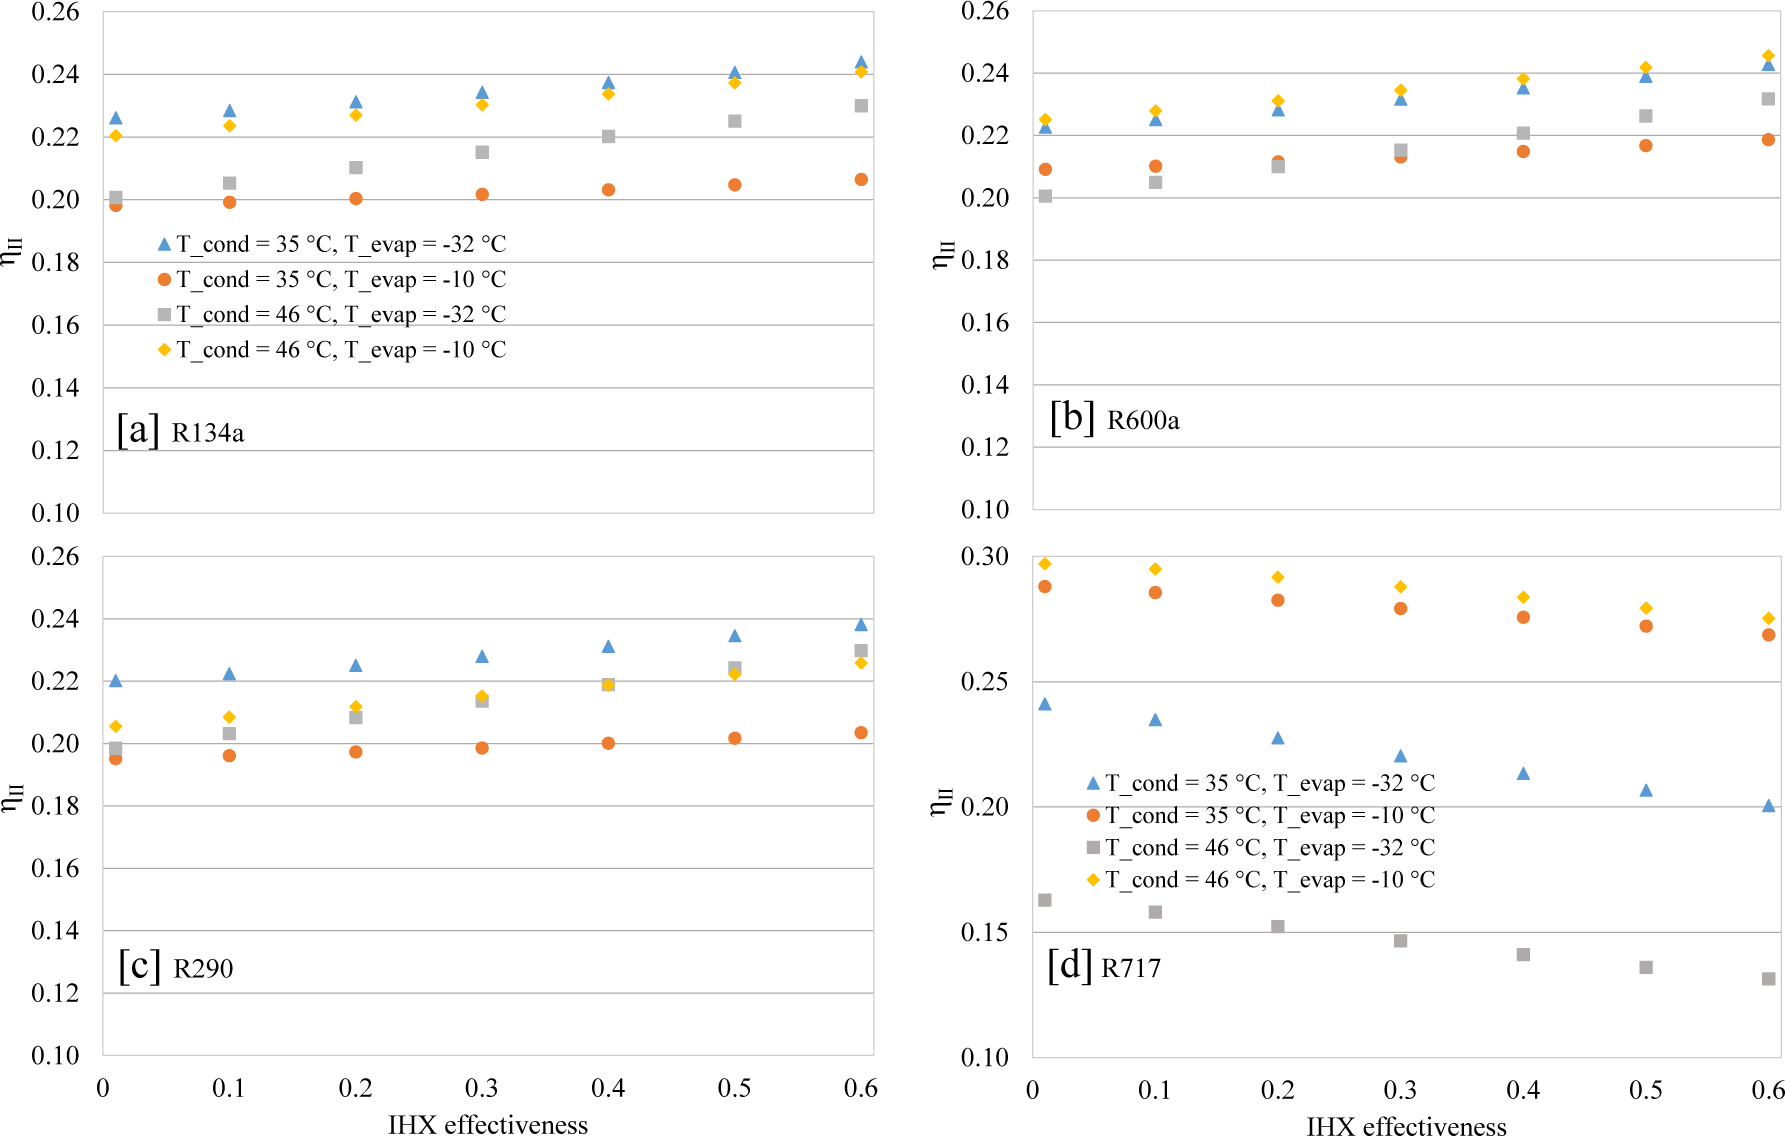
In general, the lowest efficiencies were obtained at a condensation temperature of 35 °C and evaporation temperature of -10 °C for R134a, R600a, and R290. This means that despite the exergy destruction was the lowest for each refrigerant (see Figure 10), the compressor power input was also the lowest obtained (see Figure 6), resulting in a high relation between the total exergy destruction and the exergy input. In the case of R717, the lowest exergy efficiencies were obtained at a condensation temperature of 46 °C and an evaporation temperature of -32 °C. At these conditions, both the compressor power input (see Figure 6d) and the total exergy destruction (see Figure 10d) were the highest obtained from the results, while the relation between the exergy destruction and exergy destruction was also high.
Figure 10 shows the effect of the condensation temperature, evaporation temperature, and IHX effectiveness on the total exergy destruction. The exergy destruction results for R134a, R600a, and R290 ranged between 0.06 kW and 0.15 kW, whereas the range for R717 was between 0.04 kW and 0.23 kW. The lowest exergy destruction values were obtained at a condensation temperature of 35 °C and evaporation temperature of -10 °C, whereas the highest exergy destruction values were reached at a condensation temperature of 45 °C and evaporation temperature of -32 °C for all the studied refrigerants. As can be observed in Figure 10, the total exergy destruction progressively dropped as the IHX effectiveness was increased for R134a, R600a, and R290. In the case of R717, the use of the IHX rose the total exergy destruction under the studied conditions. Results also evidence that in all the cases, the effect of the condensation temperature on the total exergy destruction was more noticeable at an evaporation temperature of -32 °C, while the effect of the evaporation temperature was more remarkable at a condensation temperature of 46 °C.
Total exergy destruction vs IHX effectiveness, T_cond, and T_evap for: [a] R134a, [b] R600a, [c] R290, and [d] R717.
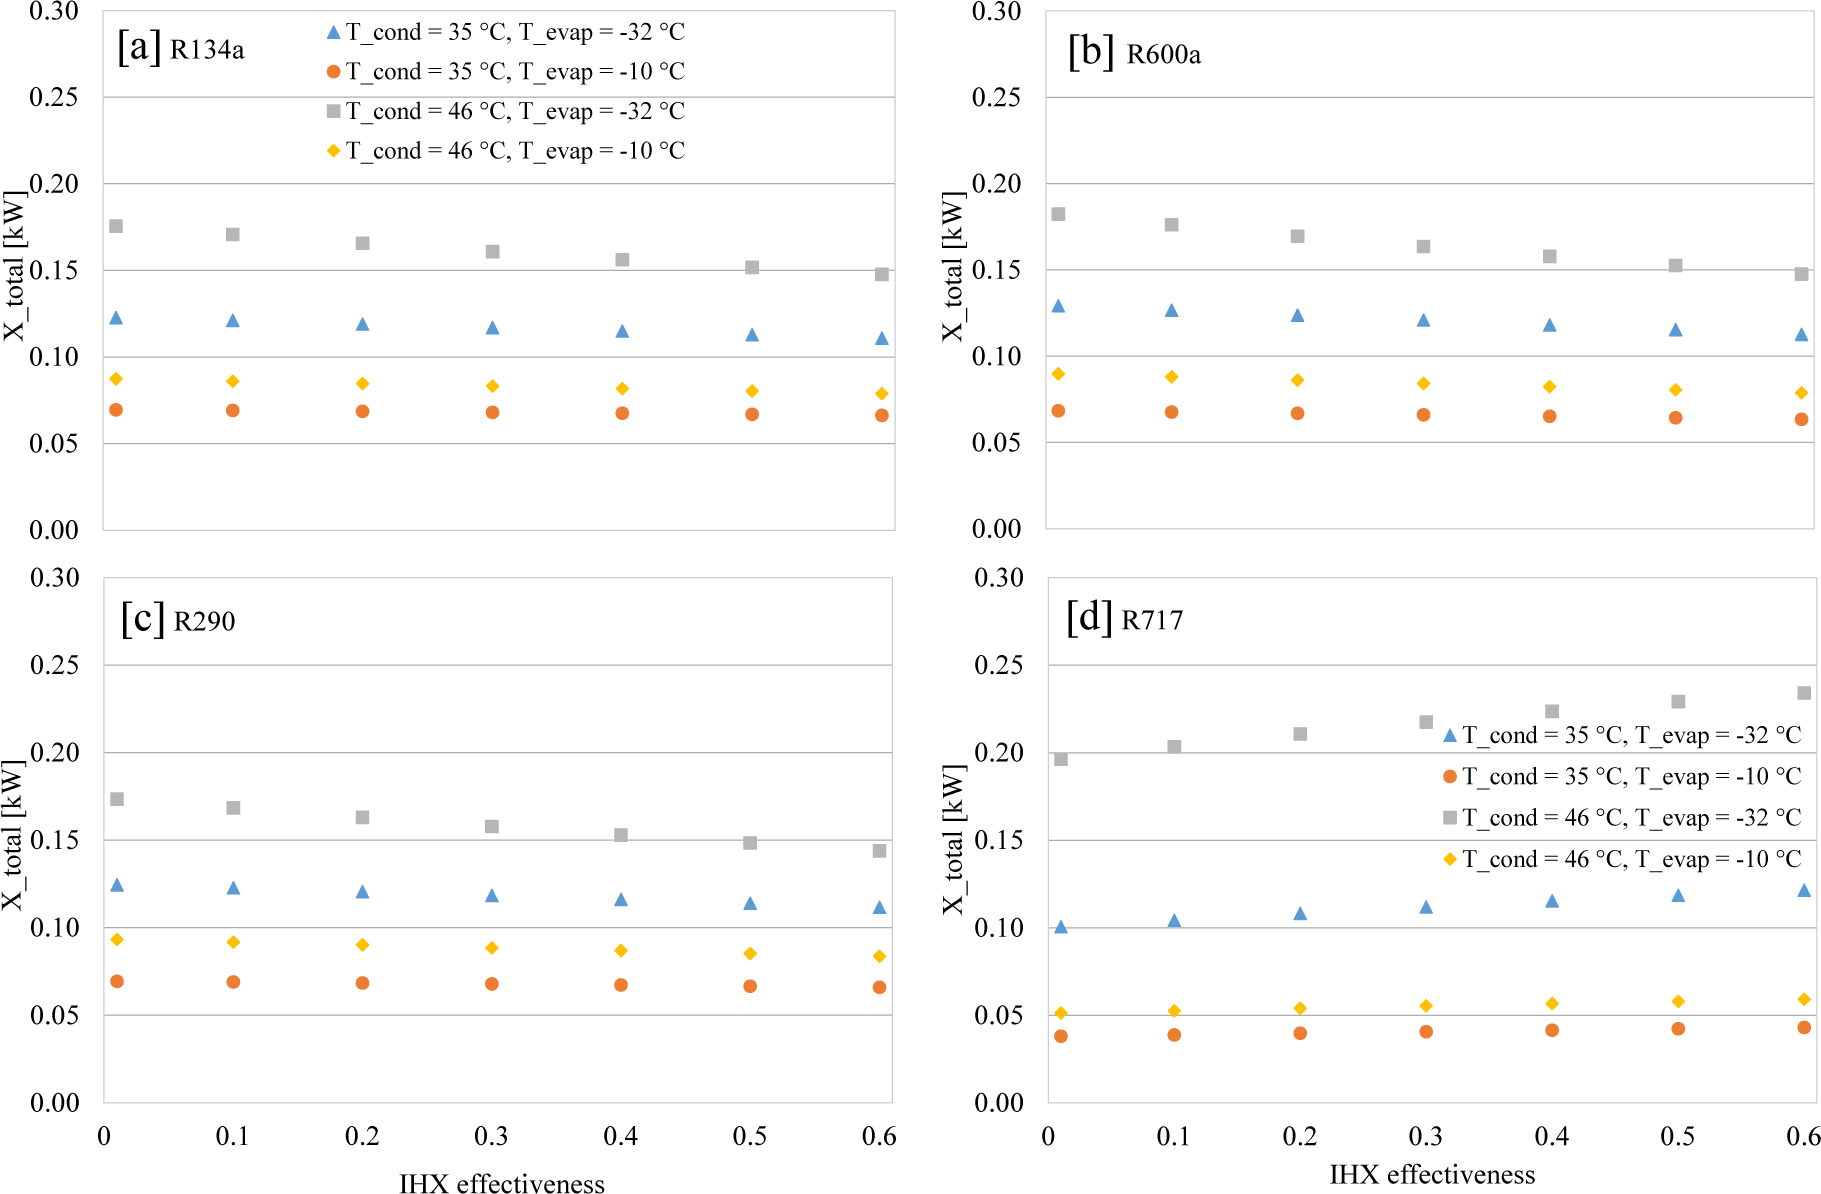
Figure 11 presents the exergy destruction per component of the refrigerator as a function of the IHX effectiveness at a condensation temperature of 35 °C and evaporation temperature of -32 °C. As can be noted, the compressor was the component with the highest exergy destruction, followed by the expansion device at IHX effectiveness values below 0.3, and the condenser at IHX effectiveness values above 0.3, for R134a, R600a, and R290. According to the results, the exergy destruction in the compressor dropped as the IHX effectiveness was varied from 0.0 and 0.6, for R134a, R600a, and R290. The opposite effect was obtained for the R717 since the exergy destruction was increased by the IHX which significantly rose the operating temperature in this component.
Exergy destruction in each component vs IHX effectiveness for: [a] R134a, [b] R600a, [c] R290, and [d] R717
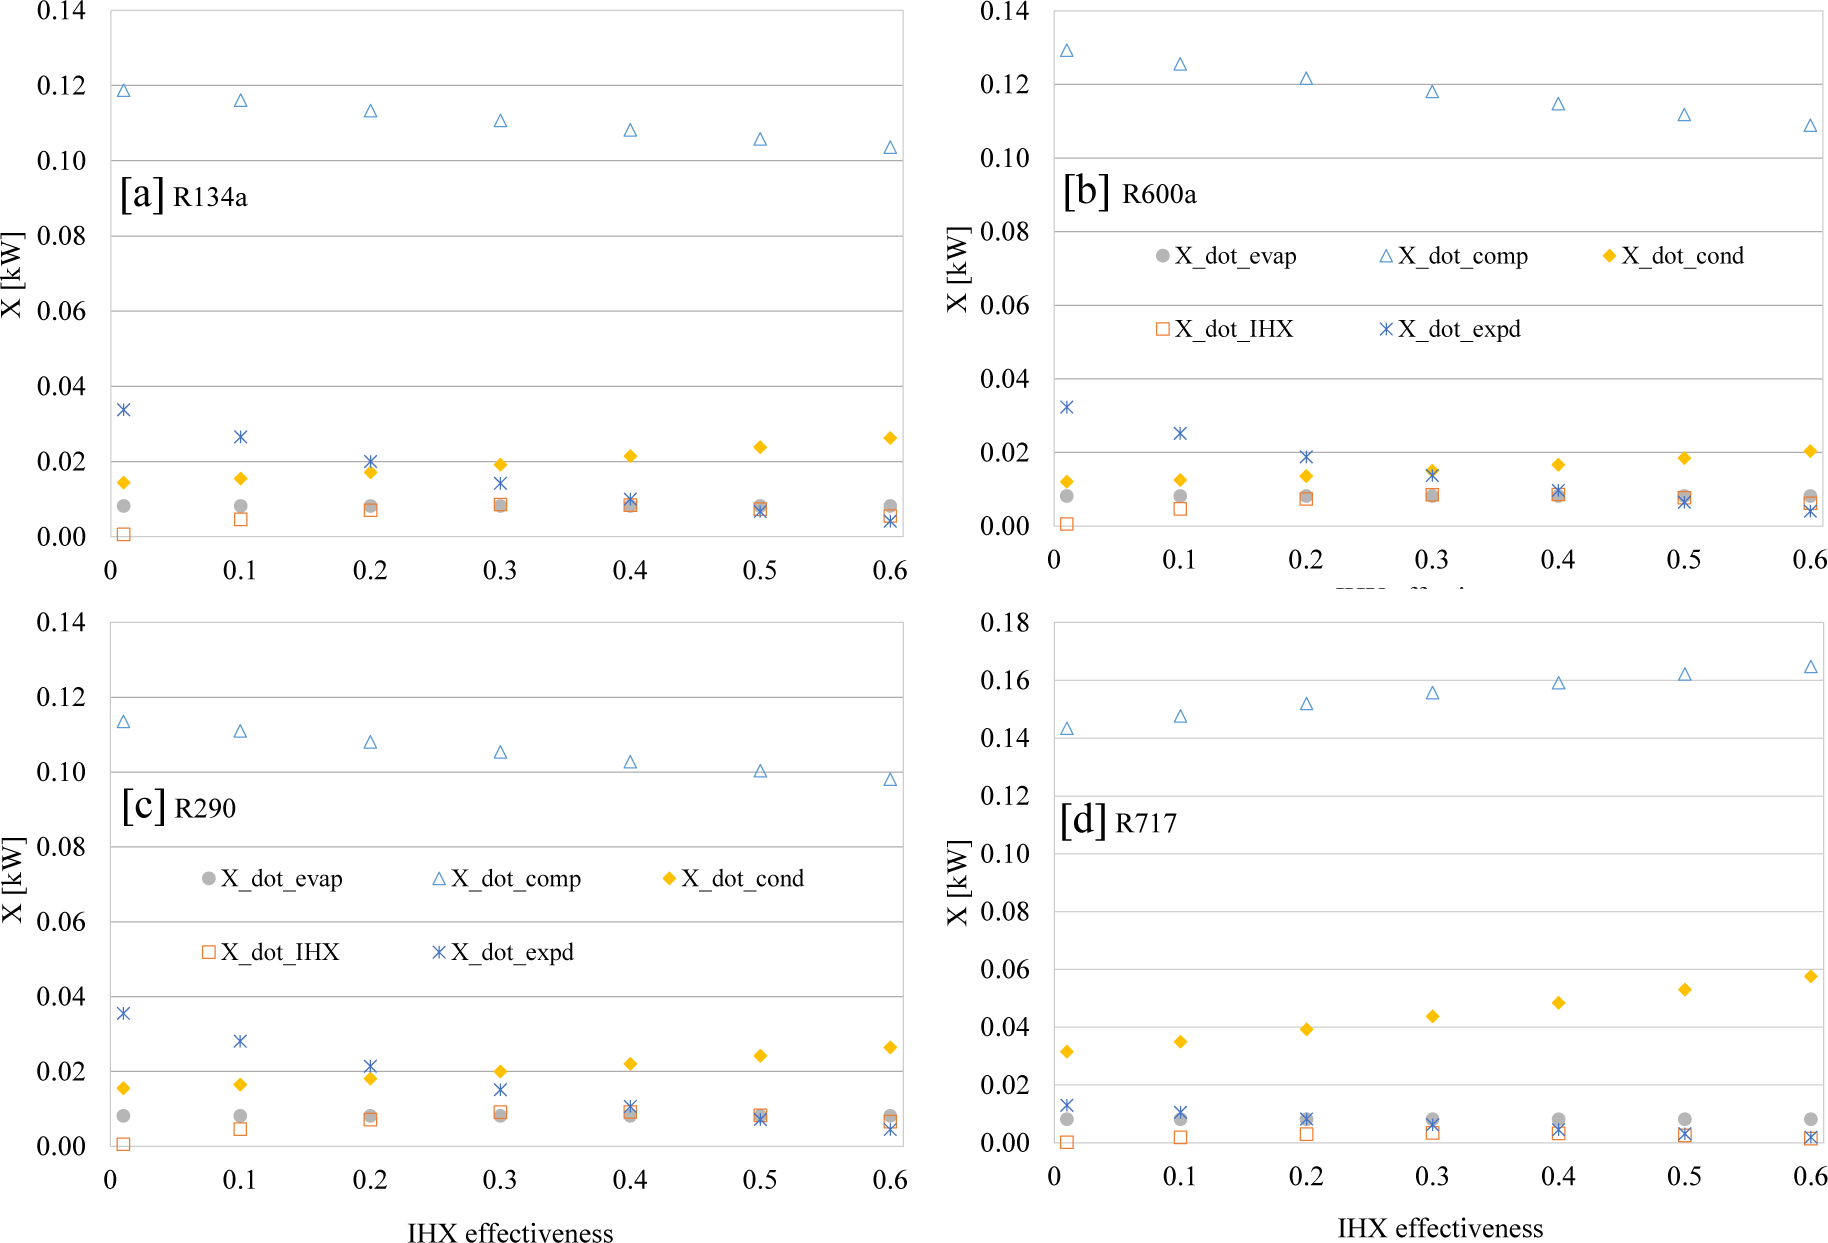
In the case of the expansion device, exergy destruction decreased as IHX effectiveness was increased. On the other hand, the exergy destruction in the condenser rose as IHX effectiveness was increased. The exergy destruction trend in the expansion devices can be explained due to the rise of the subcooling degree when using the IHX, while the rise in the condenser exergy destruction is due to temperature increment at the inlet of the condenser because of the IHX effect. Regarding the compressor exergy destruction, as mentioned before the mass flow dropped as the subcooling was increased due to the use of the IHX, which reduced the compressor power input and its difference concerning the isentropic compressor power. Regarding the exergy destruction in the evaporator and IHX, they kept a low exergy destruction rate for all the refrigerants at all IHX effectiveness values.
In general, results indicate that the exergy destruction in the compressor was around 61-70%, 64-74%, 61-68%, and 31-73% of the total, for the R134a, R600a, R290, and R717 systems, respectively. The more extreme the operating conditions were, the higher the exergy destruction in the compressor was. In the case of the expansion device, the exergy destruction can be up to 19%, 18%, 20%, and 12% of the total, for the R134a, R600a, R290, and R717 systems, respectively, whereas the exergy destruction in the condenser can be up to 22%, 19%, 22%, and 50% of the total, for the R134a, R600a, R290, and R717 systems, respectively. Results indicate that the R717 system was the configuration with the highest potential for improvement, especially in the most extreme operating conditions. Moreover, R600a and R290 appear as good substitutions for R134a in small-capacity refrigerators while the use of an IHX is beneficial to improve the system performance for these two natural refrigerants.
Considering the results of the previous subsections, the solar system analysis is focused on the energy consumption of the refrigerator using those natural refrigerants with the appropriate operation plus the energy collected by the PV solar panels. Previous results showed that the operating conditions fixed were not beneficial for the operation of the refrigerator using R717, therefore, only the R600a and R290 were used as natural refrigerants from this subsection. Results in Table 4 were obtained at evaporation temperatures of -32 °C and -10 °C, using R134a, R600a, and R290 as refrigerants. The effectiveness of the IHX was set considering the recommended refrigerant temperature limit [8] at the outlet of the compressor according to the results in Figure 8. In the case of the temperature of condensation, it was varied considering a 12°C temperature difference with respect to the environmental temperature variation for the 1st of July in Barranquilla (see Figure 2). It means that the temperature of condensation was varied between 39 °C and 45 °C which indicates that the environmental temperature changed between 27 °C and 33 °C. This day represents the warmest day of the year and therefore, the day with the highest energy consumption in the compressor at the established operating conditions. The daily power consumption for each case was estimated considering the stable operation of the refrigerator. During the compressor operation, it is usual to find on and off cycles, so a correction factor of 2/3 was assumed and applied to the continuous operation of the compressor to account only for the time in which the compressor is on. Consequently, Table 4 shows that at an evaporation temperature of -32 °C, the daily power consumption of the refrigerator with IHX was 2.934 kWh, 2.907 kWh, and 2.872 kWh, using the refrigerants R134a, R600a, and R290, respectively. These values rose to 3.106 kWh, 3.219 kWh, and 3.054 kWh without the IHX, using the refrigerants R134a, R600a, and R290, respectively. This means that the compressor energy consumption can be reduced by 6%, 9.7%, and 6%, for the refrigerants R134a, R600a, and R290, respectively, if the IHX is used at the established effectiveness. Moreover, at an evaporation temperature of -10 °C, the daily power consumption of the refrigerator dropped by 5%, 7%, and 5%, for the mentioned refrigerant, respectively, when using the IHX. It can also be noted that the mass flow rate dropped as the evaporation temperature increased and when the IHX was used.
Daily compressor energy consumption and daily PV power production using R134a, R600a, and R290 as refrigerants
| R134a | R600a | R290 | ||||
|---|---|---|---|---|---|---|
| Tevap, °C | -32 | -10 | -32 | -10 | -32 | -10 |
| Daily power consumption (without IHX), kWh | 3.106 | 1.615 | 3.219 | 1.652 | 3.054 | 1.662 |
| Mass flow rate (without IHX), kg/s | 0.00166 | 0.00149 | 0.00094 | 0.00083 | 0.00089 | 0.00080 |
| IHX effectiveness | 0.3 | 0.5 | 0.4 | 0.5 | 0.3 | 0.5 |
| Daily power consumption (with IHX), kWh | 2.934 | 1.539 | 2.907 | 1.537 | 2.872 | 1.576 |
| Mass flow rate (with IHX), kg/s | 0.00133 | 0.00118 | 0.00071 | 0.00066 | 0.00071 | 0.00063 |
| Is March, W/ m2 per day | 6698.23 | |||||
| Is July, W/ m2 per day | 6264.58 | |||||
| Is November, W/ m2 per day | 5095.20 | |||||
| APV, m2 | 3.84 | 2.00 | 3.80 | 2.00 | 3.76 | 2.10 |
| Daily PV power in March, kWh | 3.94 | 2.05 | 3.90 | 2.05 | 3.86 | 2.15 |
| Daily PV power in July, kWh | 4.17 | 2.17 | 4.12 | 2.17 | 4.08 | 2.28 |
| Daily PV power in November, kWh | 3.40 | 1.77 | 3.36 | 1.77 | 3.33 | 1.86 |
The daily power consumption of the refrigerator with IHX was used to estimate the area of PV solar panels according to eq. (19). The daily mean solar irradiation considered was that in November, which represents the lowest value according to the records in Barranquilla city. In Table 4 can be observed that the area of PV solar panels is similar for the R134a, R600a, and R290 systems under the specified conditions. As expected, the area of PV solar panels required is reduced as the evaporation temperature increases. Since the area of PV is basically the same, the daily PV power generation for each case does not show a remarkable difference. Additionally, the daily PV power generation was estimated for the 1st of March, 1st of July, and 1st of November. This selection was made because March presents the highest average solar irradiation, July presents the highest average environmental temperature, and November presents the lowest average solar irradiation (see Figure 2).
Overall, it can be observed that the solar PV panels are capable to provide the required energy to drive the refrigerator, even during less favourable conditions in terms of solar irradiation and environmental temperature. It is then expected that during the peak irradiation hours, most of the energy collected goes to a storage battery. The remaining energy collected can be used for some small-capacity appliances.
Figure 12 shows, for example, the hourly R290 compressor power consumption and the PV power production during the 1st of March, July, and November. The hourly compressor power consumption corresponds to the data collected for the warmest day of the year (1st of July) when the environmental temperature changed between 27 °C and 33 °C so the condensation temperature was varied between 39 °C and 45 °C.
Solar irradiation (Is) vs PV power production (Ẇ Pv) and compressor energy consumption (Ẇ comp) for the R290 refrigeration system at an evaporation temperature of [a] -32 °C and [b] -10 °C

Results indicate that from 8:00 hours to 16:00 hours, the energy provided by the PV solar panels can be used to run the compressor but also to charge a storage battery to use its energy when solar energy is not available. Moreover, the peak energy generation was obtained between 11:00 and 12:00 hours. Figure 12b shows that the hourly compressor power consumption (between 0.093 and 0.107 kWh depending on the environmental temperature variation) was lower than that in Figure 12a (between 0.169 and 0.196 kWh) given the higher temperature of evaporation. Also, the PV power production in Figure 12b was lower than that in Figure 12a given the smaller area of the PV solar panels required to run the refrigeration system operating at an evaporation temperature of -10 °C.
Additionally, Figure 13 shows that the 1st of July corresponds to the day that the battery receives the maximum energy charge to run the refrigeration system while the lowest energy charge is obtained in November. As mentioned before, the solar PV panel areas for the evaporation temperature of -32 °C and -10 °C are appropriate to capture the energy required to drive the refrigerator using R290, even during less favourable conditions. Comparable results were obtained with R600a according to Table 4. This indicates that both R600a and R290 can be used as natural refrigerants in small-capacity autonomous solar refrigeration applications. However, considering that the specific volume of the R600a at the compressor inlet is more than two times that of the R290, this last one appears as a better option in terms of size.
Cumulative PV power production and compressor energy consumption for the R290 refrigeration system at an evaporation temperature of [a] -32 °C and [b] -10 °C

In this paper, the energy and exergy characterization of a small-capacity autonomous solar refrigerator with an IHX, using R134a and the natural refrigerants R600a, R290a, and R717 was presented. A simulation model was developed and validated considering the operating conditions reported by DC compressor manufacturers. The main outcomes of the research can be used for the design of horizontal small-capacity refrigerators driven by solar energy. The main conclusions from the present study are presented as follows:
The use of IHX improved the system COP and reduced the compressor power input for R134a, R600a, and R290. However, the use of the IHX was found detrimental in the R717 system.
The use of the IHX was found to reduce the impact of the condensation temperature variation for R134a, R600a, and R290. However, the opposite effect was found for R717. Also, the drop in the mass flow rate was found more predominant than the compressor enthalpy difference on the power consumption for R134a, R600a, and R290 when using the IHX. The opposite effect was observed for R717.
The R290 system COP was found slightly higher (0.4-2.6%) than that of the R134a with and without IHX. The R600a system COP was found slightly higher (around 0.1-2.7%) than that of the R134a with and without IHX, only under the most favourable conditions under study. In all the cases, the R717 system surpassed the discharge temperature limits so it was found unsuitable for the present application.
The recommended IHX effectiveness was found around 0.4 for R600a and 0.3 for R290 at an evaporation temperature of -32 °C. For an evaporation temperature of -10 °C, the IHX effectiveness can be up to 0.5 for both R600a and R290.
The IHX was found beneficial to reduce the exergy destruction in the compressor and expansion valve for R134a, R600a, and R290, but increased the exergy destruction in the condenser.
R600a and R290 can be used in small-capacity autonomous solar refrigeration applications while the area of the PV solar collectors does not show a remarkable difference at the established operating conditions and the same cooling load. However, the specific volume of R600a is much higher than that of R290, therefore, the R290 can be preferable in terms of size.
The maximum power consumption of the solar R290 refrigeration system was estimated around 4.08 kWh and 2.28 kWh at evaporation temperatures of -32 °C and -10 °C, respectively, which could be covered by a solar panel area of 3.76 m2 y 2.10 m2, respectively. Similar values were obtained for the solar R600a refrigeration system.
Future research involves the built-up of a small-capacity autonomous solar refrigerator considering different refrigerants and various system modifications.
-
References
- ,
The role of refrigeration in the global economy ,38th Informatory Note on Refrigeration Technologies , 2019 - ,
Commercial refrigeration – An overview of current status ,Int. J. Refrig. , Vol. 57 ,pp 186–196 , 2015, https://doi.org/https://doi.org/10.1016/j.ijrefrig.2015.04.013. - ,
Optimal design and environmental, energy and exergy analysis of a vapor compression refrigeration system using R290, R1234yf, and R744 as alternatives to replace R134a ,Int. J. Refrig. , Vol. 113 ,pp 10–20 , 2020, https://doi.org/https://doi.org/10.1016/j.ijrefrig.2020.01.012 - ,
Energy performance assessment of R430A as a possible alternative refrigerant to R134a in domestic refrigerators ,Energy Sustain. Dev. , Vol. 17 (5),pp 471–476 , 2013, https://doi.org/https://doi.org/10.1016/J.ESD.2013.05.005 - ,
Experimental influence of an internal heat exchanger (IHX) using R513A and R134a in a vapor compression system ,Appl. Therm. Eng. , Vol. 147 ,pp 482–491 , 2019, https://doi.org/https://doi.org/10.1016/j.applthermaleng.2018.10.092 - ,
Experimental study of influence of internal heat exchanger in a chest freezer using r-513a as replacement of r-134a ,Appl. Therm. Eng. , Vol. 204 ,pp 117969 , 2022, https://doi.org/https://doi.org/10.1016/J.APPLTHERMALENG.2021.117969 - ,
Experimental evaluation of system modifications to increase R1234ze(E) cooling capacity ,Appl. Therm. Eng. , Vol. 111 ,pp 786–792 , 2017, https://doi.org/https://doi.org/10.1016/j.applthermaleng.2016.09.175 - ,
Drop-in analysis of an internal heat exchanger in a vapour compression system using R1234ze(E) and R450A as alternatives for R134a ,Energy , Vol. 90 ,pp 1636–1644 , 2015, https://doi.org/https://doi.org/10.1016/j.energy.2015.06.133 - ,
Influence of operational modes of the internal heat exchanger in an experimental installation using R-450A and R-513A as replacement alternatives for R-134a ,Energy , Vol. 189 , 2019, https://doi.org/https://doi.org/10.1016/j.energy.2019.116348 - ,
Experimental evaluation of R448A as R404A lower-GWP alternative in refrigeration systems ,Energy Convers. Manag. , Vol. 105 ,pp 756–762 , 2015, https://doi.org/https://doi.org/10.1016/j.enconman.2015.08.034 - ,
Experimental drop-in replacement of R404A for warm countries using the low GWP mixtures R454C and R455A | Expérience sur le remplacement immédiat du R404A dans les pays chauds, en utilisant les mélanges R454C et R455A à faible GWP ,Int. J. Refrig. , Vol. 91 ,pp 136–145 , 2018, https://doi.org/https://doi.org/10.1016/j.ijrefrig.2018.05.018 - ,
Evaluation of suction-line/liquid-line heat exchange in the refrigeration cycle ,Int. J. Refrig. , Vol. 17 (7),pp 487–493 , 1994, https://doi.org/https://doi.org/10.1016/0140-7007(94)90010-8 - ,
A thermodynamic analysis of refrigerants: Performance limits of the vapor compression cycle ,Int. J. Refrig. , Vol. 38 (1),pp 71–79 , 2014, https://doi.org/https://doi.org/10.1016/j.ijrefrig.2013.09.036 - ,
A review on substitution strategy of non-ecological refrigerants from vapour compression-based refrigeration, air-conditioning and heat pump systems ,Int. J. Refrig. , Vol. 46 ,pp 123–141 , 2014, https://doi.org/https://doi.org/10.1016/j.ijrefrig.2014.04.023 - , , World GUIDE to Transcritical CO2 - Complete Report, 2020
- ,
Refrigerant options in the near future ,J. Sustain. Dev. Energy, Water Environ. Syst. , Vol. 7 (2),pp 293–304 , 2019, https://doi.org/https://doi.org/10.13044/j.sdewes.d6.0250 - ,
Performance and exergetic analysis of vapor compression refrigeration system with an internal heat exchanger using a hydrocarbon, isobutane (R600a) ,Int. J. Energy Res. , Vol. 32 ,pp 824–836 , 2008, https://doi.org/https://doi.org/10.1002/er.1396 - ,
Energy and exergy analysis of vapor compression refrigeration system using pure hydrocarbon refrigerants ,Int. J. Energy Res. , Vol. 33 ,pp 1070–1075 , 2009, https://doi.org/https://doi.org/10.1002/er.1538 - ,
Thermo-economic and environmental analysis of a small capacity vapor compression refrigeration system using R290, R1234yf, and R600a ,Int. J. Refrig. , Vol. 118 ,pp 250–260 , 2020, https://doi.org/https://doi.org/10.1016/j.ijrefrig.2020.07.003 - ,
Screening of working fluids for the ejector refrigeration system ,Int. J. Refrig. , Vol. 47 ,pp 1–14 , 2014, https://doi.org/https://doi.org/10.1016/J.IJREFRIG.2014.07.016 - ,
Theoretical investigation on the performance of an ejector enhanced refrigeration cycle using hydrocarbon mixture R290/R600a ,Appl. Therm. Eng. , Vol. 164 ,pp 114456 , 2020, https://doi.org/https://doi.org/10.1016/J.APPLTHERMALENG.2019.114456 - ,
Energy, exergy, and environmental (3e) analysis of hydrocarbons as low gwp alternatives to r134a in vapor compression refrigeration configurations ,Appl. Sci. , Vol. 11 (13), 2021, https://doi.org/https://doi.org/10.3390/app11136226 - ,
Experimental investigation on the performance and global environmental impact of a refrigeration system retrofitted with alternative refrigerants ,Int. J. Refrig. , Vol. 70 ,pp 119–127 , 2016, https://doi.org/https://doi.org/10.1016/J.IJREFRIG.2016.06.027 - ,
Optimization of a multistage vapor-compression refrigeration system for various refrigerants ,Appl. Therm. Eng. , Vol. 136 ,pp 84–96 , 2018, https://doi.org/https://doi.org/10.1016/J.APPLTHERMALENG.2018.02.071 - World Guide to Low-Charge Ammonia, 2019, https://ammonia21.com/world-guide-to-low-charge-ammonia/
- ,
Energy impact of the Internal Heat Exchanger in a horizontal freezing cabinet. Experimental evaluation with the R404A low-GWP alternatives R454C, R455A, R468A, R290 and R1270 ,Int. J. Refrig. , 2022, https://doi.org/https://doi.org/10.1016/J.IJREFRIG.2022.02.007 - ,
Performance analysis of a solar photovoltaic operated domestic refrigerator ,Appl. Energy , Vol. 86 (12),pp 2583–2591 , 2009, https://doi.org/https://doi.org/10.1016/j.apenergy.2009.04.037 - ,
Hourly simulation and performance of solar electric-vapor compression refrigeration system ,Sol. Energy , Vol. 85 (11),pp 2720–2731 , 2011, https://doi.org/https://doi.org/10.1016/J.SOLENER.2011.08.013 - ,
Comparative techno-economic assessment of a converted DC refrigerator and a conventional AC refrigerator both powered by solar PV ,Int. J. Refrig. , Vol. 72 ,pp 1–11 , 2016, https://doi.org/https://doi.org/10.1016/J.IJREFRIG.2016.08.014 - ,
Thermal control influence on energy efficiency in domestic refrigerator powered by photovoltaic ,Int. J. Hydrogen Energy , Vol. 42 (13),pp 8955–8961 , 2017, https://doi.org/https://doi.org/10.1016/j.ijhydene.2016.06.134 - ,
Experimental evaluation of photovoltaic DC refrigerator under different thermostat settings ,Renew. Energy , Vol. 113 ,pp 1150–1159 , 2017, https://doi.org/https://doi.org/10.1016/j.renene.2017.05.099 - ,
Experimental study of 12V and 24V photovoltaic DC refrigerator at different operating conditions ,Phys. B Condens. Matter , Vol. 545 (May),pp 237–244 , 2018, https://doi.org/https://doi.org/10.1016/j.physb.2018.06.027 - ,
Design and performance of a small-scale solar ice-maker based on a DC-freezer and an adaptive control unit ,Sol. Energy , Vol. 139 ,pp 433–443 , 2016, https://doi.org/https://doi.org/10.1016/J.SOLENER.2016.10.022 - ,
Performance prediction of a solar refrigeration system under various operating pressure of evaporator and condenser ,Sol. Energy , Vol. 209 ,pp 485–492 , 2020, https://doi.org/https://doi.org/10.1016/j.solener.2020.09.033 - ,
Modelling and performance analysis of directly coupled vapor compression solar refrigeration system ,Sol. Energy , Vol. 190 ,pp 228–238 , 2019, https://doi.org/https://doi.org/10.1016/J.SOLENER.2019.08.017 - ,
Dynamic simulation and experimental study of a variable speed photovoltaic DC refrigerator ,Renew. Energy , Vol. 152 ,pp 155–164 , 2020, https://doi.org/https://doi.org/10.1016/j.renene.2020.01.047 - ,
Preliminary investigation on pilot-scale photovoltaic-driven cold storage with ice thermal storage based on vapor compression refrigeration cycle ,Sustain. Energy Technol. Assessments , Vol. 45 , 2021, https://doi.org/https://doi.org/10.1016/j.seta.2021.101187 - ,
Techno-economic evaluation of a solar PV integrated refrigeration system for a cold storage facility ,Sustain. Energy Technol. Assessments , Vol. 44 , 2021, https://doi.org/https://doi.org/10.1016/j.seta.2021.101063 - ,
Performance analysis of solar milk refrigerator using energy efficient R290 ,Case Stud. Therm. Eng. , Vol. 24 ,pp 100855 , 2021, https://doi.org/https://doi.org/10.1016/j.csite.2021.100855 - , , Safety Standard for Refrigeration Systems and Designation and Classification of Refrigerants., 2019
- , 2016, https://www.danfoss.com/en/products/dcs/compressors/compressors-for-refrigeration/mobile-dc-cooling-compressors/#tab-overvie
- , , Industrial Refrigeration Handbook, 1st ed., 1998
- ,
Solar refrigeration options - a state-of-the-art review ,Int. J. Refrig. , Vol. 31 (1),pp 3–15 , 2008, https://doi.org/https://doi.org/10.1016/j.ijrefrig.2007.07.011 - ,
Performance Assessment of a Solar/Gas Driven NH3/LiNO3 Absorption Cooling System for Malls ,Lect. Notes Mech. Eng. ,pp 311–328 , 2023, https://doi.org/https://doi.org/10.1007/978-981-19-3467-4_19 - , 2020, http://www.ideam.gov.co/web/tiempo-y-clima/climatologico-mensual/-/document_library_display/xYvlPc4uxk1Y/view/112357178?_110_INSTANCE_xYvlPc4uxk1Y_redirect=http%3A%2F%2Fwww.ideam.gov.co%2Fweb%2Ftiempo-y-clima%2Fclimatologico-mensual%3Fp_p_id%3D110_INSTANC
- ,
Technical, environmental, and economic evaluation of a solar/gas driven absorption chiller for shopping malls in the Caribbean region of Colombia ,Case Stud. Therm. Eng. , Vol. 30 ,pp 101743 , 2022, https://doi.org/https://doi.org/10.1016/J.CSITE.2021.101743


