Energy comes in many forms: electrical, thermal, mechanical, sound, radiant, gravitational, motion, nuclear, and chemical. Electrical energy is the most convenient form for most sectors (residential, commercial, educational, institutional, and industrial buildings). Energy resources can be mainly categorised into renewable and non-renewable energy ones. Shifting to renewable energy (RE) is considered the best path toward a sustainable future since RE systems have a lot of gains, like inexhaustibility, less GHG emissions, and lower maintenance costs [1].
Exploiting waste heat improves the efficiencies of energy conversion systems. Fleurial [2] wrote in 2009 that one-third of the consumed energy in the factories is lost to heat the surrounding environment. For instance, the estimates of energy wasted as heat are ~3000 TWh/year in the United States (US) alone, ~11.4 TWh/year in the United Kingdom (UK) [3], and around 14.411 TWh/year in Australia [4]. Such a huge amount of wasted heat represents an important source of energy that could be recovered in different ways depending on the source temperature. One can exploit it to run a Stirling engine [5], in district heating systems [6], in cogeneration or combined heat and power (CHP) systems [7], or via a thermoelectric generation system [8]. The latter is discussed in this study in detail.
In 1821, the German physicist Seebeck revealed [9] that if heat flows through a thermoelectric material, a certain electric potential difference will occur through thermoelectric generation according to eq. (1) [10], [11]. Seebeck coefficient (α) measures the magnitude of this effect, and its unit is V/K [12]. The generated thermal electromotive force (ΔE) depends linearly on the temperature difference (ΔT) between the cold and hot sides of the thermoelectric generator (TEG) module, see eq. (1). Seebeck coefficient is a property of the type and the shape of the semiconductor material. The average value of α for the TEG module equals the difference between its values at the positive and negative material types [13].
(1)
TEG module consists of a hot plate, cold plate, and thermocouples that link the two plates. Thermocouples consist of positive legs (P-type) and negative legs (N-type). Thermocouples are thermally connected in parallel and electrically connected in series to improve the generated voltage from a TEG module,
As the sun rises in the early morning, the earth receives solar radiation that gradually intensifies towards midday when the sun reaches the highest point in the sky. This phenomenon increases the earth's surface temperature creating a natural temperature difference between the surface and the upper soil layers. Using the TEG modules, one can exploit this difference to generate a positive voltage. The generated voltage reaches its maximum positive values near midday when the highest temperature differences between the soil surface and upper soil layers occur.
In the afternoon, these temperature differences decline as the incoming solar radiation gradually decreases and the soil surface cools down. This trend continues until the evening hours when the temperature of soil layers becomes higher than that of the soil surface. This situation reverses the heat flow and the polarity of the generated voltage. The maximum negative voltage occurs near midnight when the highest values of the negative temperature differences between the soil surface and upper soil layers occur.
This study investigated exploiting soil depth thermal energy and transferring it to the soil surface to run thermoelectric generator modules and generate power. Gravity-assisted heat pipe filled with water was employed for this purpose. Different scenarios were studied, and their results were analysed considering three factors: heat pipe material, the existence of fins (at heat source and heat sink), and the surface area of fins. Two heat pipe materials under study were stainless steel and copper. Fin materials were copper at the heat source and aluminium at the heat sink. The dimensions of aluminium fins were 40 mm × 4 mm× 1 mm for each fin in the second scenario, but the fin width was ten times larger (40 mm instead of 4 mm) in the third scenario. The generated power was calculated, and characteristic features were identified for each scenario.
Wang et al. [14] simulated eight TEG modules (TEG-12708T237), a two-meter heat pipe buried in soil, two copper sleeves, and copper fins. The authors aimed to study if the generated power would be sufficient to power a Wireless Sensor Network system (WSN) in a forest environment. They claimed that their model could produce ~300 millivolts (mV) from a temperature difference of 20 °C across the TEG module, which is enough to power a WSN.
Pullwitt et al. [15] experimentally measured the temperature differences between the earth's surface and eight different depths in northern Germany. They concluded that the optimum soil depth for the highest temperature difference was 21.5 cm. Their experiment spanned one year using a PKE127A0020 TEG module with nine thermocouples. The addition of a capacitive energy storage system allowed the generated power to run WSN without additional energy sources. The authors also reported that the highest power generation was recorded during summer and the lowest during spring and autumn.
Whalen and Dykhuizen [16] examined the productivity of a Bismuth-Telluride (Bi2Te3) TEG module through a field experiment that lasted from June 2009 to May 2010 in the United States. Their system consisted of a hot plate, cold plate, thermopile, thermal insulator, and an environmental barrier. The TEG module was buried 1 cm under the earth's surface in the soil with 0.27 W/m K thermal conductivity. They revealed that the system's maximum generated power between March−May was 9.8 milliwatts (mW), and the lowest value was in November−January, with a yearly average value of 1.1 mW.
Ikeda et al. [17] proposed a system to generate 80 microwatts (μW) from a temperature difference of 3 °C. This power was used to drive a soil profile probe that monitors moisture distribution and temperature distribution at different soil depths. They filled a box with soil, thermally isolated it from the surroundings, and installed a KELKKTGM199-2 TEG module at its upper surface. A heat plate placed at the bottom of the box at a depth of 30 cm simulated the presence of a heat source. The heat was transmitted vertically from that place, through a 30 cm copper rod buried in the soil, to the TEG module at the box top.
Lukas et al. [18] experimented with steady-state conditions using a Thermalforce 241-150-29 TEG module to exploit the natural temperature difference between the earth's surface and 20 cm soil depth to power a WSN. From a 3.05 °C temperature difference across TEG module faces, the maximum generated power was 27 mW during daytime and 6.3 mW at night-time with an average value of 550 μW. The thermal resistance of the TEG module was 2.27 K/W, and the Seebeck coefficient was 0.111 V/K.
Anatychuk and Mikityuk [19] developed a system of eight TEG modules installed underground (5 with a rectangular shape and 3 with a cylindrical shape), thermopiles, heat removing radiator, and a heat flow-absorbing collector. The generated power from each TEG module was recorded individually. Among the rectangular TEG modules, the maximum power of 20 mW was generated from a module that has dimensions of 200 mm×200 mm×250 mm, while the minimum power of 5 mW was from a module that has dimensions of 85 mm×85 mm×200 mm. Among the cylindrical modules, the maximum power of 16 mW was generated from a module with dimensions of 200 mm×250 mm, while the minimum power of 5.5 mW was from a module with dimensions of 100 mm×250 mm. Their study spanned one year. The highest output power was obtained in March−April, while the lowest was between October−November.
Meydbray et al. [20] conducted a study in California in 2004 that spanned over 110 hours using a TEG module of 9.0 cm2 surface area. Three different scenarios were proposed. In the first scenario, the cold side of the TEG module was exposed to the open air. The second scenario included a 33 cm2 ceramic plate made from aluminium nitrate mounted on the exposed side of the TEG module. The plate was added to simulate the increase in surface area of the TEG module to enhance heat dissipation from the cold side of the module. In the third scenario, the area of the ceramic plate was increased to 131 cm2. The average values of the generated power in the three scenarios were 0.023 mW, 0.071 mW, and 0.575 mW, respectively. Thus, the power in the third scenario increased 25.2 times when the surface area was increased by 14.5 times compared with the first scenario.
Despite the research focus on thermoelectric generators, as demonstrated in the above literature review, most studies employed either a heat exchanger or only a radiator but not both. For instance, only radiators were employed in two field experiments by Zhang et al. [21], [22] using solar thermoelectric generator modules (STEG) and heat pipes. In contrast, Moser et al. [23] adopted a heat exchanger in a two-week experiment to exploit the natural temperature difference between a 1.1 km tunnel wall and the surrounding air. The anticipation is that using heat exchangers and radiators simultaneously would increase the temperature difference across TEG module faces and the generated power.
Our search indicated an apparent lack of studies on TEG systems in the Middle East (ME), particularly in Jordan. Thus, there is an urgent need to examine and explore the potential applications of such systems in our region. Hopefully, this study could establish a baseline for new renewable energy solutions that could be installed and studied more seriously in the ME region and Jordan.
The simulation in this study assumed the weather conditions of Jordan University of Science and Technology (JUST) located in Irbid city in the far north of Jordan (32°N, 37°E). The study aimed to investigate the potential of exploiting the natural temperature difference between the soil surface and upper soil layers to generate power via thermoelectric generator modules. Four different scenarios were examined using the simulation tool ANSYS FLUENT 19.2. Model drawings in all four scenarios were developed using FUSION 360 software before importing them to ANSYS FLUENT 19.2 to start the simulation.
In the Mesh section, model meshing was done. Different mesh types, like a triangle, quadrilateral, tetrahedron, pyramid, and hexahedron, can be applied to the model. Tetrahedron mesh was selected to achieve a high level of accuracy. Tetrahedron mesh divides the model into very small elements, thus achieving a high number of elements, therefore, a more accurate solution. On the other hand, the mesh should be finer (leading to a higher number of elements) at the sensitive regions, such as the boundaries or interface regions. In the Setup section, model surfaces are named by setting the proper initial conditions (see Table 1), and then, the simulation is started. The initial temperature of all model parts was set at 25.31 °C according to the ambient temperature at the earth's surface. Then the energy equation was activated to calculate the temperature distribution within the model.
The main input parameters of the model
Parameter |
Value |
|---|---|
Total length of the heat pipe |
40 cm |
Length of the heat pipe part buried in the soil |
30 cm |
Diameter of the heat pipe |
40 mm |
Temperature at the earth's surface* |
25.31 °C |
Temperature at 30 cm depth below the earth's surface* |
30.86 °C |
Wind speed near the earth's surface |
4.2 m/s |
at the specified location in July [24]
The convergence rate was determined as 1×10⁻³ for both the continuity and velocity equations and 1×10⁻⁶ for the energy equation. A reduced convergence rate in the energy equation was needed for a high degree of accuracy because the studied problem is sensitive to the temperature distribution, bearing in mind a small overall temperature difference of 5.55 °C between the soil surface and soil at 30 cm depth. The number of iterations was chosen to be 1000 because increasing this number also leads to improved solution accuracy. Finally, the CFD Post section was used to show and analyze the simulation results.
The temperature increases dramatically with the depth of the soil [25], which creates a temperature difference between the soil surface and the soil depth. The temperature difference between the soil surface and soil at 30 cm depth differs from season to season and from month to month. During the day, there are periods where the temperature of the soil surface is higher than the temperature of the soil at 30 cm depth below the earth's surface. Pedro et al. [26] considered this point and measured the temperature values at the soil surface and 30 cm soil depth in their system for one day. The measurements of the temperature profiles lasted for 24 hours on 21 July 2015, a sunny winter day in Campinas, Brazil. The results showed that the soil surface temperature was higher than the temperature at 30 cm soil depth during the period that extended from 6:30 a.m. to 17:00, a total of ten and half hours from the day length. In contrast, the temperature at 30 cm soil depth below the earth's surface is higher than the temperature of the soil surface during the period that extended from 17:00 to 6:30 a.m. the next day, a total of thirteen and half hours from the day length.
A case study on JUST campus weather conditions in July found a temperature difference value of 5.55 °C. It is the average value of temperature difference during the whole month. If the simulation was one day, for example, then fluctuating generated power during the day would occur. That would result from the change in the heat flow direction (upward or downward) during day and night, leading to a change in charge of the generated voltage (positive or negative). Since 5.55 °C represents the average temperature difference value between the soil surface and the soil at 30 cm depth below the earth's surface in the entire month of July, this research is content with calculating the generated power at this point. Table 2 shows the specifications of the applied Bismuth-Telluride TEG module.
The specifications for Bismuth-Telluride (Bi2Te3) TEG module [27]
Parameter |
Value |
|---|---|
Seebeck coefficient of the positive leg (αP) |
223.2×10⁻⁶ V/K |
Seebeck coefficient of the negative leg (αN) |
−187.7×10⁻⁶ V/K |
Dimensions of each TEG module |
40×40×1 mm |
Length of the legs (LP = LN) |
1.5 mm |
Cross-sectional area of the leg |
(1.3×1.3)×10-6 m2 |
Wind speed near the earth's surface |
4.2 m/s |
Electrical resistivity of the positive leg |
1.83×10⁻⁵ Ω·m |
Electrical resistivity of the negative leg |
1.53×10⁻⁵ Ω·m |
Specific heat capacity [28] |
165 J/kg K |
Thermal conductivity [28] |
2.11 W/m K |
Density |
7600 kg/m3 |
Figure 1 shows the power generation unit that consists of eight Bi2Te3 TEG modules; a 40 cm long gravity-assisted heat pipe of 40 mm diameter; a copper-finned heat exchanger; and anodised-aluminium-finned radiators. TEG modules (each of 40 mm in length, 40 mm in width, and 1 mm in thickness) were placed above the earth's surface. Their hot faces were attached to the outer heat-pipe surface. The modules' cold faces were either attached to the fins or exposed to the ambient (according to the scenario). The heat exchanger (five fins, each dimensioned 250 mm × 5 mm × 1 mm) was attached to the lower end of the heat pipe, buried in the soil. The heat pipe consists of three unmovable parts: 1) the evaporation section at the bottom end of the pipe, where heat is absorbed from the soil and used to raise the temperature of the water; 2) the condensation section at the top end of the pipe where the water temperature decreases due to releasing heat to the hot side of TEG module; 3) the adiabatic section, which connects the two previous sections.
Components of the power generation unit with the buried finned heat pipe [29]
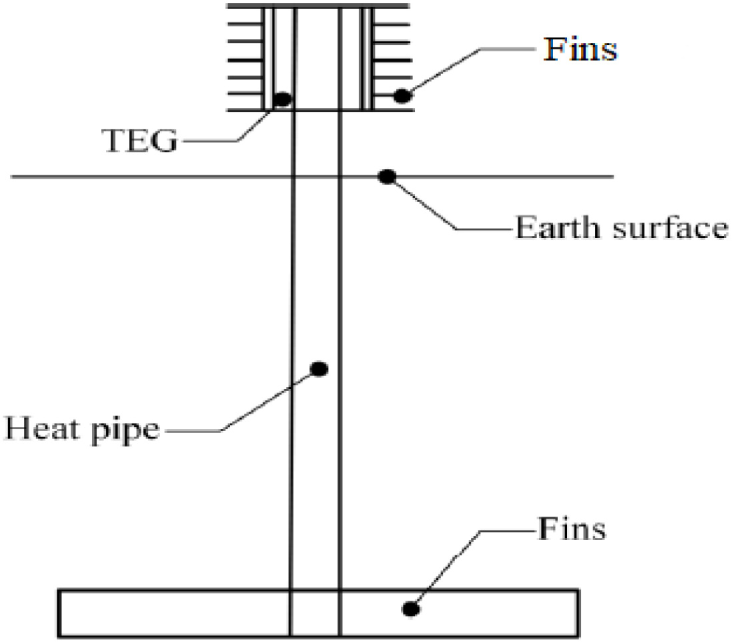
The copper fins with 400 W/m K thermal conductivity [30] enhance the heat extraction from the soil, while the aluminium fins with 0.82 emissivity value [31] enhance the heat dissipation from the TEG module cold side. In Appendix A, Table A-11 of [32], the emissivity values of the metallic solids were given. The emissivity values of anodised aluminium were only available at two temperature values: 0.82 at 300 K and 0.76 at 400 K. Since the temperature at the earth's surface in this study is equal to 25.31 °C (298.46 K), which can be approximated to 300 K, the emissivity value of 0.82 was adopted. Synchronization of copper fins at the heat source and anodised aluminium fins at the heat sink leads to an increased temperature difference between TEG modules' faces, thus generating power.
During the system operation, heat is transmitted with the help of the copper fins from the soil's upper layers to the water inside the evaporation section of the heat pipe. As a result, water temperature increases, creating a pressure difference between evaporation and condensation sections. This pressure difference pushes the hot water upward to the low-pressure section (condensation section), which loses its heat to the hot side of the TEG modules and cools. Water goes down because of gravity force to the evaporation section, absorbs heat from the surrounding soil, and repeats the cycle. Meanwhile, the induced temperature difference between the two sides of the TEG module generates small amounts of electricity.
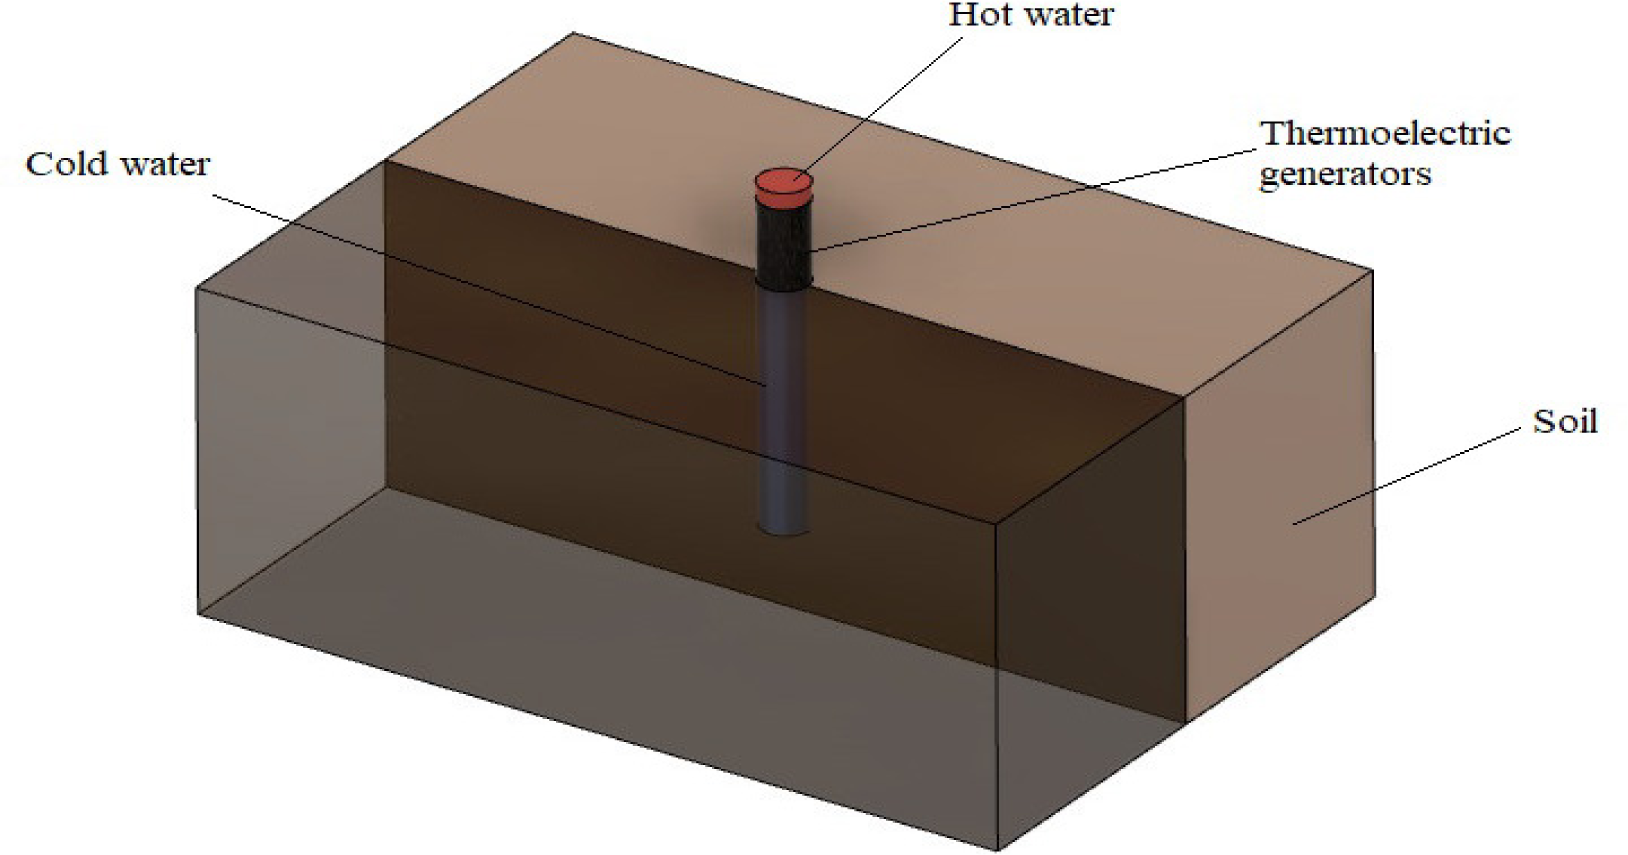
In this scenario, the heat pipe was made of stainless steel, and no fins were added at either the cold side of TEG modules (heat sink) or at the heat source at 30 cm soil depth (see Figure 2). The cold sides of the TEG modules ultimately lose their heat to the surrounding by both convection and radiation. The same model development, working principles, and simulation steps described before were followed to obtain the results.
The unfinned model with the buried and unburied parts of the heat pipe (first scenario)
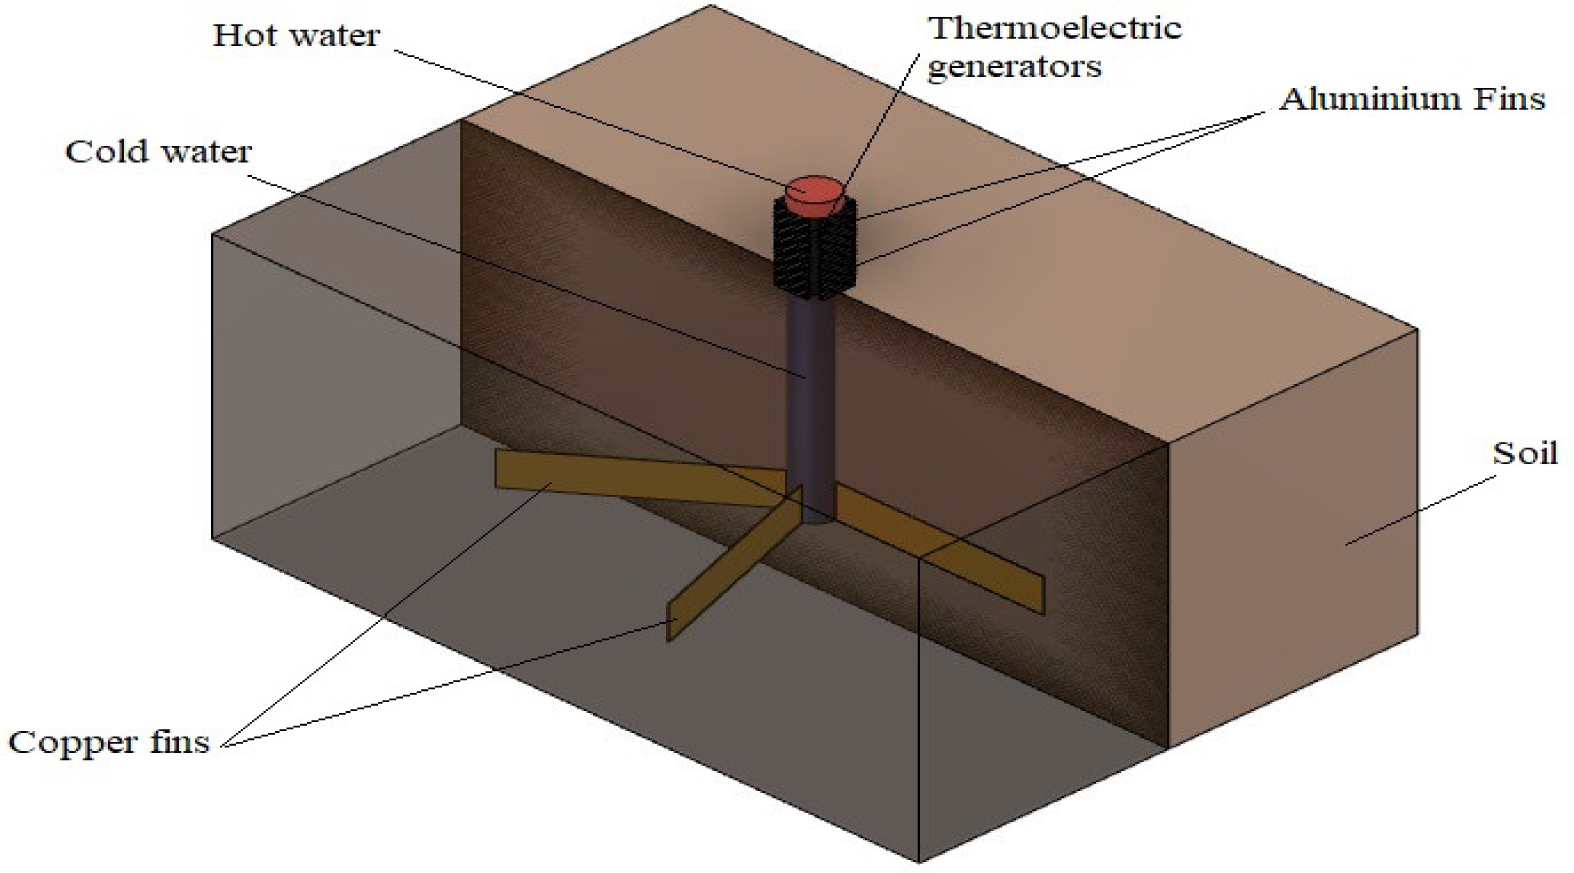
This scenario has the same model setup and heat pipe material as the first scenario; the only difference involves the addition of aluminium and copper fins. Straight aluminium fins, each dimensioned 40 mm × 4 mm × 1 mm, were added to dissipate heat from the cold sides of TEG modules. Five angular copper fins, each 250 mm × 50 mm × 1 mm, were added at 30 cm depth to enhance heat extraction from soil. Figure 3 shows the second scenario model.
The finned model with the buried and unburied parts of the heat pipe (second scenario)
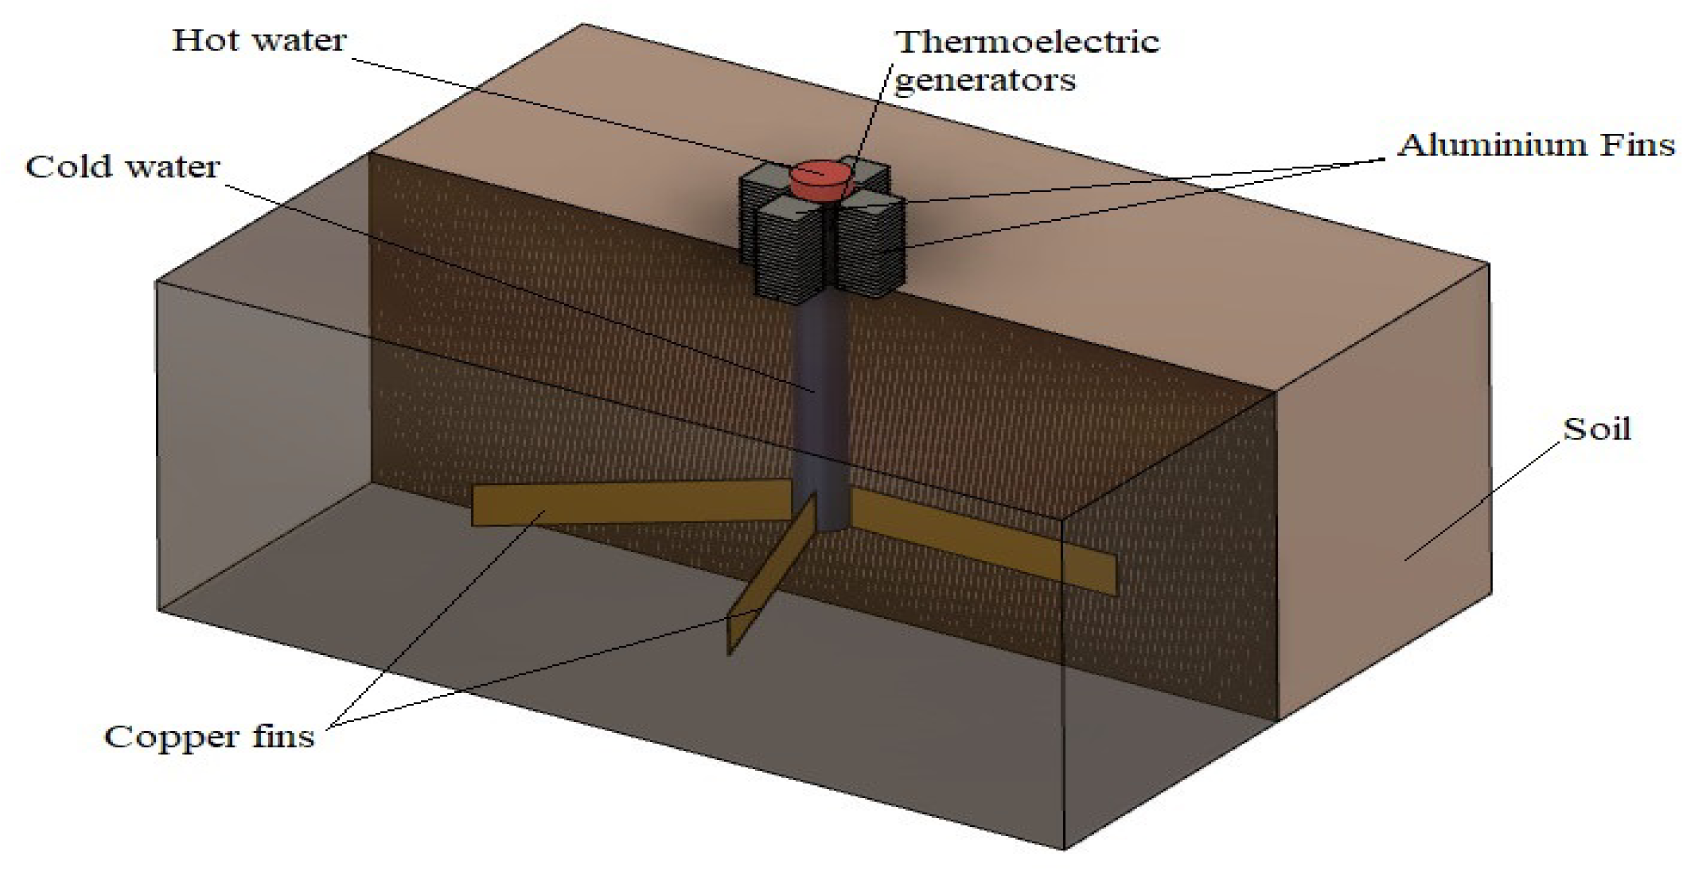
The third scenario has the same model setup and heat pipe material as the second scenario, with only one difference, which involved increasing the surface area of anodised aluminium fins ten times. Fin dimensions become 40 mm × 40 mm ×1 mm. The increase in the width of the aluminium fins is indicated clearly in Figure 4.
The fourth scenario evolved from the third scenario only by changing the material of the heat pipe from stainless steel to copper.
The finned model with the surface area of aluminium fins increased to 40 mm × 40 mm × 1 mm (third and fourth scenario)
The mathematical analysis in this study was based on the following assumptions:
No internal heat generation within the system.
No temperature variations at a given depth under the earth's surface (temperature distribution at any given soil depth was assumed homogenous).
Steady-state three-dimensional (3D) heat transfer.
The effect of gravity force was considered.
The temperature effect on the TEG module properties was neglected (physical and thermal properties of TEG modules assumed constant).
TEG units were thermally connected in series while electrically connected in parallel.
To the authors' knowledge, a mathematical equation which could calculate the temperature distribution in the soil surrounding the finned heat pipe is not yet available [33]. Therefore, the finned heat pipe model was assumed as a cylinder to simplify numerical calculations. The differential equation that describes heat conduction in cylindrical coordinates (r, θ, z) is given as:
(2)
where ρ is soil density, c is soil-specific heat, T is soil temperature, λ is soil thermal conductivity, τ is the time, and qvis the heat per unit volume in unit time generated in the soil.
The simulated results obtained using ANSYS FLUENT for the four scenarios will be presented. The results mainly include parameters such as the temperature distribution within the model parts, generated power, and temperature differences between TEG module faces.
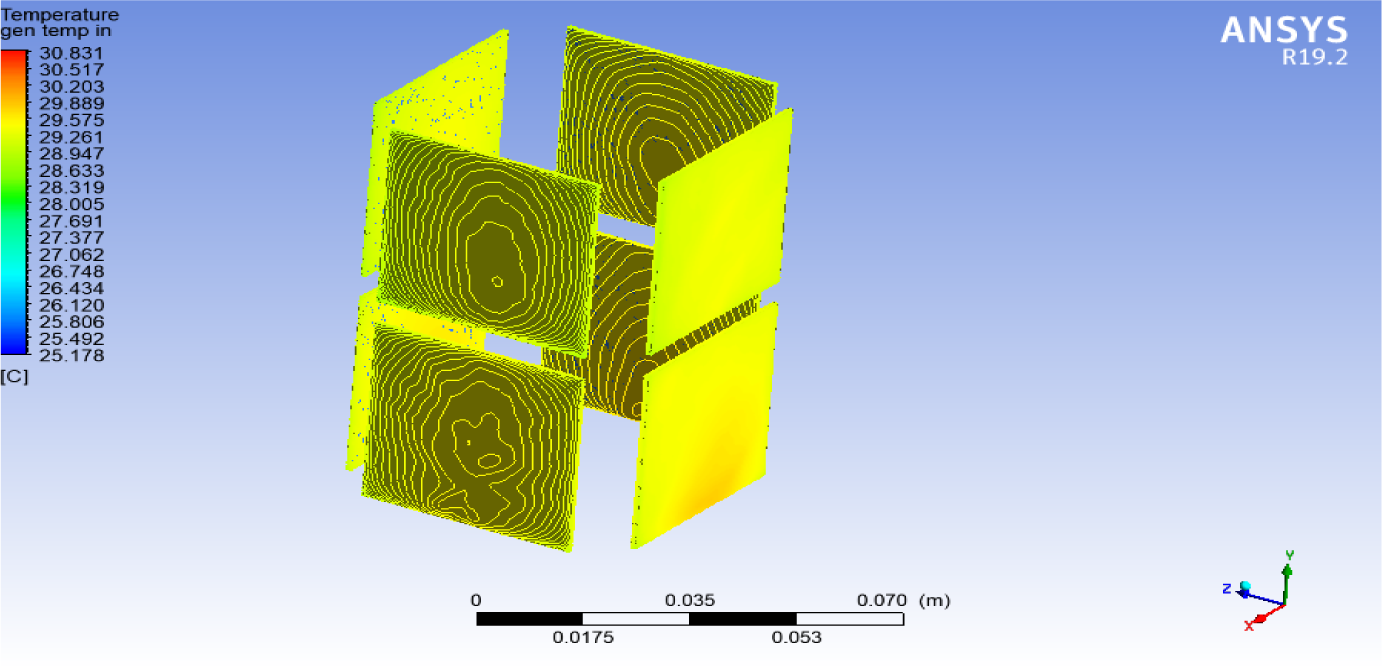
Figure 5 shows the distribution of temperature across the faces of TEG modules. The temperature distribution across each face was non-homogeneous and varied across the same face − more noticeably in the vertical direction. Moreover, the temperature distributions differed slightly between the adjacent TEG module faces but more significantly between the faces of the TEG modules above one another. This effect can be attributed to the location of each TEG module along the vertical direction concerning the ground. The closer to the ground the TEG module is, the higher the temperature. The number of contours that showed the temperature distribution at TEG modules was 1000.
Temperature distribution across the TEG modules (first scenario)
Since ANSYS offers no option to calculate the average temperature across each module face while manually calculating it would require summing a large number of readings, another approach was adopted. Six planes (three XY-planes and three YZ-planes) positioned vertically to the earth's surface were drawn to intersect with the eight TEG modules, as illustrated in Figure 6. An XY-plane is a plane positioned parallel to the plane defined by X and Y coordinate axes. (In other words, a curve or a two-dimensional distribution in any XY-plane can be analysed in the X and Y coordinates.) Analogously, a YZ-plane is a plane positioned parallel to the plane defined by the Y and Z coordinate axes. The attention is restricted to vertical planes and avoids using horizontal planes because, as mentioned before, the changes in temperature values in the vertical direction are noticeable, while in the horizontal direction are not.
Top view of six planes intersecting with eight TEG modules (first scenario)
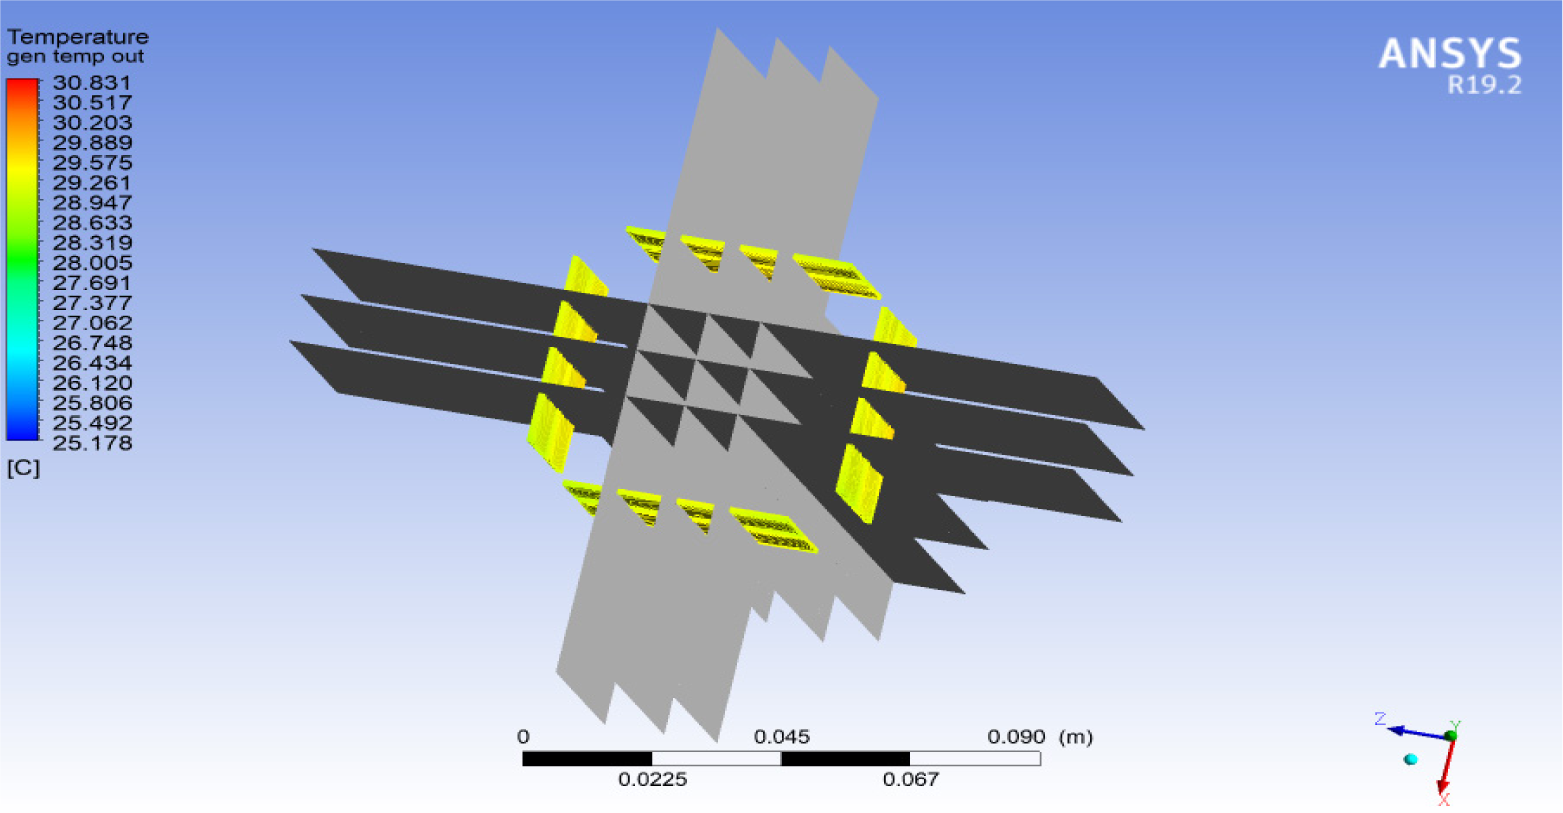
Each plane intersects with four opposite TEG modules at certain locations. Among the three planes positioned parallel to the XY plane, XY-plane 1 intersects with four TEG modules in lines 1 cm away from the right edge of the TEG modules. The XY-plane 2 intersects with the same four TEG modules in lines 2 cm away from the right edge of these modules (at the centrelines of the TEG modules). Finally, XY-plane 3 intersects with the same TEG modules in lines 3 cm away from the right edge of these modules. Analogous intersections appear in the three YZ-planes numbered 4, 5, and 6. While the three XY-planes intersect with the four TEG modules whose projected contours (compare Figure 1) are visible in X and Y coordinates, the three YZ-planes intersect with the other four TEG modules whose projected contours are visible in Y and Z coordinates.
Side view of the green lines on the internal/external faces of the TEG modules, representing the intersections between the drawn planes and the TEG modules (first scenario)
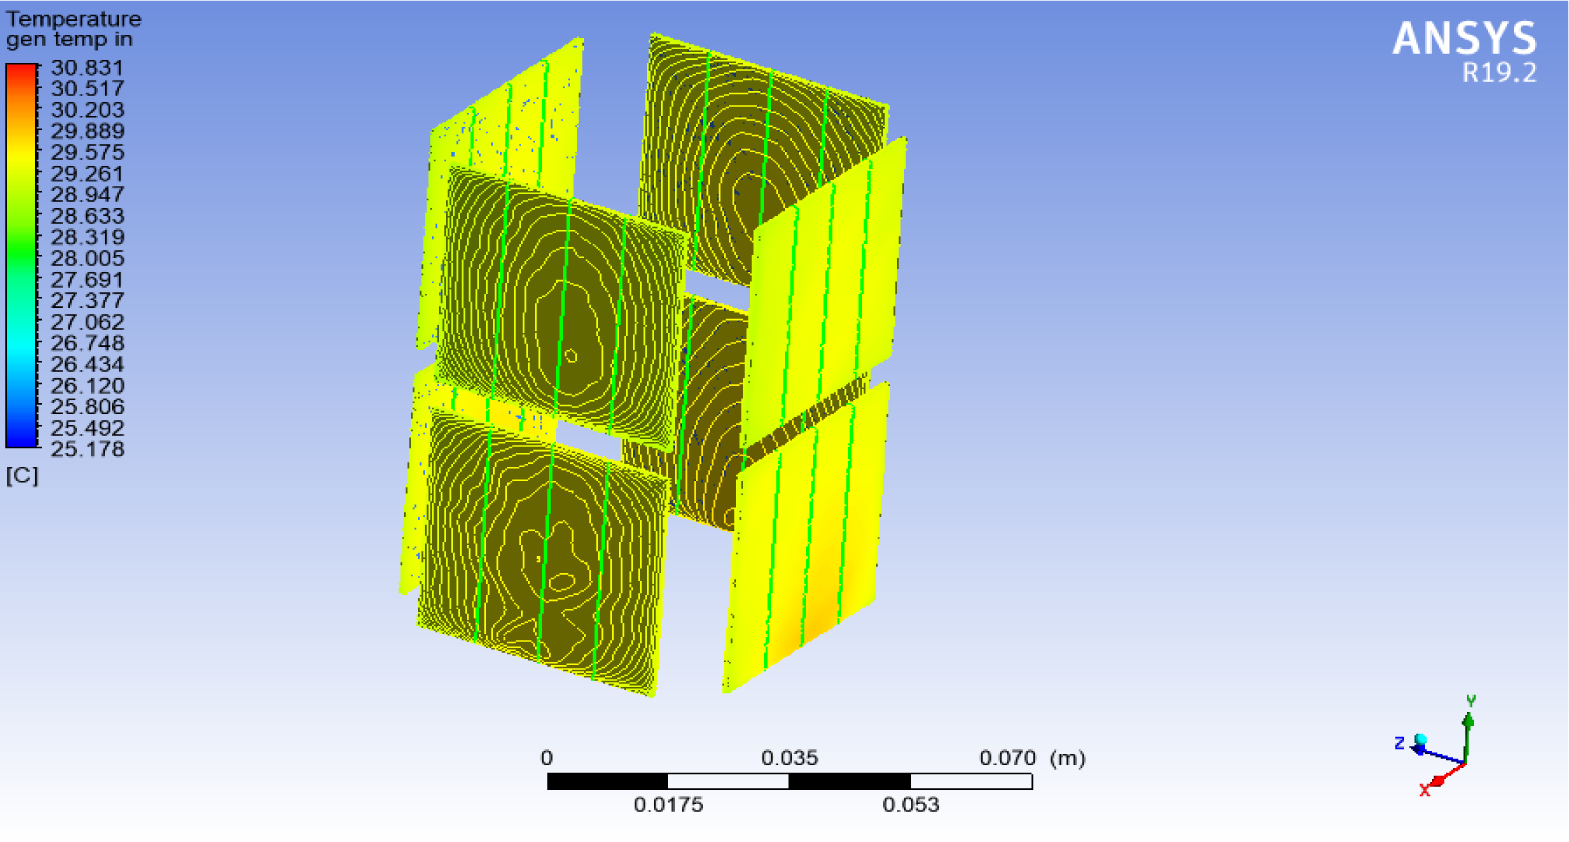
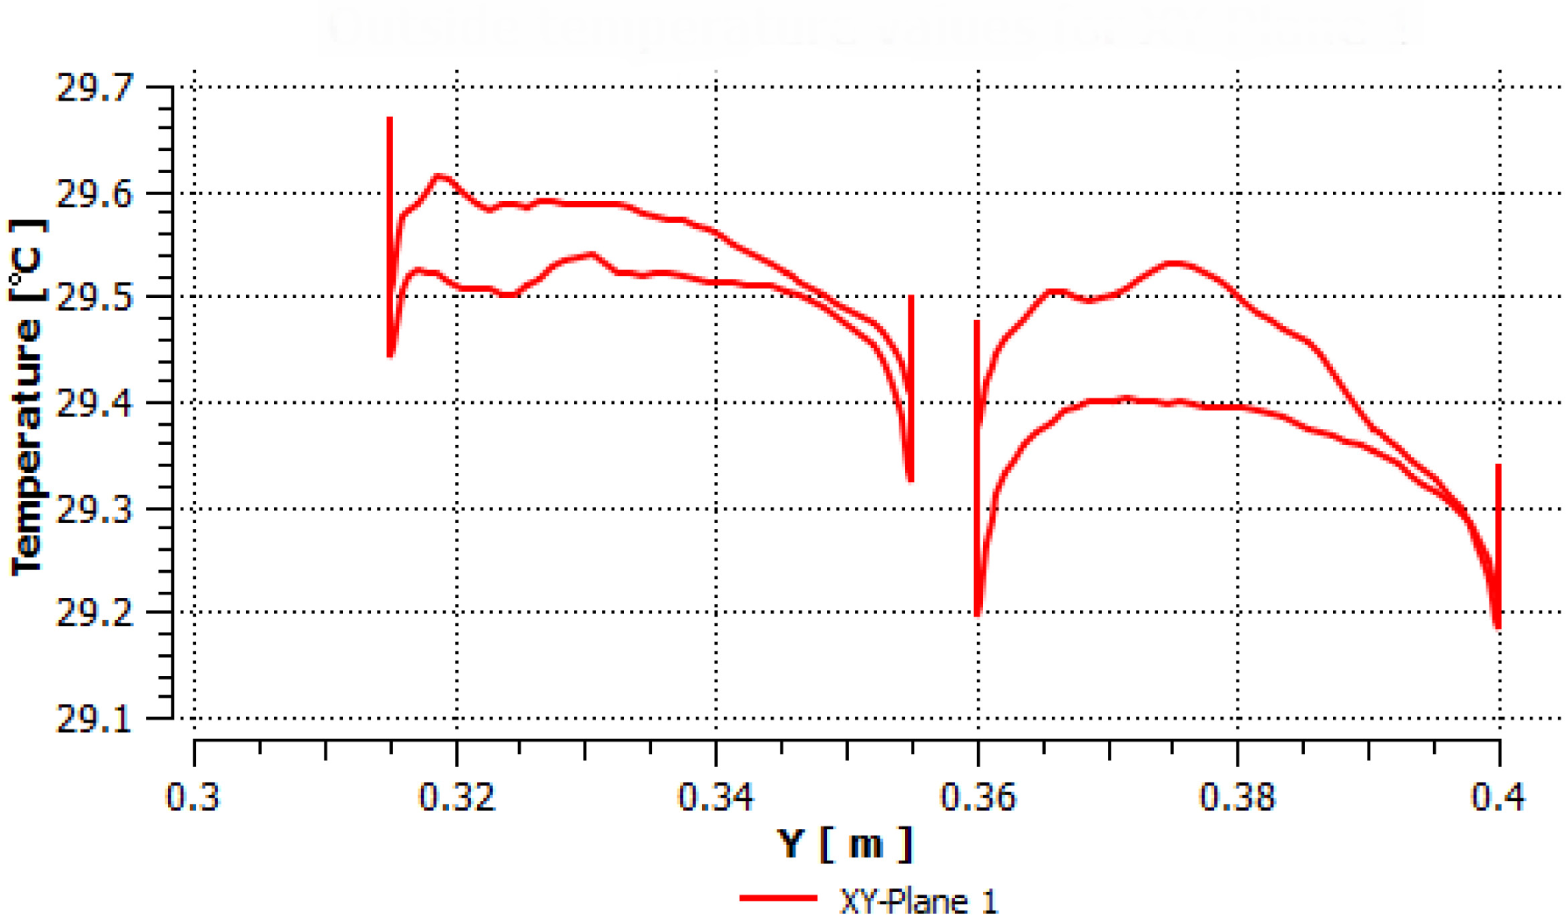
The intersection between the six planes and TEG modules formed three longitudinal green lines on each TEG face (external and internal), as Figure 7 shows. Each plane intersected with four TEG modules, thus forming eight lines (green colour, a line on the external face and another line on the internal face of each TEG). The temperature values in the points positioned along each vertical green line were read through an option from the ANSYS CFD Post section and plotted as shown in Figure 8 and Figure 9. The horizontal axis in these figures represents the height above the end of the buried part, which is at 30 cm depth below the soil surface. It is worth noting that these two figures describe temperature distribution only along the eight green lines (four on the external face and four on the internal inner face of the TEG) created by XY-plane 1. Similar patterns apply to the green lines that belong to the other five planes.
Temperature distribution along the vertical green lines drawn on the internal faces of TEG modules as a result of the intersections with XY-plane 1 (first scenario)
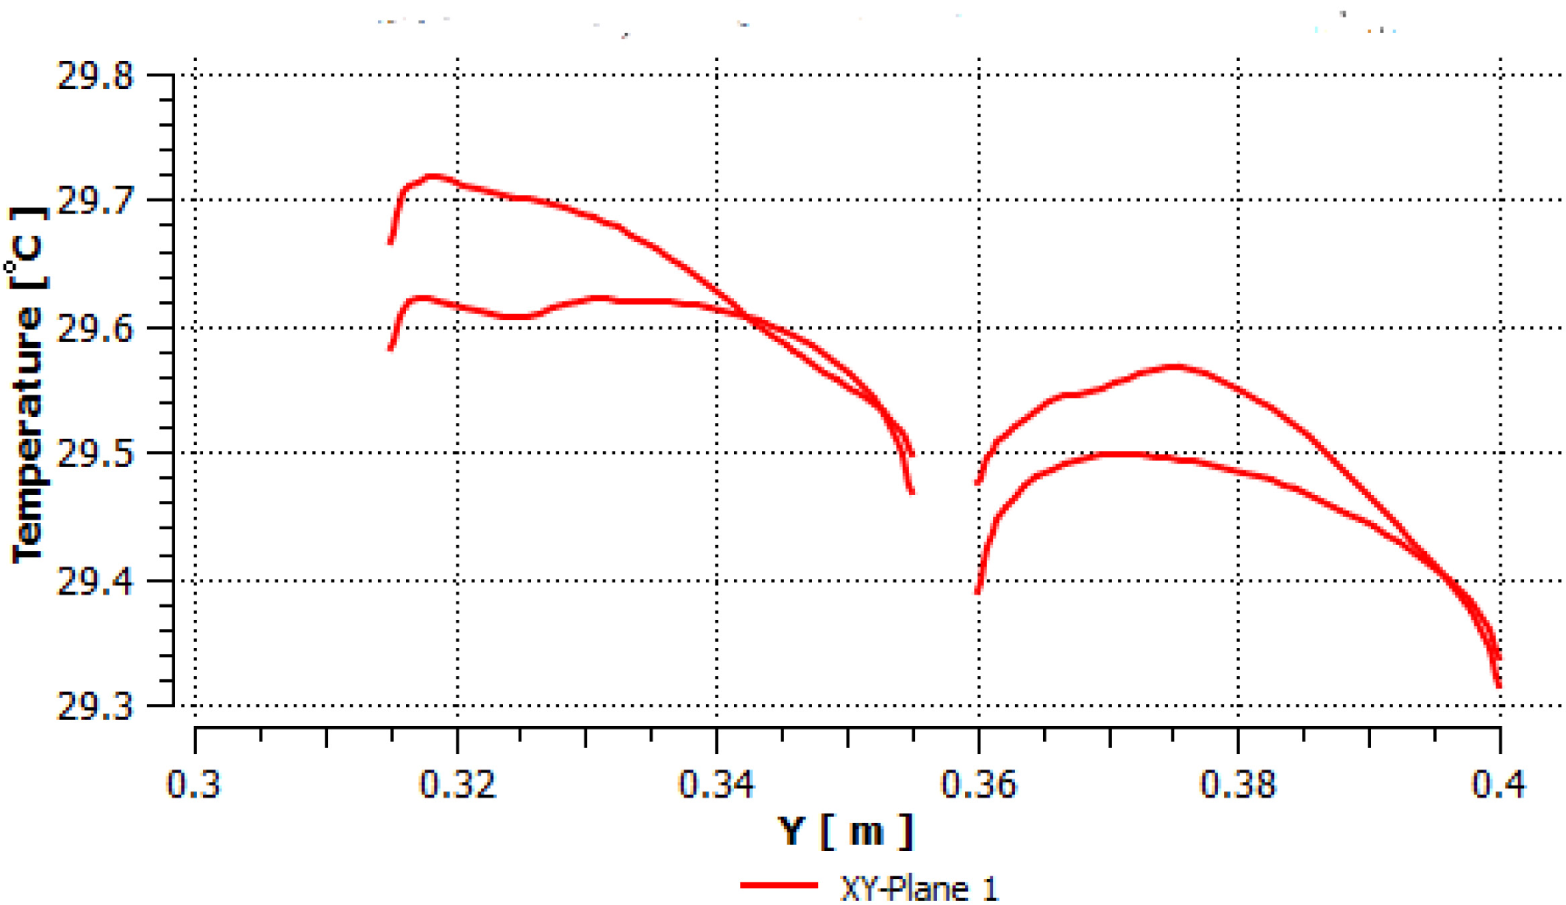
Figure 8 describes the temperature along the four green lines drawn by XY-plane 1 on the internal faces of the four TEG modules (two pairs of modules, one under the other in each pair). In Figure 8, the red curves on the left represent the two lower TEG modules, while the red curves on the right represent the two upper TEG modules.
For example, the inside temperature of the upper TEG modules varies from 29.32 °C to 29.5 °C for one of them and from 29.34 °C to 29.56 °C for the other. However, a close look at the two lower TEG modules and their corresponding red curves reveals that temperature values vary from 29.46 °C to 29.62 °C for one of them and from 29.50 °C to 29.72 °C for the other. The temperature values at the lower TEG modules are slightly higher than the upper ones since they are closer to the ground, so thermal energy travels less distance through the heat pipe to reach the bottom TEG modules.
Similarly, Figure 9 describes the temperature along the four green lines drawn on the outer faces of the four TEG modules (again, two pairs of modules). The outside temperature of the upper TEG modules ranges between 29.18 °C and 29.40 °C for one of them and 29.18−29.52 °C for the other. The temperature of the lower TEG modules varies from 29.32 °C to 29.54 °C for one of them and 29.18−29.61 °C for the other.
The temperature values along each red curve in both figures were averaged to obtain only eight temperature values (one corresponding to each red curve).
Temperature distribution along the vertical green lines drawn on the outer faces of TEG modules as a result of the intersections with XY-plane 1 (first scenario)
The same steps were implemented for the other five planes, where eight temperature values were obtained from each plane. Table 3 gives detailed data on the average temperature values on all green lines shown in Figure 7 (24 external and 24 internal). Four values of temperature difference resulted from eight temperature readings at each plane. Since there are six planes in the model, 48 temperature readings and 24 temperature differences were obtained.
Temperature readings and calculated temperature differences at the eight TEG modules: the first scenario
Plane |
Inside temperature values [°C] |
Outside temperature values [°C] |
Temperature difference [°C] |
Average temp. diff. [°C] |
|---|---|---|---|---|
1 |
29.28, 29.36, 29.44, 29.49 |
29.14, 29.21, 29.33, 29.34 |
0.14, 0.15, 0.11, 0.15 |
0.14 |
2 |
29.40, 29.46, 29.54, 29.61 |
29.29, 29.36, 29.43, 29.47 |
0.11, 0.10, 0.11, 0.14 |
0.12 |
3 |
29.34, 29.38, 29.49, 29.49 |
29.21, 29.25, 29.36, 29.38 |
0.13, 0.13, 0.13, 0.11 |
0.12 |
4 |
29.35, 29.38, 29.53, 29.59 |
29.25, 29.29, 29.41, 29.50 |
0.10, 0.09, 0.12, 0.09 |
0.10 |
5 |
29.36, 29.44, 29.58, 29.67 |
29.27, 29.33, 29.45, 29.53 |
0.09, 0.11, 0.13, 0.14 |
0.12 |
6 |
29.27, 29.37, 29.44, 29.51 |
29.17, 29.26, 29.37, 29.40 |
0.10, 0.11, 0.07, 0.11 |
0.10 |
Arithmetic means of each plane's four temperature difference values were calculated to obtain the average value representing the plane under consideration. Consequently, six average temperature difference values – one for each plane – were obtained, as shown in the final column in Table 3. The ultimate average temperature difference (ΔTavg)) representing the whole system was found by averaging those six average temperature difference values. ΔTavg is 0.12 °C in this scenario.
One can calculate the resistance of the TEG module (Rteg)) from the equation below:
(3)
where σ P is the electrical conductivity (inverse of the electrical resistivity) of the TEG positive leg (54644.8 S/m), σN – electrical conductivity of the TEG negative leg (65359.5 S/m), while AP = AN = 0.00000169 m2 and LP = LN = 0.0015 m.
The steps followed to calculate the generated power were: 1) averaging the temperature distribution at each green line, 2) calculating the temperature difference between each internal green line and the corresponding external green line on the same face, 3) averaging all temperature differences calculated in step 2 to obtain ΔTavg,, and finally, 4) calculating the power. Therefore, Rteg calculated from eq. (3) was 3.787 Ω. The generated power was 21.21 μW from each TEG module and 169.69 μW from the total system (eight TEG modules).
The main feature of this scenario was that fins were added to both TEG modules and the heat pipe. A more detailed view of temperature distribution on both faces of each TEG module is shown in Figure 10, in which the colour reflects the cooling effect of aluminium fins.
Temperature distribution across the TEG module faces (second scenario)
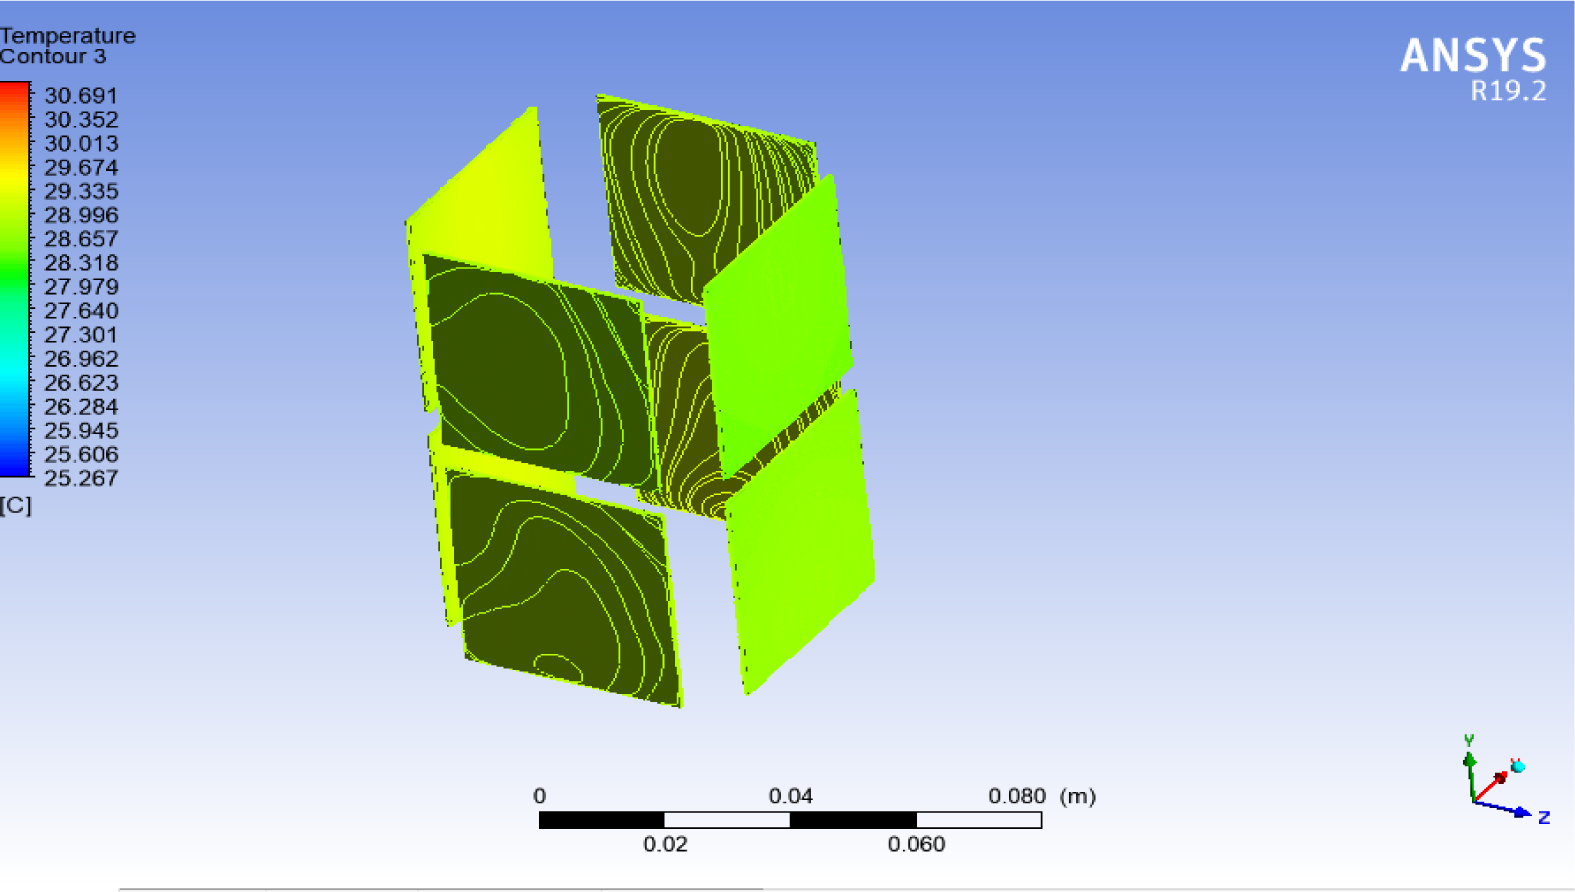
One can see from Figure 10 that the values of temperature at both faces of TEG modules are slightly lower than those recorded in the first scenario, as indicated by the colours of the TEG modules. The yellow colour tends to be bright yellow in the first scenario, but here, it changes to green. The temperature drop is attributed to the aluminium fins, which enhance heat dissipation (cooling) from the cold sides of TEG modules. The number of contours that showed the temperature distribution at TEG modules was 1000.
This scenario adopted the same approach as the first scenario: drawing intersecting planes and following the necessary steps to calculate the ultimate average temperature difference value. It is 0.25 °C in this scenario. The generated power here was 46.1 μW from each TEG module and 368.8 μW from the eight TEG modules, which is about 2.17 times higher than it was in the first scenario.
The higher generated power resulted from adding the copper fins at the lower end of the heat pipe at 30 cm soil depth and the aluminium fins at the cold side of TEG modules at the top end of the heat pipe. Fins increase the surface area through which heat is exchanged with the surrounding media, thus enhancing the heat transfer rate (absorbing heat from the soil and dissipating heat from TEG modules). Moreover, synchronizing these two types of fins further boosted the temperature difference between the faces of TEG modules.
This scenario differs from the second scenario in that the surface area of the aluminium fins (the radiator) was increased ten times by increasing their width. Thus the surface area of each Al fin (here dimensioned 40 mm ×40 mm ×1 mm) increased while the surface area of copper fins remained as it was in the second scenario. Figure 11 depicts the temperature distribution on both faces of TEG modules.
Temperature distribution across the TEG module faces (third scenario)
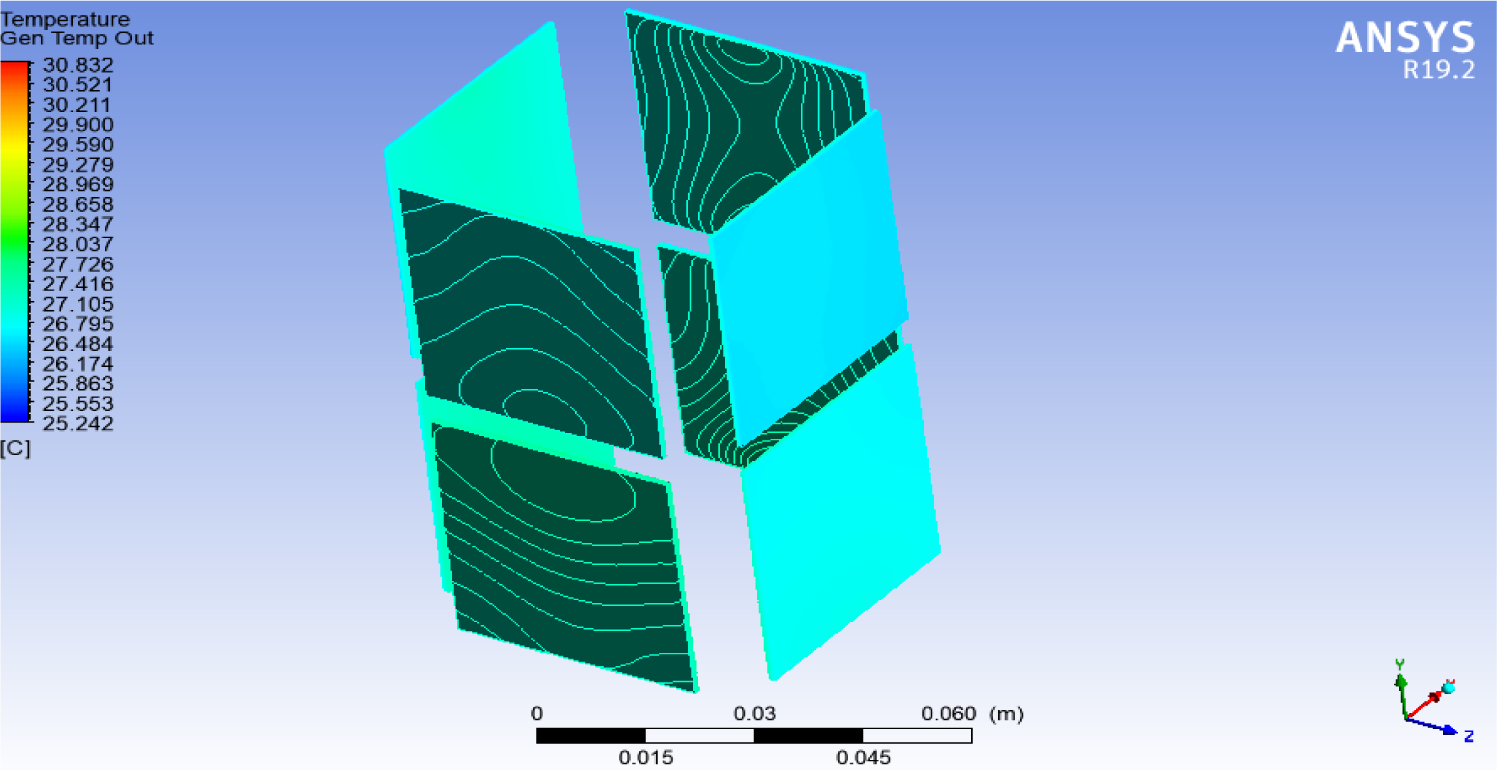
It is obvious from the colours (greenish-blue) implying the lower temperature values of the TEG modules that the increased surface area of Al fins boosted heat dissipation from the cold side of TEG modules. One should note that the lower temperature values of TEG modules (compared with previous scenarios) do not necessarily mean less generated power because the generated power depends on the temperature difference between a TEG module's inner and outer faces. Nonetheless, temperature values should be within the operating limits of each module, determined by the supplier and found in the TEG modules' datasheets. The number of contours that showed the temperature distribution at TEG modules was 1000.
Again, the same approach used in previous scenarios was adopted in this scenario: drawing intersecting planes and following the necessary steps to calculate the temperature difference. The ultimate average temperature difference in this scenario is 0.54 °C. The generated power was 99.71 μW from each TEG module and 797.68 μW from the eight TEG modules, which is about 2.16 times higher than it was in the second scenario and about 4.7 times higher than it was in the first scenario. The increase in the generated power compared to the second scenario was due to increasing the surface area of the Al fins attached to the cold side of TEG modules.
In this scenario, a copper heat pipe was used instead of the stainless-steel heat pipe used in the previous three scenarios. Other than the material of the heat pipe, all settings and specifications remained as they were in the third scenario. The temperature distribution on both faces of TEG modules is illustrated in Figure 12.
Temperature distribution across faces of the TEG modules (fourth scenario)
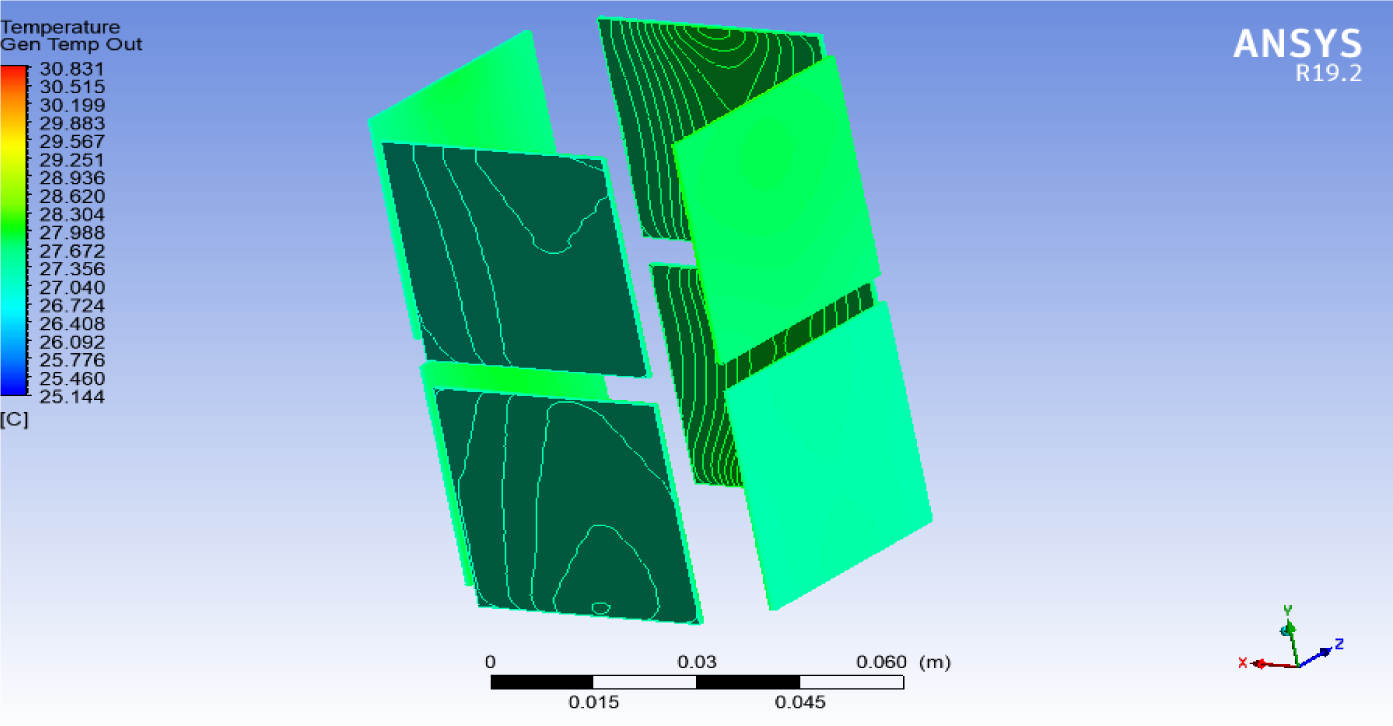
The colours (light green) indicate that the temperature values were slightly higher than in the case of the third scenario but lower than those of the second scenario. The reason is the higher thermal conductivity of the copper heat pipe applied here. Again, it should be emphasised that the generated power depends on the temperature difference between a TEG module's inner and outer faces, not on temperature values. The number of contours that showed the temperature distribution at TEG modules was 1000.
Similar to the previous scenarios, the necessary steps were followed after drawing the intersecting planes to calculate the ultimate average temperature difference. Its value obtained in this scenario is 0.67 °C. The generated power was 124.1 μW from each TEG module and 992.8 μW from the eight TEG modules. The generated power in this scenario was about 1.25 times that generated in the third scenario, 2.7 times that in the second scenario, but about 5.85 times the generated power in the first scenario.
As indicated by the results, the generated power in this scenario was the highest among all four scenarios. This situation was mainly due to the high thermal conductivity of the copper heat pipe and the effects of the copper and aluminium fins. All these factors significantly enhanced the heat transfer processes, including heat absorption from the soil and heat dissipation to the atmosphere. That led to increasing the temperature difference between the two faces of TEG modules.
This study investigated the generated power from the natural temperature difference between the soil surface and 30 cm soil depth at a location near JUST. The results revealed that the generated power from the system increased from 169.68 μW in the first scenario to 368.68 μW in the second scenario. However, in the third and fourth scenarios, the generate d power reached about 797.68 μW and 1 mW, respectively. No similar studies or projects were implemented in Jordan, so it is encouraged to adopt the system and consider it seriously. Thermoelectric systems offer promising potential as a new technology that generates renewable energy for low-power applications, especially in remote areas in Jordan far from the power grid. One can utilise these systems in indoor and outdoor applications in such areas, including wireless sensor networks, medical devices, micro-generators, transmitters, rectifiers, soil profile probes, and consumer electronics. Though, some challenges, like the low conversion efficiencies of TEG modules, still need development.
AN |
cross-sectional area of the negative type leg of a TEG |
[m2] |
AP |
cross-sectional area of the positive type leg of a TEG |
[m2] |
c |
soil specific heat |
[kJ/kg K] |
LN |
length of the negative leg |
[m], [mm] |
LP |
length of the positive leg |
[m], [mm] |
N |
number of thermocouple pairs in TEG module |
[-] |
qv |
heat generated in the soil per unit volume in unit time |
[W/m3] |
Rteg |
electrical resistance of the TEG module |
[Ω] |
T |
soil temperature |
[°C] |
Greek letters
𝛼 |
Seebeck coefficient for the TEG module |
[μV/K] |
𝛼N |
Seebeck coefficient for the positive leg |
[μV/K] |
𝛼P |
Seebeck coefficient for the negative leg |
[μV/K] |
ΔE |
thermal electromotive force |
[μV] |
ΔT |
temperature difference between TEG module faces |
[°C] |
ΔTavg |
ultimate temperature difference that represents eight TEG modules |
[°C] |
λ |
soil thermal conductivity |
[W/m K] |
𝜌 |
soil density |
[kg/m3] |
σN |
electrical conductivity of the negative type of TEG leg |
[S/m] |
σP |
electrical conductivity of the positive type of TEG leg |
[S/m] |
τ |
time |
[s] |
Abbreviations
RE |
Renewable Energy |
GHG |
Greenhouse Gases |
CHP |
Combined Heat and Power |
TEG |
Thermoelectric Generator |
WSN |
Wireless Sensor Networks |
STEG |
Solar Thermoelectric Generator |
ME |
Middle East |
JUST |
Jordan University of Science & Technology |
- ,
Technical, Economic, and Environmental Assessment of Integrating Solar Thermal Systems in Existing District Heating Systems under Jordanian Climatic Conditions. Journal of Sustainable Development of Energy, Water and Environment Systems , Vol. 70 (40),pp 55 , 2022, https://doi.org/https://doi.org/10.13044/j.sdewes.d9.0395 - ,
Thermoelectric power generation materials: Technology and application opportunities ,Journal of Minerals, Metals & Materials Society , Vol. 61 (4),pp 79-85 , 2009, https://doi.org/https://doi.org/10.1007/s11837-009-0057-z - ,
Opportunities for low-grade heat recovery in the UK food processing industry ,Applied Thermal Engineering , Vol. 53 (2),pp 188-196 , 2013, https://doi.org/https://doi.org/10.1016/j.applthermaleng.2012.03.024 - , IEA, Renewable Information, Paris: OECD Publishing/International Energy Agency, 2011
- ,
Optimization and application of Stirling engine for waste heat recovery from a heavy-duty truck engine ,Energy conversion and management , Vol. 180 ,pp 411-424 , 2019, https://doi.org/https://doi.org/10.1016/j.enconman.2018.10.096 - ,
Analysis of a district heating system using waste heat in a distributed cooling data centre ,Applied Thermal Engineering , Vol. 141 ,pp 1131-1140 , 2018, https://doi.org/https://doi.org/10.1016/j.applthermaleng.2018.06.036 - ,
A novel mechanism for exhaust steam waste heat recovery in combined heat and power unit ,Applied Energy , Vol. 204 ,pp 596-606 , 2017, https://doi.org/https://doi.org/10.1016/j.apenergy.2017.07.068 - ,
High-performance self-powered wireless sensor node driven by a flexible thermoelectric generator ,Energy , Vol. 162 ,pp 526-533 , 2018, https://doi.org/https://doi.org/10.1016/j.energy.2018.08.064 - , Thermoelectric Power Generation from Waste Heat, in Handbook of Ecomaterials, L.M.T. Martínez, O.V. Kharissova, and B.I. Kharisov, Editors, 2019
- , CRC handbook of thermoelectrics, 2018
- , Performance measurement and analysis of a thermoelectric power generator, 12th IEEE Intersociety Conference on Thermal and Thermomechanical Phenomena in Electronic Systems, 2010
- ,
A review on thermoelectric renewable energy: Principle parameters that affect their performance ,Renewable and Sustainable Energy Reviews , Vol. 30 ,pp 337-355 , 2014, https://doi.org/https://doi.org/10.1016/j.rser.2013.10.027 - ,
A comprehensive analysis of the performance of thermoelectric generators with constant and variable properties ,Applied Energy , Vol. 241 ,pp 11-24 , 2019, https://doi.org/https://doi.org/10.1016/j.apenergy.2019.02.083 - ,
Feasibility study of a new thermoelectric conversion device utilizing the temperature differences in forest soil ,Acta Tech CSAV (Ceskoslovensk Akad Ved) , Vol. 6 ,pp 1-12 , 2017 - , A feasibility study on energy harvesting from soil temperature differences, Proceedings of the 7th International Workshop on Real-World Embedded Wireless Systems and Networks, 2018
- ,
Thermoelectric energy harvesting from diurnal heat flow in the upper soil layer ,Energy conversion and management , Vol. 64 ,pp 397-402 , 2012, https://doi.org/https://doi.org/10.1016/j.enconman.2012.06.015 - , Ground Temperature Difference Driven Sensor for Environmental Monitoring, Proceedings of the 2018 ACM International Joint Conference and 2018 International Symposium on Pervasive and Ubiquitous Computing and Wearable Computers, 2018
- ,
Thermoelectric Energy Harvesting from Gradients in the Earth Surface ,IEEE Transactions on Industrial Electronics , Vol. 67 (1),pp 9460-9470 , 2019, https://doi.org/https://doi.org/10.1109/TIE.2019.2952796 - , Thermal generators using heat flows in soils, in Proceedings ICT'03. 22nd International Conference on Thermoelectrics (IEEE Cat. No. 03TH8726), 2003
- , Thermoelectric module construction for low temperature gradient power generation, 24th International Conference on Thermoelectrics, 2005
- ,
Theoretical and experimental analysis of a solar thermoelectric power generation device based on gravity-assisted heat pipes and solar irradiation ,Energy conversion and management , Vol. 127 ,pp 301-311 , 2016, https://doi.org/https://doi.org/10.1016/j.enconman.2016.09.023 - ,
Behavior of a thermoelectric power generation device based on solar irradiation and the earth’s surface-air temperature difference ,Energy Conversion and management , Vol. 97 ,pp 178-187 , 2015, https://doi.org/https://doi.org/10.1016/j.enconman.2015.03.060 - ,
Transient model for thermoelectric generator systems harvesting from the natural ambient temperature cycle ,Proceedings Power MEMS ,pp 431-434 , 2010, https://doi.org/https://doi.org/10.3390/electronics9061015 - , The performance of direct and indirect use of ground surface thermal energy in buildings, Master Thesis, Mechanical Engineering Department, Jordan University of Science & Technology (JUST), 2018
- , Environmentally assisted cracking (EAC) in oil and gas production, in Stress corrosion cracking, Stress corrosion cracking, Elsevier, 2011
- ,
Evaluation of the thermoelectric energy harvesting potential at different latitudes using solar flat panels systems with buried heat sink ,Applied Science , Vol. 8 (12),pp 2641 , 2018, https://doi.org/https://doi.org/10.3390/app8122641 - ,
Compact water-cooled thermoelectric generator (TEG) based on a portable gas stove ,Energies , Vol. 11 (9),pp 2231 , 2018, https://doi.org/https://doi.org/10.3390/en11092231 - ,
Measurement of thermal conductivity and specific heat by impedance spectroscopy of Bi2Te3 thermoelectric element ,Review of Scientific Instruments , Vol. 90 (4),pp 046104 , 2019, https://doi.org/https://doi.org/10.1063/1.5079832 - ,
Spatiotemporal rule of heat transfer on a soil/finned tube interface ,Sensors , Vol. 19 (5),pp 1159 , 2019, https://doi.org/https://doi.org/10.3390/s19051159 - ,
Stainless steel heat pipe fabrication, performance testing and modeling ,Energy Procedia , Vol. 105 ,pp 4745-4750 , 2017, https://doi.org/https://doi.org/10.1016/j.egypro.2017.03.1032 - , Heat and mass transfer: fundamentals and applications, McGraw-Hill Higher Education, 2014
- , Fundamentals of Heat and Mass Transfer, 8th Edition, 2018
- , Heat Engineering, Higher Education Press, 2004


