


Energy, with a heavy reliance on fossil fuels, is closely intertwined with climate change and sustainable development. While climate change is obviously a global environmental problem, nevertheless there is potential for local actions for sustainable transition to renewable locally produced energy and CO2 and air pollutants emission reduction.
Nowadays, there are numerous models that can generate possible scenarios for the evolution of energy systems applying different approaches such as:
A medium- to long-term energy system planning;
Energy policy analysis, and scenario development [1];
The different potential energy mixes not only for the whole of Europe, but also for defined regions or countries [2];
Long-term projections of energy supply, demand, and prices by sector [3];
Electricity prices and fuel costs [4];
Integration of renewable sources in the energy systems of island or other isolated locations [5], etc.
Connolly et al. [6] give a recent review of computer tools for analyzing the integration of renewable energy into various energy systems.
The objective of this paper is to develop a dynamic electricity demand-supply and gaseous emission model that could be used for these main purposes:
To examine mid- to long-term scenario studies simulating the relevant developments of electricity supply-demand for the Republic of Kosovo;
To simulate emissions of CO2, SO2, NOx and dust from coal combustion in power plants. The projections can be evaluated to determine the ability of various reduction strategies to achieve desired CO2, SO2, NOx and dust emission levels.
In this study, computer programming software, STELLA [7] was used to construct the dynamic model for electricity supply-demand and gaseous emissions system.
In this paper is described the construction of a new model, which is referred to as a dynamic supply-demand and gaseous emission model. This model makes use of Systems Dynamics Modeling, developed by Forrester as a methodology [8], initially applied to corporate problems and called as industrial dynamics.
The issue of present and future demand and supply of electricity is of great interest for many aspects of the modern world. There are different sources of electricity demand which have different growth characteristics. Growth in demand sourced from the industry, for example, has different drivers to growth associated with domestic residences. Thus, one way of looking at the future of electricity demand and supply is to consider various trends in demand and supply at the end-user sector level. In the end-use approach the electricity demand sector is divided into relevant (sub) sectors (e.g., industry, transport, residential), which are then divided over the relevant services (e.g., space heating, lighting).
Electricity demand modeling considered in this study is focused on major electricity demand sectors:
Residential sector;
-
Space heating;
-
Cooking;
-
Hot water and other uses.
-
Industrial sector: including low and high voltage industrial customers;
Service sector: including all low-voltage non-residential customers such as;
-
Commercial services;
-
Public services;
-
Agriculture, etc.
-
Electricity generation sectors;
Nonrenewable energy sector:
Electricity generation from nonrenewable sources.
Renewable energy sector;
Electricity generation from renewable sources, and for developing projections of CO2, SO2 and NOx emissions from electricity generation.
Gaseous and air pollution emission sector.
The sum of flows of electricity from electricity generation sectors is subtracted from the sum of electricity demands, giving the result for total electricity demand - supply balance† (see Appendix).
Accurate and reliable electricity demand forecasts are very important in order to develop alternatives and solutions for future electricity needs. This is particularly important for residential sector, since in many countries, it is a substantial consumer of electricity and therefore a focus for electricity consumption efforts. Electricity use in this sector includes energy for space heating, air conditioning, cooking, cleaning, washing, drying, lighting, cooling and another electrical uses.
Population is one of the most important factors that influence the electricity demand supply in residential sector. The size of population is depending on the population growth rate. Household size is included in the model to capture the impact of the number of inhabitants per household on the demand for electricity. The number of household is determined by two factors, i.e. household size (number of family member within a household) and total population. The total number of household has been calculated as the ratio between the population and the number of principal houses. The total electricity consumption by residential sector was obtained by multiplying the number of households with the average demand per household.
The total electricity consumption from the residential sub-model (see Appendix), was assumed to be based on four main factors i.e. population (Population), number of households (Number_of_Households),‡) average electricity consumption per household (Avg_demand_per_Household_user) and household electricity consumption growth rate (Growth_rate_ demand_per_residential_user). Average electricity consumption per household is calculated from the expression:
where the variable (Demand_per_residential_user_change) represents the change of consumption of electricity during time dt. While modeling of electricity consumption in this sector, one should be aware that average electricity demand per household decreases slowly with time. For example, for US residential sector it was 12.3 MWh in 2011 and is expected to drop to 11.5 MWh in 2040 [6]. Thus, the consumption of the electricity from the residential sector is calculated by the expression:
Electricity is one of the basic inputs for industrial growth with significant impact on the overall performance of the national economy. Electricity is consumed in the industrial sector for a wide range of activities which are involved in manufacturing industries (food, pulp and paper, chemicals, refining, iron and steel, nonferrous metals, and nonmetallic minerals, among others) and in nonmanufacturing industries (agriculture, mining and construction, and non-specified others). Industrial electricity demand varies across regions and countries, depending on the level and mix of economic activity and technological development, among other factors.
During last few years, a tendency is observed toward an increase in the industrial sector. About 40% of industrial demand growth is driven by electricity in 2010 [9]. The trend of the industrial electricity consumption of a country is estimated by analyzing macro-economic indicators, Gross Domestic Product (GDP) trends and other factors that influence electricity demand of this sector [10]. Industry specific studies may yield information on expectations of growth within this sector [6].
Industrial electricity consumption is divided into two groups: distribution customer, supplied at Low and Medium Voltage (LV), and direct customers, supplied at High Voltage (HV). The basic calculations for estimation of electricity consumption by industrial sector are as follows: Electricity demand in the industrial sector (Industrial_demand) in this model is expressed as the sum of low voltage (LV_industrial_demand) and high industrial consumers (HV_industrial_demand). The dynamics of low voltage industrial sector demand depends on the number of industrial customers (NLV_Industrial_user) and is expressed by the equation:
On the other hand, industrial growth is expected to raise the number of industrial customers (New_LV_industrial_user) and increase of electricity consumption by each industrial customer. Similar relations also apply to high voltage industrial sector.
In the service sector, also referred to as the commercial or tertiary sector, are several groups of customers supplied at low voltage: artisans, commercial services, public services, public lighting, agriculture, public transport infrastructure and others. Knowledge about the electricity demand of the service sector by end-use or by sub-sector is crucial to determine the impact of novel technologies and other energy-efficiency measures. The methodologies used for estimating electricity consumption by service and industrial sector are similar.
Electricity demand in the service sector (Service_Demand) depends on the number of customers (Number_of_Service_users):
and each customer demand for electricity (Demand_per_Service_user). On the other hand due to the growth of the service sector it is expected to raise the number of customers:
and to increase electricity consumption by each consumer in this sector (New_Service_users).
The electricity generation sector consists of two sub-sectors: nonrenewable energy sub-sector (that includes electricity generation from nonrenewable energy sources) and renewable energy sub-sector (that includes electricity generation from renewable energy sources). The total annual electricity generation E from the all production power plants and all renewable sources is calculated by the equation:
where:
NREi - total annual electricity generation from nonrenewable electricity sources;
REi - total annual electricity generation from renewable electricity sources respectively, for the given year (i).
The continuing growth of the world energy consumption during recent decades has also influenced its level of carbon dioxide (CO2), sulfur dioxide (SO2) and nitrogen oxides (NOx) emissions. Since the Industrial Revolution, annual global carbon dioxide emissions from fossil-fuel combustion dramatically increased to over 31 Gt CO2 in 2011 [11].
Fuel combustion in power plants for electricity generation is a complex phenomenon which results in emissions of different gases at different levels. There are several types of fuel that can be used by power plants: traditional fuels (coal, lignite, peat, natural gas, oil, and uranium) and also: Municipal Solid Waste (MSW), biofuel and hydrogen or blast furnace gas.
The projection of CO2, SO2, NOx and dust emissions from combustion in stationary plants is also estimated by this model. The gaseous emissions per unit per year can be calculated from the electricity generated, the efficiency and specific gaseous emissions of various fuels (for lignite, see Table.1). If fuels are used for electricity generation, gaseous emissions increase with the reciprocal of the power plant efficiency. The summation of these individual gas emission data leads to the total annual emission of GHG and air pollutants Ei per unit i of power generation from Thermal Power Plant (TPP) for a specific fuel used according to the formula:
where:
k = CO2, NOx, SO2 stands for respective gases;
EGi - electricity generated per unit i [kWh];
Efi - power plant efficiency;
EFki - specific gaseous emissions of various fuels (kg of specific gaseous emission per MWh).
Emission factors for lignite for Kosova power plants: unit A (EFA); unit B (EFB); and New Kosova (EFC) [12]
CO2 [t/MWh] |
NOx [kg/MWh] |
SO2 [kg/MWh] |
Dust [kg/MWh] |
CH4 [kg/MWh] |
CO [kg/MWh] |
||||||||||||
|---|---|---|---|---|---|---|---|---|---|---|---|---|---|---|---|---|---|
EF |
EF |
EF |
EF |
EF |
EF |
EF |
EF |
EF |
EF |
EF |
EF |
EF |
EF |
EF |
EF |
EF |
EF |
1.5 |
1.4 |
0.8 |
4 |
3.8 |
1.55 |
3.2 |
3.1 |
0.5 |
3.4 |
1.4 |
0.05 |
0.33 |
0.3 |
0.07 |
0.065 |
0.06 |
0.027 |
Initial values of the emission factors are taken from the values presented in Table 1.
Energy, economy and environment models are often used to look at opportunities and costs of reducing Greenhouse Gases (GHGs). Achieving this reduction using energy from biomass, solar, wind and other renewable sources and/or nuclear energy seems to be a viable alternative [13]. Otherwise, the response of the climate system to increasing greenhouse gas concentrations and other anthropogenic forces includes the potential for ‘rapid climate change’ [14].
The total net electricity demand is the sum of the electricity demands for all three sectors, residential, service and industrial, for each year. However, all electricity supplied to a distribution utility does not reach the end consumer, a portion of electricity lost. Electricity losses can be divided into two categories: technical and non-technical (or commercial). Technical losses occur naturally and consist mainly of power dissipation in electricity system components such as transmission and distribution lines, transformers, and measurement systems. There are many types of non-technical losses: non-payment by customers, electricity theft, errors in technical losses computation, errors in accounting and record keeping that distort technical information, etc. Electricity losses are unavoidable and must be modeled before accurate representation can be calculated. Electricity demand from all three sectors is calculated from the expression:
Total electricity demand (annual average) is the total net demand of customers increased by transmission and distribution losses that must be supplied to the electrical system by the generation plants and/or by importing from neighboring countries.
One of the main factors that influence the electricity demand is the population. In Figure 1a, a gradual increase of population and number of households is seen. It must be stressed that, as far as we know, these are among the first published results in connection with the case study, which use the data of Population Registration Act of 2011 [15], which is 1,789 million. Since the previous registration had been carried out 30 years ago, most publications so far relied on numbers differing significantly from those in [12], [16], a fact that influenced the obtained results.
Population growth (blue line - 1), and total number of households (red line - 2) (a); adapted from [15], [17]. Forecast of electricity demand in the residential [GWh] (blue line - 1), industrial sector [GWh] (red line - 2) and service sector [GWh] (black line - 3) (b); adapted from [17]
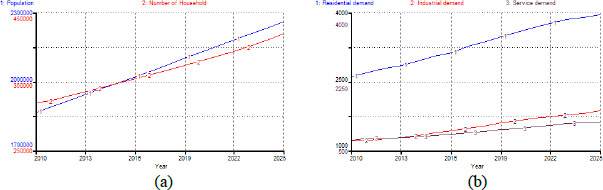
Up to 95–97% of the electricity in Kosovo is provided by the lignite power plants: Kosova A and Kosova B with effective capacity 870 MW. The construction of the TPP New Kosova is planned for the year 2018 [16]. In the same year TPP Kosova A is planned to go out of service. The remaining 3–5% of electric power only is produced from renewable resources: hydroelectric power generation is provided mainly by the Hydro Power Plant (HPP) Ujman with a capacity of 2 × 17.5 MW = 35 MW and HPP of Lumbardhi with a capacity of 8.3 MW. Thus, production capacity at disposal is about 900 MW. Total annual electricity generation from all production units is calculated by eq. (6). Thus, electricity consumption for 2013 was 4,944 GWh, out of which 2,852 GWh was used for residential, 1,285 GWh for industry and 807 GWh for services and it is foreseen that this electricity consumption will be gradually increased according to Figure 1b [16]. The total net demand forecasts for users are calculated by summing the electricity demands for all three sectors, for each year.
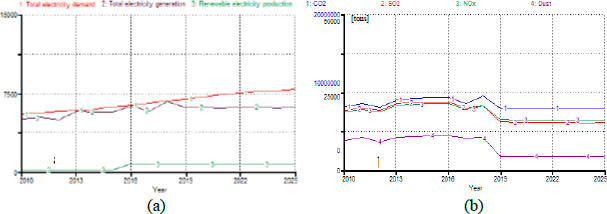
Figures 2a and 2b show the future development of Kosovo’s power system without any additional energy or climate policies implemented (the-Business-As-Usual, BAU, scenario). During the whole period 1999-2010, annual domestic electricity generation has been below the level of demand. This shortage of electricity will continue increasing if new generating capacities are not built (Figure 2a) in the near future, which is accompanied by an increase of greenhouse gas emissions and air pollution (Figure 2b). From this model, three baseline scenarios are simulated for new nonrenewable generation capacity (300 MW, 600 MW and 1,000 MW). For the same period, projected electricity generation from renewable resources is simulated for three scenarios, with an average growth of approximately 10% of the total electricity generation [18].
Values obtained from the model: total electricity demand (red line - 1), total electricity generation (black line - 2) and renewable electricity generation (green line - 3) (a); and CO2 (blue line - 1), SO2 (red line - 2), NOx (green line - 3) and dust (pink line - 4) emissions (b); for Business-As-Usual (BAU) case

According to this scenario, construction of a TPP New Kosova with 300 MW is taken into account, while the percentage of the participation of renewable energy in the total electricity generation is 10%. From Figure 3a it is seen that the values of total electricity generation (black line-2) are always less than the values of electricity demand (red line-1). This means that consumers' demands for electricity would not be fulfilled, so that Kosovo’s electric power system would not be self-sufficient; therefore we will not proceed with disussion of this scenario. According to this scenario, emission of gases and dust are still at low levels (in comparison with other scenarios) and after the year 2018, indicate a slight and stable decrease until the year 2025 (Figure 3b).
Values obtained from the model: total electricity demand (red line - 1), total electricity generation (black line - 2) and renewable electricity generation (green line - 3) (a); and CO2 (blue line - 1), SO2 (red line - 2), NOx (green line - 3) and dust (pink line - 4) emissions (b); for LGS scenario
According to this scenario, apart from electric power produced from the existing lignite power plants, construction of a TPP New Kosova with 600 MW is taken into account, while the renewable energy from the year 2018 to the year 2025 will consist of 10% of the total electricity generation in Kosovo.
In Figure 4a, this is presented as a rapid increase in the black line, which represents the total electricity generation. This curve is very close to the red-line curve (total electricity demand), which means that, to have a sustainable development of the energetic system the increase of the renewable energy must be 10%. From Figure 4b, we see that from the year 2010 until the year 2013, as a result of increase in electricity consumed, we have an almost linear increase of emission of gases and dust. Thereafter, stabilization and slight increase of GHG gas emissions and air pollution occur. In the long term, from year 2017 to 2025 we will have a significant reduction of NOx and air pollutants (dust and SO2) while values of CO2 show a very slight increase in comparison with previous values.
Values obtained from the model: total electricity demand (red line - 1), total electricity generation (black line - 2) and renewable electricity generation (green line - 3) (a); CO2 (blue line - 1), SO2 (red line - 2), NOx (green line - 3) and dust (pink line - 4) emissions (b); for MGS scenario
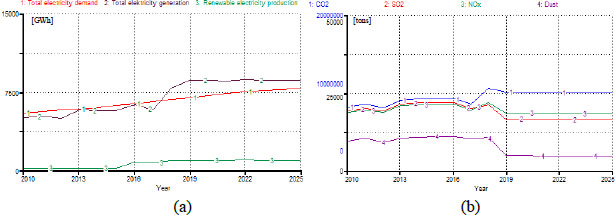
Compared to the Business-As-Usual (BAU) case, CO2 emission is reduced by 60% and air pollutants (dust and SO2) and NOx are significantly reduced by 40%. These reductions would be the consequence of the use of renewable energy resources (10% of the total electricity generation) and of new technologies in generation of electricity from lignite. Considering resources of renewable and nonrenewable energy of Kosovo [17], such a scenario (building of a TPP with a capacity of 600 MW and with electricity generation from renewable energy resources of 800 GWh) could be realized, and would provide an optimal solution in fulfillment of demands for electricity supply and environmental demands as well.
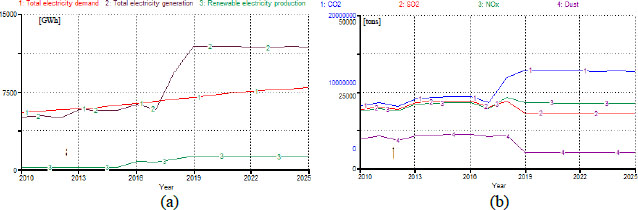
Basic considerations of this scenario is that the Kosovo’s electric power system will advance mainly due to the high increase of electricity production from lignite. Apart from electric power produced from the lignite power plants Kosova A (TPP Kosovo A will remain in service through 2018) and Kosova B, in this scenario the growth of electricity generation from the TPP New Kosova with a capacity 1,000 MW, planned to start operating at 2018 is also considered, as well as the participation of renewable energy with 10% of the total electricity generation.
In Figure 5a, on account of a significant increase in total electricity generation, a large discrepancy is observed between it and the total electricity demand. In Figure 5b, it is shown that according to this scenario, there is a rapid increase of CO2 after the year 2019. Taking into consideration the high cost of building such capacities as well as the impact on the environment that could be considerable since CO2 could increase sharply, it seems that this scenario is not an optimal solution.
From analysis of these scenarios it follows that the most favorable and most realizable scenario is the scenario MGS, i.e. building of TPP New Kosova with capacity 600 MW and of capacities with renewable energy with at least 10% of the total electricity generation.
Values obtained from the model: total electricity demand [GWh] (red line - 1), total electricity generation [GWh] (black line - 2) and renewable electricity generation [GWh] (green line - 3) (a); CO2 (blue line - 1), SO2 (red line - 2), NOx (green line - 3) and dust (pink line - 4) emissions (b); for HGS scenario
A new model has been developed for analyzing of the current situation of electricity generation and consumption and recent trends electricity development of Kosovo, as well. It is used to also develop projections of CO2, SO2, NOx and dust emissions from electricity generation. The time span used here is the period 2010 – 2025. From the results obtained, it can be concluded that:
Due to the population increase in Kosovo during the period 2010 – 2025, our scenarios indicate a strong increase in electricity use in all investigated sectors, and in the demand for electricity in general;
According to HGS (building of a TPP with a capacity of 1,000 MW), Kosovo’s electric power system could fulfill completely and even exceed demands for electricity supply. Nevertheless, in this case greenhouse gas emissions and air pollution would increase sharply and impact on the environment could be considerable;
According to the LGS scenario, GHG and dust emissions retain their levels, but consumers' demands for electricy would not be fulfilled, so that Kosovo’s electric power system would not be a self-sufficient one;
From analysis of these scenarios it follows that the most optimal and most realizable scenario is the medium growth scenario MGS, i.e. building of TPP New Kosova with capacity 600 MW and of capacities with renewable energy with at least 10% of the total electricity generation.
We would like to acknowledge the financial support of the Ministry of Education, Science and Technology of Republic of Kosovo.
- ,
International Institute for Applied Systems Analysis, Energy Modeling Framework: Model for Energy Supply Strategy Alternatives and their General Environmental impact , , (MESSAGE). - ,
Ea Energy Analyses, The STREAM modelling tool. , - , U.S. Energy Information Administration, Annual Energy Outlook with projections to 2040, 2013
- ,
Electricity Prices and Fuel Costs: Long-run Relations and Short-run Dynamics ,Energy Economics , Vol. Vol. 31 (No. 3), :503-5092009, https://doi.org/10.1016/j.eneco.2009.02.001 - ,
H2RES, Energy Planning Tool for Island Energy Systems - The Case of the Island of Mljet ,Int. J. Hydrogen Energy , Vol. Vol. 34 (No. 16), :7015-262009, https://doi.org/10.1016/j.ijhydene.2008.12.054 - ,
A Review of Computer Tools for analysing the Integration of Renewable Energy into Various Energy Systems ,Applied Energy , Vol. Vol. 87 (No. 4), :1059-10822010, https://doi.org/10.1016/j.apenergy.2009.09.026 - ,
- , World Dynamics, 1971
- , International Energy Agency, Key World Energy Statistics, 2012
- , The Outlook for Energy: A View To 2040, 2013
- , International Energy Agency, CO2 Emissions from Fuel Combustion, Highlights Version from International Energy Agency, 2012
- ,
Forecast of Energy Demand in Kosovo for the Period 2007-2016 ,Ministry of Energy and Mining MEM , 2007 - ,
Climate Changes, Biofuels and the Sustainable Future ,International Journal of Hydrogen Energy , Vol. Vol. 34 (Issue 16), :6980-69832009, https://doi.org/10.1016/j.ijhydene.2008.11.004 - ,
Modelling rapid climate changes and analyzing their impacts ,Management of Environmental Quality An International Journal , Vol. Vol. 19 , :422-4322008, https://doi.org/10.1108/14777830810878614 - ,
Estimation of Population of Kosovo 2012, Kosovo Agency of Statistics , 2013 - ,
The Energy Strategy of Republic of Kosovo 2009-2018 ,Ministry of Energy and Mining MEM , 2009 - ,
Long Term Energy Balance of the Republic of Kosovo 2013-2022 ,Ministry of Economic Development , 2012 - , Scenario-based Analysis of Kosovo’s Power Sector and CO2 and Air Pollutants Emissions Reductions, Proceeding of the Sustainable Development of Energy Water and Environment Systems, 8th Dubrovnik Conference, 2013